1 Market Overview
1.1 Sealing Products in Semiconductor Product Introduction
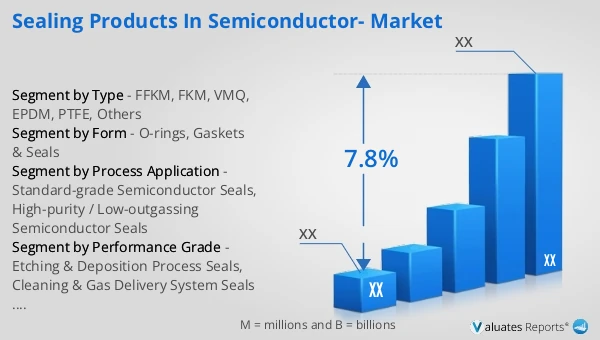
1.2 Global Sealing Products in Semiconductor Market Size Forecast
1.2.1 Global Sealing Products in Semiconductor Sales Value (2021–2032)
1.2.2 Global Sealing Products in Semiconductor Sales Volume (2021–2032)
1.2.3 Global Sealing Products in Semiconductor Sales Price (2021–2032)
1.3 Sealing Products in Semiconductor Market Trends & Drivers
1.3.1 Sealing Products in Semiconductor Industry Trends
1.3.2 Sealing Products in Semiconductor Market Drivers & Opportunities
1.3.3 Sealing Products in Semiconductor Market Challenges
1.3.4 Sealing Products in Semiconductor Market Restraints
1.3.5 Impact of U.S. Tariffs
1.4 Assumptions and Limitations
1.5 Study Objectives
1.6 Years Considered
2 Competitive Analysis by Company
2.1 Global Sealing Products in Semiconductor Players Revenue Ranking (2025)
2.2 Global Sealing Products in Semiconductor Revenue by Company (2021–2026)
2.3 Global Sealing Products in Semiconductor Sales Volume Ranking of Players (2025)
2.4 Global Sealing Products in Semiconductor Sales Volume by Company (2021–2026)
2.5 Global Sealing Products in Semiconductor Average Price by Company (2021–2026)
2.6 Key Manufacturers Sealing Products in Semiconductor Manufacturing Base and Headquarters
2.7 Key Manufacturers Sealing Products in Semiconductor Product Offerings
2.8 Key Manufacturers Start of Mass Production of Sealing Products in Semiconductor
2.9 Sealing Products in Semiconductor Market Competitive Analysis
2.9.1 Sealing Products in Semiconductor Market Concentration Rate (2021–2026)
2.9.2 Global 5 and 10 Largest Manufacturers by Sealing Products in Semiconductor Revenue in 2025
2.9.3 Global Companies by Tier (Tier 1, Tier 2, Tier 3), based on Sealing Products in Semiconductor revenue, 2025
2.10 Mergers & Acquisitions and Expansion
3 Segmentation Sealing Products in Semiconductor Market Classification
3.1 Introduction by Type
3.1.1 FFKM
3.1.2 FKM
3.1.3 VMQ
3.1.4 EPDM
3.1.5 PTFE
3.1.6 Others
3.1.7 Global Sealing Products in Semiconductor Sales Value by Type
3.1.7.1 Global Sealing Products in Semiconductor Sales Value by Type (2021 vs 2025 vs 2032)
3.1.7.2 Global Sealing Products in Semiconductor Sales Value, by Type (2021–2032)
3.1.7.3 Global Sealing Products in Semiconductor Sales Value, by Type (%), 2021–2032
3.1.8 Global Sealing Products in Semiconductor Sales Volume by Type
3.1.8.1 Global Sealing Products in Semiconductor Sales Volume by Type (2021 vs 2025 vs 2032)
3.1.8.2 Global Sealing Products in Semiconductor Sales Volume, by Type (2021–2032)
3.1.8.3 Global Sealing Products in Semiconductor Sales Volume, by Type (%), 2021–2032
3.1.9 Global Sealing Products in Semiconductor Average Price by Type (2021–2032)
3.2 Introduction by Form
3.2.1 O-rings
3.2.2 Gaskets & Seals
3.2.3 Global Sealing Products in Semiconductor Sales Value by Form
3.2.3.1 Global Sealing Products in Semiconductor Sales Value by Form (2021 vs 2025 vs 2032)
3.2.3.2 Global Sealing Products in Semiconductor Sales Value, by Form (2021–2032)
3.2.3.3 Global Sealing Products in Semiconductor Sales Value, by Form (%), 2021–2032
3.2.4 Global Sealing Products in Semiconductor Sales Volume by Form
3.2.4.1 Global Sealing Products in Semiconductor Sales Volume by Form (2021 vs 2025 vs 2032)
3.2.4.2 Global Sealing Products in Semiconductor Sales Volume, by Form (2021–2032)
3.2.4.3 Global Sealing Products in Semiconductor Sales Volume, by Form (%), 2021–2032
3.2.5 Global Sealing Products in Semiconductor Average Price by Form (2021–2032)
3.3 Introduction by Process Application
3.3.1 Standard-grade Semiconductor Seals
3.3.2 High-purity / Low-outgassing Semiconductor Seals
3.3.3 Global Sealing Products in Semiconductor Sales Value by Process Application
3.3.3.1 Global Sealing Products in Semiconductor Sales Value by Process Application (2021 vs 2025 vs 2032)
3.3.3.2 Global Sealing Products in Semiconductor Sales Value, by Process Application (2021–2032)
3.3.3.3 Global Sealing Products in Semiconductor Sales Value, by Process Application (%), 2021–2032
3.3.4 Global Sealing Products in Semiconductor Sales Volume by Process Application
3.3.4.1 Global Sealing Products in Semiconductor Sales Volume by Process Application (2021 vs 2025 vs 2032)
3.3.4.2 Global Sealing Products in Semiconductor Sales Volume, by Process Application (2021–2032)
3.3.4.3 Global Sealing Products in Semiconductor Sales Volume, by Process Application (%), 2021–2032
3.3.5 Global Sealing Products in Semiconductor Average Price by Process Application (2021–2032)
3.4 Introduction by Performance Grade
3.4.1 Etching & Deposition Process Seals
3.4.2 Cleaning & Gas Delivery System Seals
3.4.3 Global Sealing Products in Semiconductor Sales Value by Performance Grade
3.4.3.1 Global Sealing Products in Semiconductor Sales Value by Performance Grade (2021 vs 2025 vs 2032)
3.4.3.2 Global Sealing Products in Semiconductor Sales Value, by Performance Grade (2021–2032)
3.4.3.3 Global Sealing Products in Semiconductor Sales Value, by Performance Grade (%), 2021–2032
3.4.4 Global Sealing Products in Semiconductor Sales Volume by Performance Grade
3.4.4.1 Global Sealing Products in Semiconductor Sales Volume by Performance Grade (2021 vs 2025 vs 2032)
3.4.4.2 Global Sealing Products in Semiconductor Sales Volume, by Performance Grade (2021–2032)
3.4.4.3 Global Sealing Products in Semiconductor Sales Volume, by Performance Grade (%), 2021–2032
3.4.5 Global Sealing Products in Semiconductor Average Price by Performance Grade (2021–2032)
4 Segmentation by Application
4.1 Introduction by Application
4.1.1 Dry/Wet Etching
4.1.2 Plasma Systems
4.1.3 Chemical Vapor Deposition (CVD)
4.1.4 Atomic Layer Deposition (ALD)
4.1.5 Physical Vapor Deposition (PVD)
4.1.6 Others
4.2 Global Sealing Products in Semiconductor Sales Value by Application
4.2.1 Global Sealing Products in Semiconductor Sales Value by Application (2021 vs 2025 vs 2032)
4.2.2 Global Sealing Products in Semiconductor Sales Value, by Application (2021–2032)
4.2.3 Global Sealing Products in Semiconductor Sales Value, by Application (%), 2021–2032
4.3 Global Sealing Products in Semiconductor Sales Volume by Application
4.3.1 Global Sealing Products in Semiconductor Sales Volume by Application (2021 vs 2025 vs 2032)
4.3.2 Global Sealing Products in Semiconductor Sales Volume, by Application (2021–2032)
4.3.3 Global Sealing Products in Semiconductor Sales Volume, by Application (%), 2021–2032
4.4 Global Sealing Products in Semiconductor Average Price by Application (2021–2032)
5 Segmentation by Region
5.1 Global Sealing Products in Semiconductor Sales Value by Region
5.1.1 Global Sealing Products in Semiconductor Sales Value by Region: 2021 vs 2025 vs 2032
5.1.2 Global Sealing Products in Semiconductor Sales Value by Region (2021–2026)
5.1.3 Global Sealing Products in Semiconductor Sales Value by Region (2027–2032)
5.1.4 Global Sealing Products in Semiconductor Sales Value by Region (%), 2021–2032
5.2 Global Sealing Products in Semiconductor Sales Volume by Region
5.2.1 Global Sealing Products in Semiconductor Sales Volume by Region: 2021 vs 2025 vs 2032
5.2.2 Global Sealing Products in Semiconductor Sales Volume by Region (2021–2026)
5.2.3 Global Sealing Products in Semiconductor Sales Volume by Region (2027–2032)
5.2.4 Global Sealing Products in Semiconductor Sales Volume by Region (%), 2021–2032
5.3 Global Sealing Products in Semiconductor Average Price by Region (2021–2032)
5.4 North America
5.4.1 North America Sealing Products in Semiconductor Sales Value, 2021–2032
5.4.2 North America Sealing Products in Semiconductor Sales Value by Country (%), 2025 vs 2032
5.5 Europe
5.5.1 Europe Sealing Products in Semiconductor Sales Value, 2021–2032
5.5.2 Europe Sealing Products in Semiconductor Sales Value by Country (%), 2025 vs 2032
5.6 Asia Pacific
5.6.1 Asia Pacific Sealing Products in Semiconductor Sales Value, 2021–2032
5.6.2 Asia Pacific Sealing Products in Semiconductor Sales Value by Region (%), 2025 vs 2032
5.7 South America
5.7.1 South America Sealing Products in Semiconductor Sales Value, 2021–2032
5.7.2 South America Sealing Products in Semiconductor Sales Value by Country (%), 2025 vs 2032
5.8 Middle East & Africa
5.8.1 Middle East & Africa Sealing Products in Semiconductor Sales Value, 2021–2032
5.8.2 Middle East & Africa Sealing Products in Semiconductor Sales Value by Country (%), 2025 vs 2032
6 Segmentation by Key Countries/Regions
6.1 Key Countries/Regions Sealing Products in Semiconductor Sales Value Growth Trends, 2021 vs 2025 vs 2032
6.2 Key Countries/Regions Sealing Products in Semiconductor Sales Value and Sales Volume
6.2.1 Key Countries/Regions Sealing Products in Semiconductor Sales Value, 2021–2032
6.2.2 Key Countries/Regions Sealing Products in Semiconductor Sales Volume, 2021–2032
6.3 United States
6.3.1 United States Sealing Products in Semiconductor Sales Value, 2021–2032
6.3.2 United States Sealing Products in Semiconductor Sales Value by Type (%), 2025 vs 2032
6.3.3 United States Sealing Products in Semiconductor Sales Value by Application, 2025 vs 2032
6.4 Europe
6.4.1 Europe Sealing Products in Semiconductor Sales Value, 2021–2032
6.4.2 Europe Sealing Products in Semiconductor Sales Value by Type (%), 2025 vs 2032
6.4.3 Europe Sealing Products in Semiconductor Sales Value by Application, 2025 vs 2032
6.5 China
6.5.1 China Sealing Products in Semiconductor Sales Value, 2021–2032
6.5.2 China Sealing Products in Semiconductor Sales Value by Type (%), 2025 vs 2032
6.5.3 China Sealing Products in Semiconductor Sales Value by Application, 2025 vs 2032
6.6 Japan
6.6.1 Japan Sealing Products in Semiconductor Sales Value, 2021–2032
6.6.2 Japan Sealing Products in Semiconductor Sales Value by Type (%), 2025 vs 2032
6.6.3 Japan Sealing Products in Semiconductor Sales Value by Application, 2025 vs 2032
6.7 South Korea
6.7.1 South Korea Sealing Products in Semiconductor Sales Value, 2021–2032
6.7.2 South Korea Sealing Products in Semiconductor Sales Value by Type (%), 2025 vs 2032
6.7.3 South Korea Sealing Products in Semiconductor Sales Value by Application, 2025 vs 2032
6.8 Southeast Asia
6.8.1 Southeast Asia Sealing Products in Semiconductor Sales Value, 2021–2032
6.8.2 Southeast Asia Sealing Products in Semiconductor Sales Value by Type (%), 2025 vs 2032
6.8.3 Southeast Asia Sealing Products in Semiconductor Sales Value by Application, 2025 vs 2032
6.9 India
6.9.1 India Sealing Products in Semiconductor Sales Value, 2021–2032
6.9.2 India Sealing Products in Semiconductor Sales Value by Type (%), 2025 vs 2032
6.9.3 India Sealing Products in Semiconductor Sales Value by Application, 2025 vs 2032
7 Company Profiles
7.1 Dupont
7.1.1 Dupont Company Information
7.1.2 Dupont Introduction and Business Overview
7.1.3 Dupont Sealing Products in Semiconductor Sales, Revenue, Price and Gross Margin (2021–2026)
7.1.4 Dupont Sealing Products in Semiconductor Product Offerings
7.1.5 Dupont Recent Developments
7.2 NOK CORPORATION
7.2.1 NOK CORPORATION Company Information
7.2.2 NOK CORPORATION Introduction and Business Overview
7.2.3 NOK CORPORATION Sealing Products in Semiconductor Sales, Revenue, Price and Gross Margin (2021–2026)
7.2.4 NOK CORPORATION Sealing Products in Semiconductor Product Offerings
7.2.5 NOK CORPORATION Recent Developments
7.3 Eagle Industry
7.3.1 Eagle Industry Company Information
7.3.2 Eagle Industry Introduction and Business Overview
7.3.3 Eagle Industry Sealing Products in Semiconductor Sales, Revenue, Price and Gross Margin (2021–2026)
7.3.4 Eagle Industry Sealing Products in Semiconductor Product Offerings
7.3.5 Eagle Industry Recent Developments
7.4 Parker
7.4.1 Parker Company Information
7.4.2 Parker Introduction and Business Overview
7.4.3 Parker Sealing Products in Semiconductor Sales, Revenue, Price and Gross Margin (2021–2026)
7.4.4 Parker Sealing Products in Semiconductor Product Offerings
7.4.5 Parker Recent Developments
7.5 Daikin
7.5.1 Daikin Company Information
7.5.2 Daikin Introduction and Business Overview
7.5.3 Daikin Sealing Products in Semiconductor Sales, Revenue, Price and Gross Margin (2021–2026)
7.5.4 Daikin Sealing Products in Semiconductor Product Offerings
7.5.5 Daikin Recent Developments
7.6 VALQUA
7.6.1 VALQUA Company Information
7.6.2 VALQUA Introduction and Business Overview
7.6.3 VALQUA Sealing Products in Semiconductor Sales, Revenue, Price and Gross Margin (2021–2026)
7.6.4 VALQUA Sealing Products in Semiconductor Product Offerings
7.6.5 VALQUA Recent Developments
7.7 Trelleborg
7.7.1 Trelleborg Company Information
7.7.2 Trelleborg Introduction and Business Overview
7.7.3 Trelleborg Sealing Products in Semiconductor Sales, Revenue, Price and Gross Margin (2021–2026)
7.7.4 Trelleborg Sealing Products in Semiconductor Product Offerings
7.7.5 Trelleborg Recent Developments
7.8 Applied Seals
7.8.1 Applied Seals Company Information
7.8.2 Applied Seals Introduction and Business Overview
7.8.3 Applied Seals Sealing Products in Semiconductor Sales, Revenue, Price and Gross Margin (2021–2026)
7.8.4 Applied Seals Sealing Products in Semiconductor Product Offerings
7.8.5 Applied Seals Recent Developments
7.9 Saint-Gobain
7.9.1 Saint-Gobain Company Information
7.9.2 Saint-Gobain Introduction and Business Overview
7.9.3 Saint-Gobain Sealing Products in Semiconductor Sales, Revenue, Price and Gross Margin (2021–2026)
7.9.4 Saint-Gobain Sealing Products in Semiconductor Product Offerings
7.9.5 Saint-Gobain Recent Developments
7.10 Precision Polymer Engineering (IDEX)
7.10.1 Precision Polymer Engineering (IDEX) Company Information
7.10.2 Precision Polymer Engineering (IDEX) Introduction and Business Overview
7.10.3 Precision Polymer Engineering (IDEX) Sealing Products in Semiconductor Sales, Revenue, Price and Gross Margin (2021–2026)
7.10.4 Precision Polymer Engineering (IDEX) Sealing Products in Semiconductor Product Offerings
7.10.5 Precision Polymer Engineering (IDEX) Recent Developments
7.11 MNE Co., Ltd
7.11.1 MNE Co., Ltd Company Information
7.11.2 MNE Co., Ltd Introduction and Business Overview
7.11.3 MNE Co., Ltd Sealing Products in Semiconductor Sales, Revenue, Price and Gross Margin (2021–2026)
7.11.4 MNE Co., Ltd Sealing Products in Semiconductor Product Offerings
7.11.5 MNE Co., Ltd Recent Developments
7.12 Freudenberg
7.12.1 Freudenberg Company Information
7.12.2 Freudenberg Introduction and Business Overview
7.12.3 Freudenberg Sealing Products in Semiconductor Sales, Revenue, Price and Gross Margin (2021–2026)
7.12.4 Freudenberg Sealing Products in Semiconductor Product Offerings
7.12.5 Freudenberg Recent Developments
7.13 Greene Tweed
7.13.1 Greene Tweed Company Information
7.13.2 Greene Tweed Introduction and Business Overview
7.13.3 Greene Tweed Sealing Products in Semiconductor Sales, Revenue, Price and Gross Margin (2021–2026)
7.13.4 Greene Tweed Sealing Products in Semiconductor Product Offerings
7.13.5 Greene Tweed Recent Developments
7.14 Vulcan Seals
7.14.1 Vulcan Seals Company Information
7.14.2 Vulcan Seals Introduction and Business Overview
7.14.3 Vulcan Seals Sealing Products in Semiconductor Sales, Revenue, Price and Gross Margin (2021–2026)
7.14.4 Vulcan Seals Sealing Products in Semiconductor Product Offerings
7.14.5 Vulcan Seals Recent Developments
7.15 Maxmold Polymer
7.15.1 Maxmold Polymer Company Information
7.15.2 Maxmold Polymer Introduction and Business Overview
7.15.3 Maxmold Polymer Sealing Products in Semiconductor Sales, Revenue, Price and Gross Margin (2021–2026)
7.15.4 Maxmold Polymer Sealing Products in Semiconductor Product Offerings
7.15.5 Maxmold Polymer Recent Developments
7.16 Ceetak
7.16.1 Ceetak Company Information
7.16.2 Ceetak Introduction and Business Overview
7.16.3 Ceetak Sealing Products in Semiconductor Sales, Revenue, Price and Gross Margin (2021–2026)
7.16.4 Ceetak Sealing Products in Semiconductor Product Offerings
7.16.5 Ceetak Recent Developments
7.17 MITSUBISHI CABLE INDUSTRIES
7.17.1 MITSUBISHI CABLE INDUSTRIES Company Information
7.17.2 MITSUBISHI CABLE INDUSTRIES Introduction and Business Overview
7.17.3 MITSUBISHI CABLE INDUSTRIES Sealing Products in Semiconductor Sales, Revenue, Price and Gross Margin (2021–2026)
7.17.4 MITSUBISHI CABLE INDUSTRIES Sealing Products in Semiconductor Product Offerings
7.17.5 MITSUBISHI CABLE INDUSTRIES Recent Developments
7.18 GMORS
7.18.1 GMORS Company Information
7.18.2 GMORS Introduction and Business Overview
7.18.3 GMORS Sealing Products in Semiconductor Sales, Revenue, Price and Gross Margin (2021–2026)
7.18.4 GMORS Sealing Products in Semiconductor Product Offerings
7.18.5 GMORS Recent Developments
7.19 MFC Sealing Technology
7.19.1 MFC Sealing Technology Company Information
7.19.2 MFC Sealing Technology Introduction and Business Overview
7.19.3 MFC Sealing Technology Sealing Products in Semiconductor Sales, Revenue, Price and Gross Margin (2021–2026)
7.19.4 MFC Sealing Technology Sealing Products in Semiconductor Product Offerings
7.19.5 MFC Sealing Technology Recent Developments
7.20 IC SEAL
7.20.1 IC SEAL Company Information
7.20.2 IC SEAL Introduction and Business Overview
7.20.3 IC SEAL Sealing Products in Semiconductor Sales, Revenue, Price and Gross Margin (2021–2026)
7.20.4 IC SEAL Sealing Products in Semiconductor Product Offerings
7.20.5 IC SEAL Recent Developments
7.21 Northern Engineering (Sheffield) Ltd
7.21.1 Northern Engineering (Sheffield) Ltd Company Information
7.21.2 Northern Engineering (Sheffield) Ltd Introduction and Business Overview
7.21.3 Northern Engineering (Sheffield) Ltd Sealing Products in Semiconductor Sales, Revenue, Price and Gross Margin (2021–2026)
7.21.4 Northern Engineering (Sheffield) Ltd Sealing Products in Semiconductor Product Offerings
7.21.5 Northern Engineering (Sheffield) Ltd Recent Developments
7.22 Sigma Seals & Gaskets
7.22.1 Sigma Seals & Gaskets Company Information
7.22.2 Sigma Seals & Gaskets Introduction and Business Overview
7.22.3 Sigma Seals & Gaskets Sealing Products in Semiconductor Sales, Revenue, Price and Gross Margin (2021–2026)
7.22.4 Sigma Seals & Gaskets Sealing Products in Semiconductor Product Offerings
7.22.5 Sigma Seals & Gaskets Recent Developments
7.23 AIR WATER MACH
7.23.1 AIR WATER MACH Company Information
7.23.2 AIR WATER MACH Introduction and Business Overview
7.23.3 AIR WATER MACH Sealing Products in Semiconductor Sales, Revenue, Price and Gross Margin (2021–2026)
7.23.4 AIR WATER MACH Sealing Products in Semiconductor Product Offerings
7.23.5 AIR WATER MACH Recent Developments
8 Industry Chain Analysis
8.1 Sealing Products in Semiconductor Industrial Chain
8.2 Sealing Products in Semiconductor Upstream Analysis
8.2.1 Key Raw Materials
8.2.2 Key Suppliers of Raw Materials
8.2.3 Manufacturing Cost Structure
8.3 Midstream Analysis
8.4 Downstream Analysis (Customer Analysis)
8.5 Sales Model and Sales Channelss
8.5.1 Sealing Products in Semiconductor Sales Model
8.5.2 Sales Channels
8.5.3 Sealing Products in Semiconductor Distributors
9 Research Findings and Conclusion
10 Appendix
10.1 Research Methodology
10.1.1 Methodology/Research Approach
10.1.1.1 Research Programs/Design
10.1.1.2 Market Size Estimation
10.1.1.3 Market Breakdown and Data Triangulation
10.1.2 Data Source
10.1.2.1 Secondary Sources
10.1.2.2 Primary Sources
10.2 Author Details
10.3 Disclaimer