Rolling Stock Market
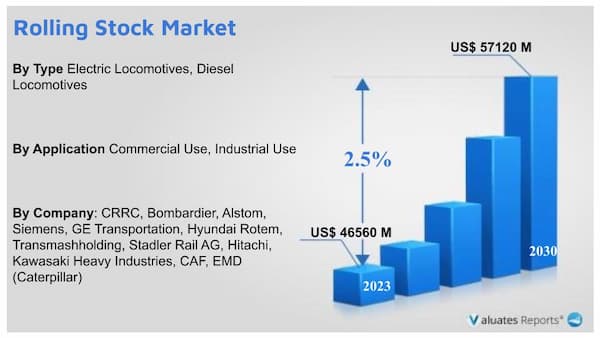
The global Rolling Stock market was valued at US$ 46560 million in 2023 and is anticipated to reach US$ 57120 million by 2030, witnessing a CAGR of 2.5% during the forecast period 2024-2030.
Automotive is a key driver of this industry. According to data from the World Automobile Organization (OICA), global automobile production and sales in 2017 reached their peak in the past 10 years, at 97.3 million and 95.89 million respectively. In 2018, the global economic expansion ended, and the global auto market declined as a whole. In 2022, there will wear units 81.6 million vehicles in the world. At present, more than 90% of the world's automobiles are concentrated in the three continents of Asia, Europe and North America, of which Asia automobile production accounts for 56% of the world, Europe accounts for 20%, and North America accounts for 16%. The world major automobile producing countries include China, the United States, Japan, South Korea, Germany, India, Mexico, and other countries; among them, China is the largest automobile producing country in the world, accounting for about 32%. Japan is the world's largest car exporter, exporting more than 3.5 million vehicles in 2022.
Report Scope
The Rolling Stock market size, estimations, and forecasts are provided in terms of output/shipments (Units) and revenue ($ millions), considering 2023 as the base year, with history and forecast data for the period from 2019 to 2030. This report segments the global Rolling Stock market comprehensively. Regional market sizes, concerning products by Type, by Application, and by players, are also provided.
For a more in-depth understanding of the market, the report provides profiles of the competitive landscape, key competitors, and their respective market ranks. The report also discusses technological trends and new product developments.
The report will help the Rolling Stock manufacturers, new entrants, and industry chain related companies in this market with information on the revenues, production, and average price for the overall market and the sub-segments across the different segments, by company, by Type, by Application, and by regions.
Scope of Rolling Stock Market Report
| Report Metric |
Details |
| Report Name |
Rolling Stock Market |
Segment by Type
|
-
Electric Locomotives
-
Diesel Locomotives
|
| Segment by Application |
-
Commercial Use
-
Industrial Use
|
| By Region |
- North America (United States, Canada)
- Europe (Germany, France, UK, Italy, Russia) Rest of Europe
- Nordic Countries
- Asia-Pacific (China, Japan, South Korea)
- Southeast Asia (India, Australia)
- Rest of Asia
- Latin America (Mexico, Brazil)
- Rest of Latin America
- Middle East & Africa (Turkey, Saudi Arabia, UAE, Rest of MEA)
|
| By Company |
CRRC, Bombardier, Alstom, Siemens, GE Transportation, Hyundai Rotem, Transmashholding, Stadler Rail AG, Hitachi, Kawasaki Heavy Industries, CAF, EMD (Caterpillar) |
| Forecast units |
USD million in value |
| Report coverage |
Revenue and volume forecast, company share, competitive landscape, growth factors and trends |
FAQ for this Report
1. What factors are driving growth in the Rolling Stock Market?
The Rolling Stock Market is driven by rising urbanization, increasing demand for efficient public transportation, and investments in railway infrastructure worldwide.
2. Who are the key players in the Rolling Stock Market?
Key players include major manufacturers and suppliers such as Alstom, Siemens, and Bombardier, who drive innovation and market expansion.
3. How is the Rolling Stock Market expected to grow in the coming years?
The market is projected to grow steadily due to advancements in technology, demand for sustainable transport, and government support for rail infrastructure.
4. What are the key segments in the Rolling Stock Market?
The market is segmented by types, such as locomotives, passenger coaches, and freight wagons, as well as by application in urban and intercity transport.
5. How does this report benefit businesses in the Rolling Stock industry?
This report provides insights on market trends, forecasts, and competitive analysis, helping businesses make informed decisions for growth and investment.
Table of Contents
1 Rolling Stock Market Overview
1.1 Product Definition
1.2 Rolling Stock Segment by Type
1.2.1 Global Rolling Stock Market Value Growth Rate Analysis by Type 2023 VS 2030
1.2.2 Electric Locomotives
1.2.3 Diesel Locomotives
1.3 Rolling Stock Segment by Application
1.3.1 Global Rolling Stock Market Value Growth Rate Analysis by Application: 2023 VS 2030
1.3.2 Commercial Use
1.3.3 Industrial Use
1.4 Global Market Growth Prospects
1.4.1 Global Rolling Stock Production Value Estimates and Forecasts (2019-2030)
1.4.2 Global Rolling Stock Production Capacity Estimates and Forecasts (2019-2030)
1.4.3 Global Rolling Stock Production Estimates and Forecasts (2019-2030)
1.4.4 Global Rolling Stock Market Average Price Estimates and Forecasts (2019-2030)
1.5 Assumptions and Limitations
2 Market Competition by Manufacturers
2.1 Global Rolling Stock Production Market Share by Manufacturers (2019-2024)
2.2 Global Rolling Stock Production Value Market Share by Manufacturers (2019-2024)
2.3 Global Key Players of Rolling Stock, Industry Ranking, 2022 VS 2023 VS 2024
2.4 Global Rolling Stock Market Share by Company Type (Tier 1, Tier 2 and Tier 3)
2.5 Global Rolling Stock Average Price by Manufacturers (2019-2024)
2.6 Global Key Manufacturers of Rolling Stock, Manufacturing Base Distribution and Headquarters
2.7 Global Key Manufacturers of Rolling Stock, Product Offered and Application
2.8 Global Key Manufacturers of Rolling Stock, Date of Enter into This Industry
2.9 Rolling Stock Market Competitive Situation and Trends
2.9.1 Rolling Stock Market Concentration Rate
2.9.2 Global 5 and 10 Largest Rolling Stock Players Market Share by Revenue
2.10 Mergers & Acquisitions, Expansion
3 Rolling Stock Production by Region
3.1 Global Rolling Stock Production Value Estimates and Forecasts by Region: 2019 VS 2023 VS 2030
3.2 Global Rolling Stock Production Value by Region (2019-2030)
3.2.1 Global Rolling Stock Production Value Market Share by Region (2019-2024)
3.2.2 Global Forecasted Production Value of Rolling Stock by Region (2025-2030)
3.3 Global Rolling Stock Production Estimates and Forecasts by Region: 2019 VS 2023 VS 2030
3.4 Global Rolling Stock Production by Region (2019-2030)
3.4.1 Global Rolling Stock Production Market Share by Region (2019-2024)
3.4.2 Global Forecasted Production of Rolling Stock by Region (2025-2030)
3.5 Global Rolling Stock Market Price Analysis by Region (2019-2024)
3.6 Global Rolling Stock Production and Value, Year-over-Year Growth
3.6.1 North America Rolling Stock Production Value Estimates and Forecasts (2019-2030)
3.6.2 Europe Rolling Stock Production Value Estimates and Forecasts (2019-2030)
3.6.3 China Rolling Stock Production Value Estimates and Forecasts (2019-2030)
3.6.4 Japan Rolling Stock Production Value Estimates and Forecasts (2019-2030)
4 Rolling Stock Consumption by Region
4.1 Global Rolling Stock Consumption Estimates and Forecasts by Region: 2019 VS 2023 VS 2030
4.2 Global Rolling Stock Consumption by Region (2019-2030)
4.2.1 Global Rolling Stock Consumption by Region (2019-2024)
4.2.2 Global Rolling Stock Forecasted Consumption by Region (2025-2030)
4.3 North America
4.3.1 North America Rolling Stock Consumption Growth Rate by Country: 2019 VS 2023 VS 2030
4.3.2 North America Rolling Stock Consumption by Country (2019-2030)
4.3.3 U.S.
4.3.4 Canada
4.4 Europe
4.4.1 Europe Rolling Stock Consumption Growth Rate by Country: 2019 VS 2023 VS 2030
4.4.2 Europe Rolling Stock Consumption by Country (2019-2030)
4.4.3 Germany
4.4.4 France
4.4.5 U.K.
4.4.6 Italy
4.4.7 Russia
4.5 Asia Pacific
4.5.1 Asia Pacific Rolling Stock Consumption Growth Rate by Region: 2019 VS 2023 VS 2030
4.5.2 Asia Pacific Rolling Stock Consumption by Region (2019-2030)
4.5.3 China
4.5.4 Japan
4.5.5 South Korea
4.5.6 China Taiwan
4.5.7 Southeast Asia
4.5.8 India
4.6 Latin America, Middle East & Africa
4.6.1 Latin America, Middle East & Africa Rolling Stock Consumption Growth Rate by Country: 2019 VS 2023 VS 2030
4.6.2 Latin America, Middle East & Africa Rolling Stock Consumption by Country (2019-2030)
4.6.3 Mexico
4.6.4 Brazil
4.6.5 Turkey
5 Segment by Type
5.1 Global Rolling Stock Production by Type (2019-2030)
5.1.1 Global Rolling Stock Production by Type (2019-2024)
5.1.2 Global Rolling Stock Production by Type (2025-2030)
5.1.3 Global Rolling Stock Production Market Share by Type (2019-2030)
5.2 Global Rolling Stock Production Value by Type (2019-2030)
5.2.1 Global Rolling Stock Production Value by Type (2019-2024)
5.2.2 Global Rolling Stock Production Value by Type (2025-2030)
5.2.3 Global Rolling Stock Production Value Market Share by Type (2019-2030)
5.3 Global Rolling Stock Price by Type (2019-2030)
6 Segment by Application
6.1 Global Rolling Stock Production by Application (2019-2030)
6.1.1 Global Rolling Stock Production by Application (2019-2024)
6.1.2 Global Rolling Stock Production by Application (2025-2030)
6.1.3 Global Rolling Stock Production Market Share by Application (2019-2030)
6.2 Global Rolling Stock Production Value by Application (2019-2030)
6.2.1 Global Rolling Stock Production Value by Application (2019-2024)
6.2.2 Global Rolling Stock Production Value by Application (2025-2030)
6.2.3 Global Rolling Stock Production Value Market Share by Application (2019-2030)
6.3 Global Rolling Stock Price by Application (2019-2030)
7 Key Companies Profiled
7.1 CRRC
7.1.1 CRRC Rolling Stock Corporation Information
7.1.2 CRRC Rolling Stock Product Portfolio
7.1.3 CRRC Rolling Stock Production, Value, Price and Gross Margin (2019-2024)
7.1.4 CRRC Main Business and Markets Served
7.1.5 CRRC Recent Developments/Updates
7.2 Bombardier
7.2.1 Bombardier Rolling Stock Corporation Information
7.2.2 Bombardier Rolling Stock Product Portfolio
7.2.3 Bombardier Rolling Stock Production, Value, Price and Gross Margin (2019-2024)
7.2.4 Bombardier Main Business and Markets Served
7.2.5 Bombardier Recent Developments/Updates
7.3 Alstom
7.3.1 Alstom Rolling Stock Corporation Information
7.3.2 Alstom Rolling Stock Product Portfolio
7.3.3 Alstom Rolling Stock Production, Value, Price and Gross Margin (2019-2024)
7.3.4 Alstom Main Business and Markets Served
7.3.5 Alstom Recent Developments/Updates
7.4 Siemens
7.4.1 Siemens Rolling Stock Corporation Information
7.4.2 Siemens Rolling Stock Product Portfolio
7.4.3 Siemens Rolling Stock Production, Value, Price and Gross Margin (2019-2024)
7.4.4 Siemens Main Business and Markets Served
7.4.5 Siemens Recent Developments/Updates
7.5 GE Transportation
7.5.1 GE Transportation Rolling Stock Corporation Information
7.5.2 GE Transportation Rolling Stock Product Portfolio
7.5.3 GE Transportation Rolling Stock Production, Value, Price and Gross Margin (2019-2024)
7.5.4 GE Transportation Main Business and Markets Served
7.5.5 GE Transportation Recent Developments/Updates
7.6 Hyundai Rotem
7.6.1 Hyundai Rotem Rolling Stock Corporation Information
7.6.2 Hyundai Rotem Rolling Stock Product Portfolio
7.6.3 Hyundai Rotem Rolling Stock Production, Value, Price and Gross Margin (2019-2024)
7.6.4 Hyundai Rotem Main Business and Markets Served
7.6.5 Hyundai Rotem Recent Developments/Updates
7.7 Transmashholding
7.7.1 Transmashholding Rolling Stock Corporation Information
7.7.2 Transmashholding Rolling Stock Product Portfolio
7.7.3 Transmashholding Rolling Stock Production, Value, Price and Gross Margin (2019-2024)
7.7.4 Transmashholding Main Business and Markets Served
7.7.5 Transmashholding Recent Developments/Updates
7.8 Stadler Rail AG
7.8.1 Stadler Rail AG Rolling Stock Corporation Information
7.8.2 Stadler Rail AG Rolling Stock Product Portfolio
7.8.3 Stadler Rail AG Rolling Stock Production, Value, Price and Gross Margin (2019-2024)
7.8.4 Stadler Rail AG Main Business and Markets Served
7.7.5 Stadler Rail AG Recent Developments/Updates
7.9 Hitachi
7.9.1 Hitachi Rolling Stock Corporation Information
7.9.2 Hitachi Rolling Stock Product Portfolio
7.9.3 Hitachi Rolling Stock Production, Value, Price and Gross Margin (2019-2024)
7.9.4 Hitachi Main Business and Markets Served
7.9.5 Hitachi Recent Developments/Updates
7.10 Kawasaki Heavy Industries
7.10.1 Kawasaki Heavy Industries Rolling Stock Corporation Information
7.10.2 Kawasaki Heavy Industries Rolling Stock Product Portfolio
7.10.3 Kawasaki Heavy Industries Rolling Stock Production, Value, Price and Gross Margin (2019-2024)
7.10.4 Kawasaki Heavy Industries Main Business and Markets Served
7.10.5 Kawasaki Heavy Industries Recent Developments/Updates
7.11 CAF
7.11.1 CAF Rolling Stock Corporation Information
7.11.2 CAF Rolling Stock Product Portfolio
7.11.3 CAF Rolling Stock Production, Value, Price and Gross Margin (2019-2024)
7.11.4 CAF Main Business and Markets Served
7.11.5 CAF Recent Developments/Updates
7.12 EMD (Caterpillar)
7.12.1 EMD (Caterpillar) Rolling Stock Corporation Information
7.12.2 EMD (Caterpillar) Rolling Stock Product Portfolio
7.12.3 EMD (Caterpillar) Rolling Stock Production, Value, Price and Gross Margin (2019-2024)
7.12.4 EMD (Caterpillar) Main Business and Markets Served
7.12.5 EMD (Caterpillar) Recent Developments/Updates
8 Industry Chain and Sales Channels Analysis
8.1 Rolling Stock Industry Chain Analysis
8.2 Rolling Stock Key Raw Materials
8.2.1 Key Raw Materials
8.2.2 Raw Materials Key Suppliers
8.3 Rolling Stock Production Mode & Process
8.4 Rolling Stock Sales and Marketing
8.4.1 Rolling Stock Sales Channels
8.4.2 Rolling Stock Distributors
8.5 Rolling Stock Customers
9 Rolling Stock Market Dynamics
9.1 Rolling Stock Industry Trends
9.2 Rolling Stock Market Drivers
9.3 Rolling Stock Market Challenges
9.4 Rolling Stock Market Restraints
10 Research Finding and Conclusion
11 Methodology and Data Source
11.1 Methodology/Research Approach
11.1.1 Research Programs/Design
11.1.2 Market Size Estimation
11.1.3 Market Breakdown and Data Triangulation
11.2 Data Source
11.2.1 Secondary Sources
11.2.2 Primary Sources
11.3 Author List
11.4 Disclaimer
Table of Figures
List of Tables
Table 1. Global Rolling Stock Market Value by Type, (US$ Million) & (2023 VS 2030)
Table 2. Global Rolling Stock Market Value by Application, (US$ Million) & (2023 VS 2030)
Table 3. Global Rolling Stock Production Capacity (Units) by Manufacturers in 2023
Table 4. Global Rolling Stock Production by Manufacturers (2019-2024) & (Units)
Table 5. Global Rolling Stock Production Market Share by Manufacturers (2019-2024)
Table 6. Global Rolling Stock Production Value by Manufacturers (2019-2024) & (US$ Million)
Table 7. Global Rolling Stock Production Value Share by Manufacturers (2019-2024)
Table 8. Global Rolling Stock Industry Ranking 2022 VS 2023 VS 2024
Table 9. Company Type (Tier 1, Tier 2 and Tier 3) & (based on the Revenue in Rolling Stock as of 2023)
Table 10. Global Market Rolling Stock Average Price by Manufacturers (K USD/Units) & (2019-2024)
Table 11. Manufacturers Rolling Stock Production Sites and Area Served
Table 12. Manufacturers Rolling Stock Product Types
Table 13. Global Rolling Stock Manufacturers Market Concentration Ratio (CR5 and HHI)
Table 14. Mergers & Acquisitions, Expansion
Table 15. Global Rolling Stock Production Value by Region: 2019 VS 2023 VS 2030 (US$ Million)
Table 16. Global Rolling Stock Production Value (US$ Million) by Region (2019-2024)
Table 17. Global Rolling Stock Production Value Market Share by Region (2019-2024)
Table 18. Global Rolling Stock Production Value (US$ Million) Forecast by Region (2025-2030)
Table 19. Global Rolling Stock Production Value Market Share Forecast by Region (2025-2030)
Table 20. Global Rolling Stock Production Comparison by Region: 2019 VS 2023 VS 2030 (Units)
Table 21. Global Rolling Stock Production (Units) by Region (2019-2024)
Table 22. Global Rolling Stock Production Market Share by Region (2019-2024)
Table 23. Global Rolling Stock Production (Units) Forecast by Region (2025-2030)
Table 24. Global Rolling Stock Production Market Share Forecast by Region (2025-2030)
Table 25. Global Rolling Stock Market Average Price (K USD/Units) by Region (2019-2024)
Table 26. Global Rolling Stock Market Average Price (K USD/Units) by Region (2025-2030)
Table 27. Global Rolling Stock Consumption Growth Rate by Region: 2019 VS 2023 VS 2030 (Units)
Table 28. Global Rolling Stock Consumption by Region (2019-2024) & (Units)
Table 29. Global Rolling Stock Consumption Market Share by Region (2019-2024)
Table 30. Global Rolling Stock Forecasted Consumption by Region (2025-2030) & (Units)
Table 31. Global Rolling Stock Forecasted Consumption Market Share by Region (2019-2024)
Table 32. North America Rolling Stock Consumption Growth Rate by Country: 2019 VS 2023 VS 2030 (Units)
Table 33. North America Rolling Stock Consumption by Country (2019-2024) & (Units)
Table 34. North America Rolling Stock Consumption by Country (2025-2030) & (Units)
Table 35. Europe Rolling Stock Consumption Growth Rate by Country: 2019 VS 2023 VS 2030 (Units)
Table 36. Europe Rolling Stock Consumption by Country (2019-2024) & (Units)
Table 37. Europe Rolling Stock Consumption by Country (2025-2030) & (Units)
Table 38. Asia Pacific Rolling Stock Consumption Growth Rate by Region: 2019 VS 2023 VS 2030 (Units)
Table 39. Asia Pacific Rolling Stock Consumption by Region (2019-2024) & (Units)
Table 40. Asia Pacific Rolling Stock Consumption by Region (2025-2030) & (Units)
Table 41. Latin America, Middle East & Africa Rolling Stock Consumption Growth Rate by Country: 2019 VS 2023 VS 2030 (Units)
Table 42. Latin America, Middle East & Africa Rolling Stock Consumption by Country (2019-2024) & (Units)
Table 43. Latin America, Middle East & Africa Rolling Stock Consumption by Country (2025-2030) & (Units)
Table 44. Global Rolling Stock Production (Units) by Type (2019-2024)
Table 45. Global Rolling Stock Production (Units) by Type (2025-2030)
Table 46. Global Rolling Stock Production Market Share by Type (2019-2024)
Table 47. Global Rolling Stock Production Market Share by Type (2025-2030)
Table 48. Global Rolling Stock Production Value (US$ Million) by Type (2019-2024)
Table 49. Global Rolling Stock Production Value (US$ Million) by Type (2025-2030)
Table 50. Global Rolling Stock Production Value Share by Type (2019-2024)
Table 51. Global Rolling Stock Production Value Share by Type (2025-2030)
Table 52. Global Rolling Stock Price (K USD/Units) by Type (2019-2024)
Table 53. Global Rolling Stock Price (K USD/Units) by Type (2025-2030)
Table 54. Global Rolling Stock Production (Units) by Application (2019-2024)
Table 55. Global Rolling Stock Production (Units) by Application (2025-2030)
Table 56. Global Rolling Stock Production Market Share by Application (2019-2024)
Table 57. Global Rolling Stock Production Market Share by Application (2025-2030)
Table 58. Global Rolling Stock Production Value (US$ Million) by Application (2019-2024)
Table 59. Global Rolling Stock Production Value (US$ Million) by Application (2025-2030)
Table 60. Global Rolling Stock Production Value Share by Application (2019-2024)
Table 61. Global Rolling Stock Production Value Share by Application (2025-2030)
Table 62. Global Rolling Stock Price (K USD/Units) by Application (2019-2024)
Table 63. Global Rolling Stock Price (K USD/Units) by Application (2025-2030)
Table 64. CRRC Rolling Stock Corporation Information
Table 65. CRRC Specification and Application
Table 66. CRRC Rolling Stock Production (Units), Value (US$ Million), Price (K USD/Units) and Gross Margin (2019-2024)
Table 67. CRRC Main Business and Markets Served
Table 68. CRRC Recent Developments/Updates
Table 69. Bombardier Rolling Stock Corporation Information
Table 70. Bombardier Specification and Application
Table 71. Bombardier Rolling Stock Production (Units), Value (US$ Million), Price (K USD/Units) and Gross Margin (2019-2024)
Table 72. Bombardier Main Business and Markets Served
Table 73. Bombardier Recent Developments/Updates
Table 74. Alstom Rolling Stock Corporation Information
Table 75. Alstom Specification and Application
Table 76. Alstom Rolling Stock Production (Units), Value (US$ Million), Price (K USD/Units) and Gross Margin (2019-2024)
Table 77. Alstom Main Business and Markets Served
Table 78. Alstom Recent Developments/Updates
Table 79. Siemens Rolling Stock Corporation Information
Table 80. Siemens Specification and Application
Table 81. Siemens Rolling Stock Production (Units), Value (US$ Million), Price (K USD/Units) and Gross Margin (2019-2024)
Table 82. Siemens Main Business and Markets Served
Table 83. Siemens Recent Developments/Updates
Table 84. GE Transportation Rolling Stock Corporation Information
Table 85. GE Transportation Specification and Application
Table 86. GE Transportation Rolling Stock Production (Units), Value (US$ Million), Price (K USD/Units) and Gross Margin (2019-2024)
Table 87. GE Transportation Main Business and Markets Served
Table 88. GE Transportation Recent Developments/Updates
Table 89. Hyundai Rotem Rolling Stock Corporation Information
Table 90. Hyundai Rotem Specification and Application
Table 91. Hyundai Rotem Rolling Stock Production (Units), Value (US$ Million), Price (K USD/Units) and Gross Margin (2019-2024)
Table 92. Hyundai Rotem Main Business and Markets Served
Table 93. Hyundai Rotem Recent Developments/Updates
Table 94. Transmashholding Rolling Stock Corporation Information
Table 95. Transmashholding Specification and Application
Table 96. Transmashholding Rolling Stock Production (Units), Value (US$ Million), Price (K USD/Units) and Gross Margin (2019-2024)
Table 97. Transmashholding Main Business and Markets Served
Table 98. Transmashholding Recent Developments/Updates
Table 99. Stadler Rail AG Rolling Stock Corporation Information
Table 100. Stadler Rail AG Specification and Application
Table 101. Stadler Rail AG Rolling Stock Production (Units), Value (US$ Million), Price (K USD/Units) and Gross Margin (2019-2024)
Table 102. Stadler Rail AG Main Business and Markets Served
Table 103. Stadler Rail AG Recent Developments/Updates
Table 104. Hitachi Rolling Stock Corporation Information
Table 105. Hitachi Specification and Application
Table 106. Hitachi Rolling Stock Production (Units), Value (US$ Million), Price (K USD/Units) and Gross Margin (2019-2024)
Table 107. Hitachi Main Business and Markets Served
Table 108. Hitachi Recent Developments/Updates
Table 109. Kawasaki Heavy Industries Rolling Stock Corporation Information
Table 110. Kawasaki Heavy Industries Specification and Application
Table 111. Kawasaki Heavy Industries Rolling Stock Production (Units), Value (US$ Million), Price (K USD/Units) and Gross Margin (2019-2024)
Table 112. Kawasaki Heavy Industries Main Business and Markets Served
Table 113. Kawasaki Heavy Industries Recent Developments/Updates
Table 114. CAF Rolling Stock Corporation Information
Table 115. CAF Specification and Application
Table 116. CAF Rolling Stock Production (Units), Value (US$ Million), Price (K USD/Units) and Gross Margin (2019-2024)
Table 117. CAF Main Business and Markets Served
Table 118. CAF Recent Developments/Updates
Table 119. EMD (Caterpillar) Rolling Stock Corporation Information
Table 120. EMD (Caterpillar) Specification and Application
Table 121. EMD (Caterpillar) Rolling Stock Production (Units), Value (US$ Million), Price (K USD/Units) and Gross Margin (2019-2024)
Table 122. EMD (Caterpillar) Main Business and Markets Served
Table 123. EMD (Caterpillar) Recent Developments/Updates
Table 124. Key Raw Materials Lists
Table 125. Raw Materials Key Suppliers Lists
Table 126. Rolling Stock Distributors List
Table 127. Rolling Stock Customers List
Table 128. Rolling Stock Market Trends
Table 129. Rolling Stock Market Drivers
Table 130. Rolling Stock Market Challenges
Table 131. Rolling Stock Market Restraints
Table 132. Research Programs/Design for This Report
Table 133. Key Data Information from Secondary Sources
Table 134. Key Data Information from Primary Sources
List of Figures
Figure 1. Product Picture of Rolling Stock
Figure 2. Global Rolling Stock Market Value by Type, (US$ Million) & (2023 VS 2030)
Figure 3. Global Rolling Stock Market Share by Type: 2023 VS 2030
Figure 4. Electric Locomotives Product Picture
Figure 5. Diesel Locomotives Product Picture
Figure 6. Global Rolling Stock Market Value by Application, (US$ Million) & (2023 VS 2030)
Figure 7. Global Rolling Stock Market Share by Application: 2023 VS 2030
Figure 8. Commercial Use
Figure 9. Industrial Use
Figure 10. Global Rolling Stock Production Value (US$ Million), 2019 VS 2023 VS 2030
Figure 11. Global Rolling Stock Production Value (US$ Million) & (2019-2030)
Figure 12. Global Rolling Stock Production (Units) & (2019-2030)
Figure 13. Global Rolling Stock Average Price (K USD/Units) & (2019-2030)
Figure 14. Rolling Stock Report Years Considered
Figure 15. Rolling Stock Production Share by Manufacturers in 2023
Figure 16. Rolling Stock Market Share by Company Type (Tier 1, Tier 2, and Tier 3): 2019 VS 2023
Figure 17. The Global 5 and 10 Largest Players: Market Share by Rolling Stock Revenue in 2023
Figure 18. Global Rolling Stock Production Value by Region: 2019 VS 2023 VS 2030 (US$ Million)
Figure 19. Global Rolling Stock Production Value Market Share by Region: 2019 VS 2023 VS 2030
Figure 20. Global Rolling Stock Production Comparison by Region: 2019 VS 2023 VS 2030 (Units)
Figure 21. Global Rolling Stock Production Market Share by Region: 2019 VS 2023 VS 2030
Figure 22. North America Rolling Stock Production Value (US$ Million) Growth Rate (2019-2030)
Figure 23. Europe Rolling Stock Production Value (US$ Million) Growth Rate (2019-2030)
Figure 24. China Rolling Stock Production Value (US$ Million) Growth Rate (2019-2030)
Figure 25. Japan Rolling Stock Production Value (US$ Million) Growth Rate (2019-2030)
Figure 26. Global Rolling Stock Consumption by Region: 2019 VS 2023 VS 2030 (Units)
Figure 27. Global Rolling Stock Consumption Market Share by Region: 2019 VS 2023 VS 2030
Figure 28. North America Rolling Stock Consumption and Growth Rate (2019-2024) & (Units)
Figure 29. North America Rolling Stock Consumption Market Share by Country (2019-2030)
Figure 30. Canada Rolling Stock Consumption and Growth Rate (2019-2024) & (Units)
Figure 31. U.S. Rolling Stock Consumption and Growth Rate (2019-2024) & (Units)
Figure 32. Europe Rolling Stock Consumption and Growth Rate (2019-2024) & (Units)
Figure 33. Europe Rolling Stock Consumption Market Share by Country (2019-2030)
Figure 34. Germany Rolling Stock Consumption and Growth Rate (2019-2024) & (Units)
Figure 35. France Rolling Stock Consumption and Growth Rate (2019-2024) & (Units)
Figure 36. U.K. Rolling Stock Consumption and Growth Rate (2019-2024) & (Units)
Figure 37. Italy Rolling Stock Consumption and Growth Rate (2019-2024) & (Units)
Figure 38. Russia Rolling Stock Consumption and Growth Rate (2019-2024) & (Units)
Figure 39. Asia Pacific Rolling Stock Consumption and Growth Rate (2019-2024) & (Units)
Figure 40. Asia Pacific Rolling Stock Consumption Market Share by Regions (2019-2030)
Figure 41. China Rolling Stock Consumption and Growth Rate (2019-2024) & (Units)
Figure 42. Japan Rolling Stock Consumption and Growth Rate (2019-2024) & (Units)
Figure 43. South Korea Rolling Stock Consumption and Growth Rate (2019-2024) & (Units)
Figure 44. China Taiwan Rolling Stock Consumption and Growth Rate (2019-2024) & (Units)
Figure 45. Southeast Asia Rolling Stock Consumption and Growth Rate (2019-2024) & (Units)
Figure 46. India Rolling Stock Consumption and Growth Rate (2019-2024) & (Units)
Figure 47. Latin America, Middle East & Africa Rolling Stock Consumption and Growth Rate (2019-2024) & (Units)
Figure 48. Latin America, Middle East & Africa Rolling Stock Consumption Market Share by Country (2019-2030)
Figure 49. Mexico Rolling Stock Consumption and Growth Rate (2019-2024) & (Units)
Figure 50. Brazil Rolling Stock Consumption and Growth Rate (2019-2024) & (Units)
Figure 51. Turkey Rolling Stock Consumption and Growth Rate (2019-2024) & (Units)
Figure 52. GCC Countries Rolling Stock Consumption and Growth Rate (2019-2024) & (Units)
Figure 53. Global Production Market Share of Rolling Stock by Type (2019-2030)
Figure 54. Global Production Value Market Share of Rolling Stock by Type (2019-2030)
Figure 55. Global Rolling Stock Price (K USD/Units) by Type (2019-2030)
Figure 56. Global Production Market Share of Rolling Stock by Application (2019-2030)
Figure 57. Global Production Value Market Share of Rolling Stock by Application (2019-2030)
Figure 58. Global Rolling Stock Price (K USD/Units) by Application (2019-2030)
Figure 59. Rolling Stock Value Chain
Figure 60. Rolling Stock Production Process
Figure 61. Channels of Distribution (Direct Vs Distribution)
Figure 62. Distributors Profiles
Figure 63. Bottom-up and Top-down Approaches for This Report
Figure 64. Data Triangulation


