0
U.S. (TOLL FREE)
+1 (315) 215-3225
Automative

0
U.S. (TOLL FREE)
+1 (315) 215-3225
In-Car Infotainment Market Insights, Forecast to 2028
Published Date: February 2022
|
Report Code: QYRE-Auto-34X5950
Home | Market Reports | Autos & Vehicles| Motor Vehicles (By Type)
Global In Car Infotainment Market Insights Forecast to 2028
BUY CHAPTERS

In-Car Infotainment Market Insights, Forecast to 2028

Code: QYRE-Auto-34X5950
Report
February 2022
Pages:127
QYResearch
Buy Now with 15% Discount
DESCRIPTION
TABLE OF CONTENT
TABLES & FIGURES

In-Car Infotainment Market Outlook - 2028 

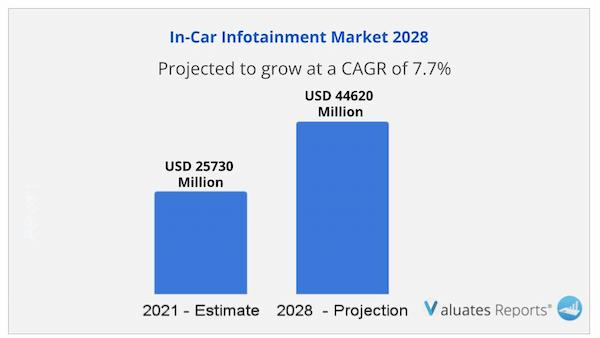
The global In-Car Infotainment market size is projected to reach US$ 44620 million by 2028, from US$ 25730 million in 2021, at a CAGR of 7.7% during 2022-2028. 

InCar Infotainment Market

Fully considering the economic change by this health crisis, QNX System accounting for % of the In-Car Infotainment global market in 2021, is projected to value US$ million by 2028, growing at a revised % CAGR in the post-COVID-19 period.

While OEM segment is altered to an % CAGR throughout this forecast period.

In-Car Infotainment Market Insights

China In-Car Infotainment market size is valued at US$ million in 2021, while the North America and Europe In-Car Infotainment are US$ million and US$ million, severally. The proportion of the North America is % in 2021, while China and Europe are % and % respectively, and it is predicted that China proportion will reach % in 2028, trailing a CAGR of % through the analysis period. Japan, South Korea, and Southeast Asia are noteworthy markets in Asia, with CAGR %, %, and % respectively for the next 6-year period.

As for the Europe In-Car Infotainment landscape, Germany is projected to reach US$ million by 2028 trailing a CAGR of % over the forecast period.

With industry-standard accuracy in analysis and high data integrity, the report makes a brilliant attempt to unveil key opportunities available in the global In-Car Infotainment market to help players in achieving a strong market position. Buyers of the report can access verified and reliable market forecasts, including those for the overall size of the global In-Car Infotainment market in terms of revenue.

Overall, the report proves to be an effective tool that players can use to gain a competitive edge over their competitors and ensure lasting success in the global In-Car Infotainment market. All of the findings, data, and information provided in the report are validated and revalidated with the help of trustworthy sources. The analysts who have authored the report took a unique and industry-best research and analysis approach for an in-depth study of the global In-Car Infotainment market.

In-Car Infotainment Market Scope and Market Size

In-Car Infotainment market is segmented by players, region (country), by Type and by Application. Players, stakeholders, and other participants in the global In-Car Infotainment market will be able to gain the upper hand as they use the report as a powerful resource. The segmental analysis focuses on revenue and forecast by Type and by Application for the period 2017-2028.

In-Car Infotainment Market Segment by Type

  • QNX System
  • WinCE System
  • Linux System
  • Other System

In-Car Infotainment Market Segment by Application

  • OEM
  • Aftermarket

Key Companies

  • Panasonic
  • Fujitsu-Ten
  • Pioneer
  • Denso
  • Aisin
  • Clarion
  • Desay SV
  • Kenwood
  • Harman
  • ADAYO
  • Alpine
  • Visteon
  • Continental
  • Bosch
  • Hangsheng
  • Coagent
  • Mitsubishi Electronics (Melco)
  • Delphi
  • Kaiyue Group
  • Soling
  • Sony

Key Regions & Countries

  • North America
  • United States
  • Canada
  • Europe
  • Germany
  • France
  • UK
  • Italy
  • Russia
  • Nordic Countries
  • Rest of Europe
  • Asia-Pacific
  • China
  • Japan
  • South Korea
  • Southeast Asia
  • India
  • Australia
  • Rest of Asia
  • Latin America
  • Mexico
  • Brazil
  • Rest of Latin America
  • Middle East & Africa
  • Turkey
  • Saudi Arabia
  • UAE
  • Rest of MEA

In-Car Infotainment Market Report Coverage

Report Metric

Details

Base Year:

2021

Market Size in 2021:

USD 25730 Million

Forecast Period:

2022 to 2028

Forecast Period 2023 to 2028 CAGR:

7.7%

2028 Value Projection:

USD 44620 Million

No. of Pages:

127

Tables & Figures

154

Segments covered:

Type, Application, Region

Frequently Asked Questions About This Report

1. What would be the forecast period in the In-Car Infotainment Market report?

Ans. The forecast period in the In-Car Infotainment Market report is from 2022 to 2028.

2. How can I get chapter-wise report/company profiles of the Global In-Car Infotainment industry?

Ans. The Chapter-wise In-Car Infotainment market report can be obtained on from the Valuates Reports website. Also, 24*7 chat support and direct call services are provided to procure the chapter-wise report.

3. What are the Segments by type in the In-Car Infotainment Market report?

Ans. QNX System, WinCE System, Linux System, Other System are the segments by type in In-Car Infotainment Market.

4. How big is the In-Car Infotainment Market?

Ans. In-Car Infotainment market size is projected to reach US$ 44620 million by 2028, from US$ 25730 million in 2021, at a CAGR of 7.7% during 2022-2028.

Table of Contents

1 Study Coverage

    1.1 Acrylonitrile Product Introduction

    1.2 Market by Type

        1.2.1 Global Acrylonitrile Market Size by Type, 2017 VS 2021 VS 2028

        1.2.2 Propylene Method

        1.2.3 Propane Method

    1.3 Market by Application

        1.3.1 Global Acrylonitrile Market Size by Application, 2017 VS 2021 VS 2028

        1.3.2 Acrylic Fibres

        1.3.3 ABS and SAN resins

        1.3.4 Acrylamide

        1.3.5 NBR

        1.3.6 Others

    1.4 Study Objectives

    1.5 Years Considered

2 Global Acrylonitrile Production

    2.1 Global Acrylonitrile Production Capacity (2017-2028)

    2.2 Global Acrylonitrile Production by Region: 2017 VS 2021 VS 2028

    2.3 Global Acrylonitrile Production by Region

        2.3.1 Global Acrylonitrile Historic Production by Region (2017-2022)

        2.3.2 Global Acrylonitrile Forecasted Production by Region (2023-2028)

    2.4 North America

    2.5 Europe

    2.6 China

    2.7 Japan

    2.8 South Korea

    2.9 India

3 Global Acrylonitrile Sales in Volume & Value Estimates and Forecasts

    3.1 Global Acrylonitrile Sales Estimates and Forecasts 2017-2028

    3.2 Global Acrylonitrile Revenue Estimates and Forecasts 2017-2028

    3.3 Global Acrylonitrile Revenue by Region: 2017 VS 2021 VS 2028

    3.4 Global Acrylonitrile Sales by Region

        3.4.1 Global Acrylonitrile Sales by Region (2017-2022)

        3.4.2 Global Sales Acrylonitrile by Region (2023-2028)

    3.5 Global Acrylonitrile Revenue by Region

        3.5.1 Global Acrylonitrile Revenue by Region (2017-2022)

        3.5.2 Global Acrylonitrile Revenue by Region (2023-2028)

    3.6 North America

    3.7 Europe

    3.8 Asia-Pacific

    3.9 Latin America

    3.10 Middle East & Africa

4 Competition by Manufactures

    4.1 Global Acrylonitrile Production Capacity by Manufacturers

    4.2 Global Acrylonitrile Sales by Manufacturers

        4.2.1 Global Acrylonitrile Sales by Manufacturers (2017-2022)

        4.2.2 Global Acrylonitrile Sales Market Share by Manufacturers (2017-2022)

        4.2.3 Global Top 10 and Top 5 Largest Manufacturers of Acrylonitrile in 2021

    4.3 Global Acrylonitrile Revenue by Manufacturers

        4.3.1 Global Acrylonitrile Revenue by Manufacturers (2017-2022)

        4.3.2 Global Acrylonitrile Revenue Market Share by Manufacturers (2017-2022)

        4.3.3 Global Top 10 and Top 5 Companies by Acrylonitrile Revenue in 2021

    4.4 Global Acrylonitrile Sales Price by Manufacturers

    4.5 Analysis of Competitive Landscape

        4.5.1 Manufacturers Market Concentration Ratio (CR5 and HHI)

        4.5.2 Global Acrylonitrile Market Share by Company Type (Tier 1, Tier 2, and Tier 3)

        4.5.3 Global Acrylonitrile Manufacturers Geographical Distribution

    4.6 Mergers & Acquisitions, Expansion Plans

5 Market Size by Type

    5.1 Global Acrylonitrile Sales by Type

        5.1.1 Global Acrylonitrile Historical Sales by Type (2017-2022)

        5.1.2 Global Acrylonitrile Forecasted Sales by Type (2023-2028)

        5.1.3 Global Acrylonitrile Sales Market Share by Type (2017-2028)

    5.2 Global Acrylonitrile Revenue by Type

        5.2.1 Global Acrylonitrile Historical Revenue by Type (2017-2022)

        5.2.2 Global Acrylonitrile Forecasted Revenue by Type (2023-2028)

        5.2.3 Global Acrylonitrile Revenue Market Share by Type (2017-2028)

    5.3 Global Acrylonitrile Price by Type

        5.3.1 Global Acrylonitrile Price by Type (2017-2022)

        5.3.2 Global Acrylonitrile Price Forecast by Type (2023-2028)

6 Market Size by Application

    6.1 Global Acrylonitrile Sales by Application

        6.1.1 Global Acrylonitrile Historical Sales by Application (2017-2022)

        6.1.2 Global Acrylonitrile Forecasted Sales by Application (2023-2028)

        6.1.3 Global Acrylonitrile Sales Market Share by Application (2017-2028)

    6.2 Global Acrylonitrile Revenue by Application

        6.2.1 Global Acrylonitrile Historical Revenue by Application (2017-2022)

        6.2.2 Global Acrylonitrile Forecasted Revenue by Application (2023-2028)

        6.2.3 Global Acrylonitrile Revenue Market Share by Application (2017-2028)

    6.3 Global Acrylonitrile Price by Application

        6.3.1 Global Acrylonitrile Price by Application (2017-2022)

        6.3.2 Global Acrylonitrile Price Forecast by Application (2023-2028)

7 North America

    7.1 North America Acrylonitrile Market Size by Type

        7.1.1 North America Acrylonitrile Sales by Type (2017-2028)

        7.1.2 North America Acrylonitrile Revenue by Type (2017-2028)

    7.2 North America Acrylonitrile Market Size by Application

        7.2.1 North America Acrylonitrile Sales by Application (2017-2028)

        7.2.2 North America Acrylonitrile Revenue by Application (2017-2028)

    7.3 North America Acrylonitrile Sales by Country

        7.3.1 North America Acrylonitrile Sales by Country (2017-2028)

        7.3.2 North America Acrylonitrile Revenue by Country (2017-2028)

        7.3.3 U.S.

        7.3.4 Canada

8 Europe

    8.1 Europe Acrylonitrile Market Size by Type

        8.1.1 Europe Acrylonitrile Sales by Type (2017-2028)

        8.1.2 Europe Acrylonitrile Revenue by Type (2017-2028)

    8.2 Europe Acrylonitrile Market Size by Application

        8.2.1 Europe Acrylonitrile Sales by Application (2017-2028)

        8.2.2 Europe Acrylonitrile Revenue by Application (2017-2028)

    8.3 Europe Acrylonitrile Sales by Country

        8.3.1 Europe Acrylonitrile Sales by Country (2017-2028)

        8.3.2 Europe Acrylonitrile Revenue by Country (2017-2028)

        8.3.3 Germany

        8.3.4 France

        8.3.5 U.K.

        8.3.6 Italy

        8.3.7 Russia

9 Asia Pacific

    9.1 Asia Pacific Acrylonitrile Market Size by Type

        9.1.1 Asia Pacific Acrylonitrile Sales by Type (2017-2028)

        9.1.2 Asia Pacific Acrylonitrile Revenue by Type (2017-2028)

    9.2 Asia Pacific Acrylonitrile Market Size by Application

        9.2.1 Asia Pacific Acrylonitrile Sales by Application (2017-2028)

        9.2.2 Asia Pacific Acrylonitrile Revenue by Application (2017-2028)

    9.3 Asia Pacific Acrylonitrile Sales by Region

        9.3.1 Asia Pacific Acrylonitrile Sales by Region (2017-2028)

        9.3.2 Asia Pacific Acrylonitrile Revenue by Region (2017-2028)

        9.3.3 China

        9.3.4 Japan

        9.3.5 South Korea

        9.3.6 India

        9.3.7 Australia

        9.3.8 China Taiwan

        9.3.9 Indonesia

        9.3.10 Thailand

        9.3.11 Malaysia

10 Latin America

    10.1 Latin America Acrylonitrile Market Size by Type

        10.1.1 Latin America Acrylonitrile Sales by Type (2017-2028)

        10.1.2 Latin America Acrylonitrile Revenue by Type (2017-2028)

    10.2 Latin America Acrylonitrile Market Size by Application

        10.2.1 Latin America Acrylonitrile Sales by Application (2017-2028)

        10.2.2 Latin America Acrylonitrile Revenue by Application (2017-2028)

    10.3 Latin America Acrylonitrile Sales by Country

        10.3.1 Latin America Acrylonitrile Sales by Country (2017-2028)

        10.3.2 Latin America Acrylonitrile Revenue by Country (2017-2028)

        10.3.3 Mexico

        10.3.4 Brazil

        10.3.5 Argentina

11 Middle East and Africa

    11.1 Middle East and Africa Acrylonitrile Market Size by Type

        11.1.1 Middle East and Africa Acrylonitrile Sales by Type (2017-2028)

        11.1.2 Middle East and Africa Acrylonitrile Revenue by Type (2017-2028)

    11.2 Middle East and Africa Acrylonitrile Market Size by Application

        11.2.1 Middle East and Africa Acrylonitrile Sales by Application (2017-2028)

        11.2.2 Middle East and Africa Acrylonitrile Revenue by Application (2017-2028)

    11.3 Middle East and Africa Acrylonitrile Sales by Country

        11.3.1 Middle East and Africa Acrylonitrile Sales by Country (2017-2028)

        11.3.2 Middle East and Africa Acrylonitrile Revenue by Country (2017-2028)

        11.3.3 Turkey

        11.3.4 Saudi Arabia

        11.3.5 UAE

12 Corporate Profiles

    12.1 Ineos

        12.1.1 Ineos Corporation Information

        12.1.2 Ineos Overview

        12.1.3 Ineos Acrylonitrile Sales, Price, Revenue and Gross Margin (2017-2022)

        12.1.4 Ineos Acrylonitrile Product Model Numbers, Pictures, Descriptions and Specifications

        12.1.5 Ineos Recent Developments

    12.2 Ascend performance Materials

        12.2.1 Ascend performance Materials Corporation Information

        12.2.2 Ascend performance Materials Overview

        12.2.3 Ascend performance Materials Acrylonitrile Sales, Price, Revenue and Gross Margin (2017-2022)

        12.2.4 Ascend performance Materials Acrylonitrile Product Model Numbers, Pictures, Descriptions and Specifications

        12.2.5 Ascend performance Materials Recent Developments

    12.3 Cornerstone

        12.3.1 Cornerstone Corporation Information

        12.3.2 Cornerstone Overview

        12.3.3 Cornerstone Acrylonitrile Sales, Price, Revenue and Gross Margin (2017-2022)

        12.3.4 Cornerstone Acrylonitrile Product Model Numbers, Pictures, Descriptions and Specifications

        12.3.5 Cornerstone Recent Developments

    12.4 Unigel

        12.4.1 Unigel Corporation Information

        12.4.2 Unigel Overview

        12.4.3 Unigel Acrylonitrile Sales, Price, Revenue and Gross Margin (2017-2022)

        12.4.4 Unigel Acrylonitrile Product Model Numbers, Pictures, Descriptions and Specifications

        12.4.5 Unigel Recent Developments

    12.5 AnQore

        12.5.1 AnQore Corporation Information

        12.5.2 AnQore Overview

        12.5.3 AnQore Acrylonitrile Sales, Price, Revenue and Gross Margin (2017-2022)

        12.5.4 AnQore Acrylonitrile Product Model Numbers, Pictures, Descriptions and Specifications

        12.5.5 AnQore Recent Developments

    12.6 Saratovorgsintez Saratov

        12.6.1 Saratovorgsintez Saratov Corporation Information

        12.6.2 Saratovorgsintez Saratov Overview

        12.6.3 Saratovorgsintez Saratov Acrylonitrile Sales, Price, Revenue and Gross Margin (2017-2022)

        12.6.4 Saratovorgsintez Saratov Acrylonitrile Product Model Numbers, Pictures, Descriptions and Specifications

        12.6.5 Saratovorgsintez Saratov Recent Developments

    12.7 Repsol Chemicals

        12.7.1 Repsol Chemicals Corporation Information

        12.7.2 Repsol Chemicals Overview

        12.7.3 Repsol Chemicals Acrylonitrile Sales, Price, Revenue and Gross Margin (2017-2022)

        12.7.4 Repsol Chemicals Acrylonitrile Product Model Numbers, Pictures, Descriptions and Specifications

        12.7.5 Repsol Chemicals Recent Developments

    12.8 Petkim

        12.8.1 Petkim Corporation Information

        12.8.2 Petkim Overview

        12.8.3 Petkim Acrylonitrile Sales, Price, Revenue and Gross Margin (2017-2022)

        12.8.4 Petkim Acrylonitrile Product Model Numbers, Pictures, Descriptions and Specifications

        12.8.5 Petkim Recent Developments

    12.9 Taekwang Industrial

        12.9.1 Taekwang Industrial Corporation Information

        12.9.2 Taekwang Industrial Overview

        12.9.3 Taekwang Industrial Acrylonitrile Sales, Price, Revenue and Gross Margin (2017-2022)

        12.9.4 Taekwang Industrial Acrylonitrile Product Model Numbers, Pictures, Descriptions and Specifications

        12.9.5 Taekwang Industrial Recent Developments

    12.10 Formosa Plastics

        12.10.1 Formosa Plastics Corporation Information

        12.10.2 Formosa Plastics Overview

        12.10.3 Formosa Plastics Acrylonitrile Sales, Price, Revenue and Gross Margin (2017-2022)

        12.10.4 Formosa Plastics Acrylonitrile Product Model Numbers, Pictures, Descriptions and Specifications

        12.10.5 Formosa Plastics Recent Developments

    12.11 Shanghai Secco Petrochemical

        12.11.1 Shanghai Secco Petrochemical Corporation Information

        12.11.2 Shanghai Secco Petrochemical Overview

        12.11.3 Shanghai Secco Petrochemical Acrylonitrile Sales, Price, Revenue and Gross Margin (2017-2022)

        12.11.4 Shanghai Secco Petrochemical Acrylonitrile Product Model Numbers, Pictures, Descriptions and Specifications

        12.11.5 Shanghai Secco Petrochemical Recent Developments

    12.12 CPDC

        12.12.1 CPDC Corporation Information

        12.12.2 CPDC Overview

        12.12.3 CPDC Acrylonitrile Sales, Price, Revenue and Gross Margin (2017-2022)

        12.12.4 CPDC Acrylonitrile Product Model Numbers, Pictures, Descriptions and Specifications

        12.12.5 CPDC Recent Developments

    12.13 Anqing Petrochemical

        12.13.1 Anqing Petrochemical Corporation Information

        12.13.2 Anqing Petrochemical Overview

        12.13.3 Anqing Petrochemical Acrylonitrile Sales, Price, Revenue and Gross Margin (2017-2022)

        12.13.4 Anqing Petrochemical Acrylonitrile Product Model Numbers, Pictures, Descriptions and Specifications

        12.13.5 Anqing Petrochemical Recent Developments

    12.14 Asahi Kasei

        12.14.1 Asahi Kasei Corporation Information

        12.14.2 Asahi Kasei Overview

        12.14.3 Asahi Kasei Acrylonitrile Sales, Price, Revenue and Gross Margin (2017-2022)

        12.14.4 Asahi Kasei Acrylonitrile Product Model Numbers, Pictures, Descriptions and Specifications

        12.14.5 Asahi Kasei Recent Developments

    12.15 Jilin Petrochemical Company

        12.15.1 Jilin Petrochemical Company Corporation Information

        12.15.2 Jilin Petrochemical Company Overview

        12.15.3 Jilin Petrochemical Company Acrylonitrile Sales, Price, Revenue and Gross Margin (2017-2022)

        12.15.4 Jilin Petrochemical Company Acrylonitrile Product Model Numbers, Pictures, Descriptions and Specifications

        12.15.5 Jilin Petrochemical Company Recent Developments

    12.16 Wanda Petrochemical

        12.16.1 Wanda Petrochemical Corporation Information

        12.16.2 Wanda Petrochemical Overview

        12.16.3 Wanda Petrochemical Acrylonitrile Sales, Price, Revenue and Gross Margin (2017-2022)

        12.16.4 Wanda Petrochemical Acrylonitrile Product Model Numbers, Pictures, Descriptions and Specifications

        12.16.5 Wanda Petrochemical Recent Developments

    12.17 Shandong Qilu Petrochemical Qitai Petrochemical

        12.17.1 Shandong Qilu Petrochemical Qitai Petrochemical Corporation Information

        12.17.2 Shandong Qilu Petrochemical Qitai Petrochemical Overview

        12.17.3 Shandong Qilu Petrochemical Qitai Petrochemical Acrylonitrile Sales, Price, Revenue and Gross Margin (2017-2022)

        12.17.4 Shandong Qilu Petrochemical Qitai Petrochemical Acrylonitrile Product Model Numbers, Pictures, Descriptions and Specifications

        12.17.5 Shandong Qilu Petrochemical Qitai Petrochemical Recent Developments

    12.18 Reliance Industries

        12.18.1 Reliance Industries Corporation Information

        12.18.2 Reliance Industries Overview

        12.18.3 Reliance Industries Acrylonitrile Sales, Price, Revenue and Gross Margin (2017-2022)

        12.18.4 Reliance Industries Acrylonitrile Product Model Numbers, Pictures, Descriptions and Specifications

        12.18.5 Reliance Industries Recent Developments

13 Industry Chain and Sales Channels Analysis

    13.1 Acrylonitrile Industry Chain Analysis

    13.2 Acrylonitrile Key Raw Materials

        13.2.1 Key Raw Materials

        13.2.2 Raw Materials Key Suppliers

    13.3 Acrylonitrile Production Mode & Process

    13.4 Acrylonitrile Sales and Marketing

        13.4.1 Acrylonitrile Sales Channels

        13.4.2 Acrylonitrile Distributors

    13.5 Acrylonitrile Customers

14 Market Drivers, Opportunities, Challenges and Risks Factors Analysis

    14.1 Acrylonitrile Industry Trends

    14.2 Acrylonitrile Market Drivers

    14.3 Acrylonitrile Market Challenges

    14.4 Acrylonitrile Market Restraints

15 Key Finding in The Global Acrylonitrile Study

16 Appendix

    16.1 Research Methodology

        16.1.1 Methodology/Research Approach

        16.1.2 Data Source

    16.2 Author Details

    16.3 Disclaimer

List of Tables
    Table 1. Global In-Car Infotainment Market Size Growth Rate by Type (US$ Million), 2017 VS 2021 VS 2028
    Table 2. Key Players of QNX System
    Table 3. Key Players of WinCE System
    Table 4. Key Players of Linux System
    Table 5. Key Players of Other System
    Table 6. Global In-Car Infotainment Market Size Growth Rate by Application (US$ Million), 2017 VS 2021 VS 2028
    Table 7. Global In-Car Infotainment Market Size by Region (US$ Million): 2017 VS 2021 VS 2028
    Table 8. Global In-Car Infotainment Market Size by Region (2017-2022) & (US$ Million)
    Table 9. Global In-Car Infotainment Market Share by Region (2017-2022)
    Table 10. Global In-Car Infotainment Forecasted Market Size by Region (2023-2028) & (US$ Million)
    Table 11. Global In-Car Infotainment Market Share by Region (2023-2028)
    Table 12. In-Car Infotainment Market Trends
    Table 13. In-Car Infotainment Market Drivers
    Table 14. In-Car Infotainment Market Challenges
    Table 15. In-Car Infotainment Market Restraints
    Table 16. Global In-Car Infotainment Revenue by Players (2017-2022) & (US$ Million)
    Table 17. Global In-Car Infotainment Revenue Share by Players (2017-2022)
    Table 18. Global Top In-Car Infotainment by Company Type (Tier 1, Tier 2, and Tier 3) & (based on the Revenue in In-Car Infotainment as of 2021)
    Table 19. Ranking of Global Top In-Car Infotainment Companies by Revenue (US$ Million) in 2021
    Table 20. Global 5 Largest Players Market Share by In-Car Infotainment Revenue (CR5 and HHI) & (2017-2022)
    Table 21. Key Players Headquarters and Area Served
    Table 22. Key Players In-Car Infotainment Product Solution and Service
    Table 23. Date of Enter into In-Car Infotainment Market
    Table 24. Mergers & Acquisitions, Expansion Plans
    Table 25. Global In-Car Infotainment Market Size by Type (2017-2022) & (US$ Million)
    Table 26. Global In-Car Infotainment Revenue Market Share by Type (2017-2022)
    Table 27. Global In-Car Infotainment Forecasted Market Size by Type (2023-2028) & (US$ Million)
    Table 28. Global In-Car Infotainment Revenue Market Share by Type (2023-2028)
    Table 29. Global In-Car Infotainment Market Size by Application (2017-2022) & (US$ Million)
    Table 30. Global In-Car Infotainment Revenue Share by Application (2017-2022)
    Table 31. Global In-Car Infotainment Forecasted Market Size by Application (2023-2028) & (US$ Million)
    Table 32. Global In-Car Infotainment Revenue Share by Application (2023-2028)
    Table 33. North America In-Car Infotainment Market Size by Type (2017-2022) & (US$ Million)
    Table 34. North America In-Car Infotainment Market Size by Type (2023-2028) & (US$ Million)
    Table 35. North America In-Car Infotainment Market Size by Application (2017-2022) & (US$ Million)
    Table 36. North America In-Car Infotainment Market Size by Application (2023-2028) & (US$ Million)
    Table 37. North America In-Car Infotainment Market Size by Country (2017-2022) & (US$ Million)
    Table 38. North America In-Car Infotainment Market Size by Country (2023-2028) & (US$ Million)
    Table 39. Europe In-Car Infotainment Market Size by Type (2017-2022) & (US$ Million)
    Table 40. Europe In-Car Infotainment Market Size by Type (2023-2028) & (US$ Million)
    Table 41. Europe In-Car Infotainment Market Size by Application (2017-2022) & (US$ Million)
    Table 42. Europe In-Car Infotainment Market Size by Application (2023-2028) & (US$ Million)
    Table 43. Europe In-Car Infotainment Market Size by Country (2017-2022) & (US$ Million)
    Table 44. Europe In-Car Infotainment Market Size by Country (2023-2028) & (US$ Million)
    Table 45. Asia Pacific In-Car Infotainment Market Size by Type (2017-2022) & (US$ Million)
    Table 46. Asia Pacific In-Car Infotainment Market Size by Type (2023-2028) & (US$ Million)
    Table 47. Asia Pacific In-Car Infotainment Market Size by Application (2017-2022) & (US$ Million)
    Table 48. Asia Pacific In-Car Infotainment Market Size by Application (2023-2028) & (US$ Million)
    Table 49. Asia Pacific In-Car Infotainment Market Size by Region (2017-2022) & (US$ Million)
    Table 50. Asia Pacific In-Car Infotainment Market Size by Region (2023-2028) & (US$ Million)
    Table 51. Latin America In-Car Infotainment Market Size by Type (2017-2022) & (US$ Million)
    Table 52. Latin America In-Car Infotainment Market Size by Type (2023-2028) & (US$ Million)
    Table 53. Latin America In-Car Infotainment Market Size by Application (2017-2022) & (US$ Million)
    Table 54. Latin America In-Car Infotainment Market Size by Application (2023-2028) & (US$ Million)
    Table 55. Latin America In-Car Infotainment Market Size by Country (2017-2022) & (US$ Million)
    Table 56. Latin America In-Car Infotainment Market Size by Country (2023-2028) & (US$ Million)
    Table 57. Middle East and Africa In-Car Infotainment Market Size by Type (2017-2022) & (US$ Million)
    Table 58. Middle East and Africa In-Car Infotainment Market Size by Type (2023-2028) & (US$ Million)
    Table 59. Middle East and Africa In-Car Infotainment Market Size by Application (2017-2022) & (US$ Million)
    Table 60. Middle East and Africa In-Car Infotainment Market Size by Application (2023-2028) & (US$ Million)
    Table 61. Middle East and Africa In-Car Infotainment Market Size by Country (2017-2022) & (US$ Million)
    Table 62. Middle East and Africa In-Car Infotainment Market Size by Country (2023-2028) & (US$ Million)
    Table 63. Panasonic Company Details
    Table 64. Panasonic Business Overview
    Table 65. Panasonic In-Car Infotainment Product
    Table 66. Panasonic Revenue in In-Car Infotainment Business (2017-2022) & (US$ Million)
    Table 67. Panasonic Recent Developments
    Table 68. Fujitsu-Ten Company Details
    Table 69. Fujitsu-Ten Business Overview
    Table 70. Fujitsu-Ten In-Car Infotainment Product
    Table 71. Fujitsu-Ten Revenue in In-Car Infotainment Business (2017-2022) & (US$ Million)
    Table 72. Fujitsu-Ten Recent Developments
    Table 73. Pioneer Company Details
    Table 74. Pioneer Business Overview
    Table 75. Pioneer In-Car Infotainment Product
    Table 76. Pioneer Revenue in In-Car Infotainment Business (2017-2022) & (US$ Million)
    Table 77. Pioneer Recent Developments
    Table 78. Denso Company Details
    Table 79. Denso Business Overview
    Table 80. Denso In-Car Infotainment Product
    Table 81. Denso Revenue in In-Car Infotainment Business (2017-2022) & (US$ Million)
    Table 82. Denso Recent Developments
    Table 83. Aisin Company Details
    Table 84. Aisin Business Overview
    Table 85. Aisin In-Car Infotainment Product
    Table 86. Aisin Revenue in In-Car Infotainment Business (2017-2022) & (US$ Million)
    Table 87. Aisin Recent Developments
    Table 88. Clarion Company Details
    Table 89. Clarion Business Overview
    Table 90. Clarion In-Car Infotainment Product
    Table 91. Clarion Revenue in In-Car Infotainment Business (2017-2022) & (US$ Million)
    Table 92. Clarion Recent Developments
    Table 93. Desay SV Company Details
    Table 94. Desay SV Business Overview
    Table 95. Desay SV In-Car Infotainment Product
    Table 96. Desay SV Revenue in In-Car Infotainment Business (2017-2022) & (US$ Million)
    Table 97. Desay SV Recent Developments
    Table 98. Kenwood Company Details
    Table 99. Kenwood Business Overview
    Table 100. Kenwood In-Car Infotainment Product
    Table 101. Kenwood Revenue in In-Car Infotainment Business (2017-2022) & (US$ Million)
    Table 102. Kenwood Recent Developments
    Table 103. Harman Company Details
    Table 104. Harman Business Overview
    Table 105. Harman In-Car Infotainment Product
    Table 106. Harman Revenue in In-Car Infotainment Business (2017-2022) & (US$ Million)
    Table 107. Harman Recent Developments
    Table 108. ADAYO Company Details
    Table 109. ADAYO Business Overview
    Table 110. ADAYO In-Car Infotainment Product
    Table 111. ADAYO Revenue in In-Car Infotainment Business (2017-2022) & (US$ Million)
    Table 112. ADAYO Recent Developments
    Table 113. Alpine Company Details
    Table 114. Alpine Business Overview
    Table 115. Alpine In-Car Infotainment Product
    Table 116. Alpine Revenue in In-Car Infotainment Business (2017-2022) & (US$ Million)
    Table 117. Alpine Recent Developments
    Table 118. Visteon Company Details
    Table 119. Visteon Business Overview
    Table 120. Visteon In-Car Infotainment Product
    Table 121. Visteon Revenue in In-Car Infotainment Business (2017-2022) & (US$ Million)
    Table 122. Visteon Recent Developments
    Table 123. Continental Company Details
    Table 124. Continental Business Overview
    Table 125. Continental In-Car Infotainment Product
    Table 126. Continental Revenue in In-Car Infotainment Business (2017-2022) & (US$ Million)
    Table 127. Continental Recent Developments
    Table 128. Bosch Company Details
    Table 129. Bosch Business Overview
    Table 130. Bosch In-Car Infotainment Product
    Table 131. Bosch Revenue in In-Car Infotainment Business (2017-2022) & (US$ Million)
    Table 132. Bosch Recent Developments
    Table 133. Hangsheng Company Details
    Table 134. Hangsheng Business Overview
    Table 135. Hangsheng In-Car Infotainment Product
    Table 136. Hangsheng Revenue in In-Car Infotainment Business (2017-2022) & (US$ Million)
    Table 137. Hangsheng Recent Developments
    Table 138. Coagent Company Details
    Table 139. Coagent Business Overview
    Table 140. Coagent In-Car Infotainment Product
    Table 141. Coagent Revenue in In-Car Infotainment Business (2017-2022) & (US$ Million)
    Table 142. Coagent Recent Developments
    Table 143. Mitsubishi Electronics (Melco) Company Details
    Table 144. Mitsubishi Electronics (Melco) Business Overview
    Table 145. Mitsubishi Electronics (Melco) In-Car Infotainment Product
    Table 146. Mitsubishi Electronics (Melco) Revenue in In-Car Infotainment Business (2017-2022) & (US$ Million)
    Table 147. Mitsubishi Electronics (Melco) Recent Developments
    Table 148. Delphi Company Details
    Table 149. Delphi Business Overview
    Table 150. Delphi In-Car Infotainment Product
    Table 151. Delphi Revenue in In-Car Infotainment Business (2017-2022) & (US$ Million)
    Table 152. Delphi Recent Developments
    Table 153. Kaiyue Group Company Details
    Table 154. Kaiyue Group Business Overview
    Table 155. Kaiyue Group In-Car Infotainment Product
    Table 156. Kaiyue Group Revenue in In-Car Infotainment Business (2017-2022) & (US$ Million)
    Table 157. Kaiyue Group Recent Developments
    Table 158. Soling Company Details
    Table 159. Soling Business Overview
    Table 160. Soling In-Car Infotainment Product
    Table 161. Soling Revenue in In-Car Infotainment Business (2017-2022) & (US$ Million)
    Table 162. Soling Recent Developments
    Table 163. Sony Company Details
    Table 164. Sony Business Overview
    Table 165. Sony In-Car Infotainment Product
    Table 166. Sony Revenue in In-Car Infotainment Business (2017-2022) & (US$ Million)
    Table 167. Sony Recent Developments
    Table 168. Research Programs/Design for This Report
    Table 169. Key Data Information from Secondary Sources
    Table 170. Key Data Information from Primary Sources
List of Figures
    Figure 1. Global In-Car Infotainment Market Share by Type: 2021 VS 2028
    Figure 2. QNX System Features
    Figure 3. WinCE System Features
    Figure 4. Linux System Features
    Figure 5. Other System Features
    Figure 6. Global In-Car Infotainment Market Share by Application: 2021 VS 2028
    Figure 7. OEM Case Studies
    Figure 8. Aftermarket Case Studies
    Figure 9. In-Car Infotainment Report Years Considered
    Figure 10. Global In-Car Infotainment Market Size (US$ Million), Year-over-Year: 2017-2028
    Figure 11. Global In-Car Infotainment Market Size, (US$ Million), 2017 VS 2021 VS 2028
    Figure 12. Global In-Car Infotainment Market Share by Region: 2021 VS 2028
    Figure 13. Global In-Car Infotainment Market Share by Players in 2021
    Figure 14. Global Top In-Car Infotainment Players by Company Type (Tier 1, Tier 2, and Tier 3) & (based on the Revenue in In-Car Infotainment as of 2021)
    Figure 15. The Top 10 and 5 Players Market Share by In-Car Infotainment Revenue in 2021
    Figure 16. North America In-Car Infotainment Market Size YoY (2017-2028) & (US$ Million)
    Figure 17. North America In-Car Infotainment Market Size Market Share by Type (2017-2028)
    Figure 18. North America In-Car Infotainment Market Size Market Share by Application (2017-2028)
    Figure 19. North America In-Car Infotainment Market Size Share by Country (2017-2028)
    Figure 20. United States In-Car Infotainment Market Size YoY Growth (2017-2028) & (US$ Million)
    Figure 21. Canada In-Car Infotainment Market Size YoY Growth (2017-2028) & (US$ Million)
    Figure 22. Europe In-Car Infotainment Market Size YoY (2017-2028) & (US$ Million)
    Figure 23. Europe In-Car Infotainment Market Size Market Share by Type (2017-2028)
    Figure 24. Europe In-Car Infotainment Market Size Market Share by Application (2017-2028)
    Figure 25. Europe In-Car Infotainment Market Size Share by Country (2017-2028)
    Figure 26. Germany In-Car Infotainment Market Size YoY Growth (2017-2028) & (US$ Million)
    Figure 27. France In-Car Infotainment Market Size YoY Growth (2017-2028) & (US$ Million)
    Figure 28. U.K. In-Car Infotainment Market Size YoY Growth (2017-2028) & (US$ Million)
    Figure 29. Italy In-Car Infotainment Market Size YoY Growth (2017-2028) & (US$ Million)
    Figure 30. Russia In-Car Infotainment Market Size YoY Growth (2017-2028) & (US$ Million)
    Figure 31. Nordic Countries In-Car Infotainment Market Size YoY Growth (2017-2028) & (US$ Million)
    Figure 32. Asia-Pacific In-Car Infotainment Market Size YoY (2017-2028) & (US$ Million)
    Figure 33. Asia Pacific In-Car Infotainment Market Size Market Share by Type (2017-2028)
    Figure 34. Asia Pacific In-Car Infotainment Market Size Market Share by Application (2017-2028)
    Figure 35. Asia Pacific In-Car Infotainment Market Size Share by Region (2017-2028)
    Figure 36. China In-Car Infotainment Market Size YoY Growth (2017-2028) & (US$ Million)
    Figure 37. Japan In-Car Infotainment Market Size YoY Growth (2017-2028) & (US$ Million)
    Figure 38. South Korea In-Car Infotainment Market Size YoY Growth (2017-2028) & (US$ Million)
    Figure 39. Southeast Asia In-Car Infotainment Market Size YoY Growth (2017-2028) & (US$ Million)
    Figure 40. India In-Car Infotainment Market Size YoY Growth (2017-2028) & (US$ Million)
    Figure 41. Australia In-Car Infotainment Market Size YoY Growth (2017-2028) & (US$ Million)
List of Figures
    Figure 42. Latin America In-Car Infotainment Market Size YoY (2017-2028) & (US$ Million)
    Figure 43. Latin America In-Car Infotainment Market Size Market Share by Type (2017-2028)
    Figure 44. Latin America In-Car Infotainment Market Size Market Share by Application (2017-2028)
    Figure 45. Latin America In-Car Infotainment Market Size Share by Country (2017-2028)
    Figure 46. Mexico In-Car Infotainment Market Size YoY Growth (2017-2028) & (US$ Million)
    Figure 47. Brazil In-Car Infotainment Market Size YoY Growth (2017-2028) & (US$ Million)
    Figure 48. Middle East & Africa In-Car Infotainment Market Size YoY (2017-2028) & (US$ Million)
    Figure 49. Middle East and Africa In-Car Infotainment Market Size Market Share by Type (2017-2028)
    Figure 50. Middle East and Africa In-Car Infotainment Market Size Market Share by Application (2017-2028)
    Figure 51. Middle East and Africa In-Car Infotainment Market Size Share by Country (2017-2028)
    Figure 52. Turkey In-Car Infotainment Market Size YoY Growth (2017-2028) & (US$ Million)
    Figure 53. Saudi Arabia In-Car Infotainment Market Size YoY Growth (2017-2028) & (US$ Million)
    Figure 54. UAE In-Car Infotainment Market Size YoY Growth (2017-2028) & (US$ Million)
    Figure 55. Panasonic Revenue Growth Rate in In-Car Infotainment Business (2017-2022)
    Figure 56. Fujitsu-Ten Revenue Growth Rate in In-Car Infotainment Business (2017-2022)
    Figure 57. Pioneer Revenue Growth Rate in In-Car Infotainment Business (2017-2022)
    Figure 58. Denso Revenue Growth Rate in In-Car Infotainment Business (2017-2022)
    Figure 59. Aisin Revenue Growth Rate in In-Car Infotainment Business (2017-2022)
    Figure 60. Clarion Revenue Growth Rate in In-Car Infotainment Business (2017-2022)
    Figure 61. Desay SV Revenue Growth Rate in In-Car Infotainment Business (2017-2022)
    Figure 62. Kenwood Revenue Growth Rate in In-Car Infotainment Business (2017-2022)
    Figure 63. Harman Revenue Growth Rate in In-Car Infotainment Business (2017-2022)
    Figure 64. ADAYO Revenue Growth Rate in In-Car Infotainment Business (2017-2022)
    Figure 65. Alpine Revenue Growth Rate in In-Car Infotainment Business (2017-2022)
    Figure 66. Visteon Revenue Growth Rate in In-Car Infotainment Business (2017-2022)
    Figure 67. Continental Revenue Growth Rate in In-Car Infotainment Business (2017-2022)
    Figure 68. Bosch Revenue Growth Rate in In-Car Infotainment Business (2017-2022)
    Figure 69. Hangsheng Revenue Growth Rate in In-Car Infotainment Business (2017-2022)
    Figure 70. Coagent Revenue Growth Rate in In-Car Infotainment Business (2017-2022)
    Figure 71. Mitsubishi Electronics (Melco) Revenue Growth Rate in In-Car Infotainment Business (2017-2022)
    Figure 72. Delphi Revenue Growth Rate in In-Car Infotainment Business (2017-2022)
    Figure 73. Kaiyue Group Revenue Growth Rate in In-Car Infotainment Business (2017-2022)
    Figure 74. Soling Revenue Growth Rate in In-Car Infotainment Business (2017-2022)
    Figure 75. Sony Revenue Growth Rate in In-Car Infotainment Business (2017-2022)
    Figure 76. Bottom-up and Top-down Approaches for This Report
    Figure 77. Data Triangulation
    Figure 78. Key Executives Interviewed
SELECT A FORMAT
Added to Cart
Electronic (PDF)

$4900

This license allows only one user to access the PDF.
Electronic (PDF)

$7350

This license allows 1 - 5 user to access the PDF, license is suitable for small groups of 5 users working together
Electronic (PDF)

$9800

This license allows users/teams in a same Enterprise to use this report, various departments within an enterpise can use this report
Add to Cart
Buy Now (15% Discount)

OUR CUSTOMER

SIS Group of Schools

SIMILAR REPORTS