0
U.S. (TOLL FREE)
+1 (315) 215-3225
Automative

0
U.S. (TOLL FREE)
+1 (315) 215-3225
Global Reflective Sheeting Market Research Report 2026
Published Date: 2026-01-23
|
Report Code: QYRE-Auto-34X8902
Home | Market Reports | Autos & Vehicles| Vehicle Codes & Driving Laws
Global Reflective Sheeting Market Insights and Forecast to 2028
BUY CHAPTERS

Global Reflective Sheeting Market Research Report 2026

Code: QYRE-Auto-34X8902
Report
2026-01-23
Pages:150
QYResearch
Buy Now with 15% Discount
DESCRIPTION
TABLE OF CONTENT
TABLES & FIGURES

Reflective Sheeting Market Size

The global Reflective Sheeting market was valued at US$ 58.73 million in 2025 and is anticipated to reach US$ 73.58 million by 2032, at a CAGR of 2.0% from 2026 to 2032.

Reflective Sheeting Market

Reflective Sheeting Market

The 2025 U.S. tariff policies introduce profound uncertainty into the global economic landscape. This report critically examines the implications of recent tariff adjustments and international strategic countermeasures on Reflective Sheeting competitive dynamics, regional economic interdependencies, and supply chain reconfigurations.
Reflective sheeting is a retroreflective sheet material designed to enhance the visibility of signs and objects at night and in low-light conditions. Typically supplied in rolls or sheets, it uses optical structures such as glass beads or microprisms (including full cube-corner prisms) to efficiently return incident light back toward the source, thereby significantly improving recognition at long distances and over wide observation angles. Such materials generally feature outdoor weatherability and graded service life (e.g., UV and moisture/soil resistance), printable surfaces for information display via screen or digital printing, and pressure-sensitive adhesive (PSA) backings for quick application; depending on the use case, flexible variants are also available for curved or tubular substrates. Its core value lies in safety-driven visual enhancement: it is widely used in road traffic signs, temporary work-zone and industrial warning signage, vehicle and container conspicuity markings, license plates and anti-counterfeiting identifiers, as well as high-visibility apparel, to improve all-weather conspicuity and reduce accident risks.
The competitive edge of reflective sheeting is not simply “whether it reflects,” but the integrated performance of retroreflective efficiency, wide-angle legibility, and long-term outdoor durability. The two mainstream technology routes—glass-bead and microprismatic (especially cube-corner) structures—map to different ceilings in brightness, angular performance, and cost structure. In practice, the optical micro-structure, substrate selection, and protective topcoats jointly determine product grading and pricing power, so industry value is increasingly concentrated in engineering capabilities that combine “optics + materials + weatherability” into reliable, scalable products.
Reflective sheeting is also evolving from a single-purpose material into a “processable signage carrier,” making convertibility and print compatibility a key differentiator. Manufacturers commonly emphasize screen/digital printability and graphic retention alongside UV and moisture/soil resistance, while pressure-sensitive adhesive (PSA) backings enable faster application and higher installation productivity. As a result, reflective sheeting does not only deliver conspicuity; it directly influences downstream manufacturing efficiency and the total cost of ownership for traffic signs, industrial warnings, and commercial information graphics.
End-use demand is highly segmented, which is pushing the supply model toward “service-life grading + application-specific customization.” Permanent road signs, temporary work-zone signage, vehicle and container conspicuity markings, license-plate and anti-counterfeiting identifiers, and high-visibility apparel each impose different requirements on brightness, adhesion reliability, flexibility (for curved/tubular substrates), and durability limits. Companies differentiate through tiered product families, adhesive systems, and flexible formats. Fundamentally, reflective sheeting functions as safety visibility infrastructure: its growth is closely linked to road-safety governance, work-zone management, and logistics/transport compliance, and it typically benefits from structural upgrading toward higher-performance grades as regulations tighten and the cost of incidents rises.
This report delivers a comprehensive overview of the global Reflective Sheeting market, with both quantitative and qualitative analyses, to help readers develop growth strategies, assess the competitive landscape, evaluate their position in the current market, and make informed business decisions regarding Reflective Sheeting. The Reflective Sheeting market size, estimates, and forecasts are provided in terms of shipments (M Sq.m) and revenue (US$ millions), with 2025 as the base year and historical and forecast data for 2021–2032.
The report segments the global Reflective Sheeting market comprehensively. Regional market sizes by Technology, by Application, by Material, and by company are also provided. For deeper insight, the report profiles the competitive landscape, key competitors, and their respective market rankings, and discusses technological trends and new product developments.
This report will assist Reflective Sheeting manufacturers, new entrants, and companies across the industry value chain with information on revenues, production, and average prices for the overall market and its sub-segments, by company, by Technology, by Application, and by region.
Market Segmentation

Scope of Reflective Sheeting Market Report

Report Metric Details
Report Name Reflective Sheeting Market
Accounted market size in 2025 US$ 58.73 million
Forecasted market size in 2032 US$ 73.58 million
CAGR 2.0%
Base Year 2025
Forecasted years 2026 - 2032
Segment by Technology
  • Glass Bead Type
  • Micro Prismatic Type
Segment by Material
  • 丙烯酸(PMMA)面层反光膜
  • 聚碳酸酯(PC)面层反光膜(耐磨型)
  • 聚氯乙烯(PVC)反光膜
  • 聚酯(PET)反光膜(刻字/印刷基材常见)
  • 金属化反光膜
  • 荧光颜料体系反光膜(荧光层)
Segment by Intensity
  • 钻石级
  • 高强级
  • 超强级
  • 工程级
  • 高级工程级
by Application
  • Permanent Traffic Signs (Road Traffic Signage)
  • Work Zone & Temporary Traffic Control
  • Vehicle Conspicuity Marking
  • PPE & Safety Apparel (Hi-Vis)
  • Industrial Safety & Facility Marking
  • Commercial Graphics & Reflective Advertising
  • Marine/Aviation/Specialty Navigation & Public Safety
  • License Plate & Security Sheeting (Optional)
  • Rail/Mining/Port Safety Marking (Optional)
  • Others
Production by Region
  • North America
  • Europe
  • China
  • Japan
  • South Korea
Consumption by Region
  • North America (United States, Canada)
  • Europe (Germany, France, UK, Italy, Russia)
  • Asia-Pacific (China, Japan, South Korea, Taiwan)
  • Southeast Asia (India)
  • Latin America (Mexico, Brazil)
By Company 3M Company, Avery Dennison Corporation, ORAFOL Europe GmbH, Nippon Carbide Industries Co., Inc., Daoming Optics & Chemical Co., Ltd., Jinsung Corporation, Viz Reflectives Ltd., ATSM, STAR-REFLEX, Viz Reflectives, MN Tech Global, Changzhou Hua R Sheng Reflective Material Co., Ltd., Yeshili / YSL, Huangshan Xingwei Reflective Material Co., Ltd. (XW Reflective), Anhui Alsafety Reflective Material Co., Ltd.
Forecast units USD million in value
Report coverage Revenue and volume forecast, company share, competitive landscape, growth factors and trends

Chapter Outline

  • Chapter 1: Defines the scope of the report and presents an executive summary of market segments (by Technology, by Application, by Material, etc.), including the size of each segment and its future growth potential. It offers a high-level view of the current market and its likely evolution in the short, medium, and long term.
  • Chapter 2: Provides a detailed analysis of the competitive landscape for Reflective Sheeting manufacturers, including prices, production, value-based market shares, latest development plans, and information on mergers and acquisitions.
  • Chapter 3: Examines Reflective Sheeting production/output and value by region and country, providing a quantitative assessment of market size and growth potential for each region over the next six years.
  • Chapter 4: Analyzes Reflective Sheeting consumption at the regional and country levels. It quantifies market size and growth potential for each region and its key countries, and outlines market development, outlook, addressable space, and national production.
  • Chapter 5: Analyzes market segments by Technology, covering the size and growth potential of each segment to help readers identify “blue ocean” opportunities.
  • Chapter 6: Analyzes market segments by Application, covering the size and growth potential of each segment to help readers identify “blue ocean” opportunities in downstream markets.
  • Chapter 7: Profiles key players, detailing the fundamentals of major companies, including product production/output, value, price, gross margin, product portfolio/introductions, and recent developments.
  • Chapter 8: Reviews the industry value chain, including upstream and downstream segments.
  • Chapter 9: Discusses market dynamics and recent developments, including drivers, restraints, challenges and risks for manufacturers, U.S. Tariffs and relevant policy analysis.
  • Chapter 10: Summarizes the key findings and conclusions of the report.

FAQ for this report

How fast is Reflective Sheeting Market growing?

Ans: The Reflective Sheeting Market witnessing a CAGR of 2.0% during the forecast period 2026-2032.

What is the Reflective Sheeting Market size in 2032?

Ans: The Reflective Sheeting Market size in 2032 will be US$ 73.58 million.

Who are the main players in the Reflective Sheeting Market report?

Ans: The main players in the Reflective Sheeting Market are 3M Company, Avery Dennison Corporation, ORAFOL Europe GmbH, Nippon Carbide Industries Co., Inc., Daoming Optics & Chemical Co., Ltd., Jinsung Corporation, Viz Reflectives Ltd., ATSM, STAR-REFLEX, Viz Reflectives, MN Tech Global, Changzhou Hua R Sheng Reflective Material Co., Ltd., Yeshili / YSL, Huangshan Xingwei Reflective Material Co., Ltd. (XW Reflective), Anhui Alsafety Reflective Material Co., Ltd.

What are the Application segmentation covered in the Reflective Sheeting Market report?

Ans: The Applications covered in the Reflective Sheeting Market report are Permanent Traffic Signs (Road Traffic Signage), Work Zone & Temporary Traffic Control, Vehicle Conspicuity Marking, PPE & Safety Apparel (Hi-Vis), Industrial Safety & Facility Marking, Commercial Graphics & Reflective Advertising, Marine/Aviation/Specialty Navigation & Public Safety, License Plate & Security Sheeting (Optional), Rail/Mining/Port Safety Marking (Optional), Others

1 Reflective Sheeting Market Overview
1.1 Product Definition
1.2 Reflective Sheeting by Technology
1.2.1 Global Reflective Sheeting Market Value Growth Rate Analysis by Technology: 2025 vs 2032
1.2.2 Glass Bead Type
1.2.3 Micro Prismatic Type
1.3 Reflective Sheeting by Material
1.3.1 Global Reflective Sheeting Market Value Growth Rate Analysis by Material: 2025 vs 2032
1.3.2 丙烯酸(PMMA)面层反光膜
1.3.3 聚碳酸酯(PC)面层反光膜(耐磨型)
1.3.4 聚氯乙烯(PVC)反光膜
1.3.5 聚酯(PET)反光膜(刻字/印刷基材常见)
1.3.6 金属化反光膜
1.3.7 荧光颜料体系反光膜(荧光层)
1.4 Reflective Sheeting by Intensity
1.4.1 Global Reflective Sheeting Market Value Growth Rate Analysis by Intensity: 2025 vs 2032
1.4.2 钻石级
1.4.3 高强级
1.4.4 超强级
1.4.5 工程级
1.4.6 高级工程级
1.5 Reflective Sheeting by Application
1.5.1 Global Reflective Sheeting Market Value Growth Rate Analysis by Application: 2025 vs 2032
1.5.2 Permanent Traffic Signs (Road Traffic Signage)
1.5.3 Work Zone & Temporary Traffic Control
1.5.4 Vehicle Conspicuity Marking
1.5.5 PPE & Safety Apparel (Hi-Vis)
1.5.6 Industrial Safety & Facility Marking
1.5.7 Commercial Graphics & Reflective Advertising
1.5.8 Marine/Aviation/Specialty Navigation & Public Safety
1.5.9 License Plate & Security Sheeting (Optional)
1.5.10 Rail/Mining/Port Safety Marking (Optional)
1.6 Global Market Growth Prospects
1.6.1 Global Reflective Sheeting Production Value Estimates and Forecasts (2021–2032)
1.6.2 Global Reflective Sheeting Production Capacity Estimates and Forecasts (2021–2032)
1.6.3 Global Reflective Sheeting Production Estimates and Forecasts (2021–2032)
1.6.4 Global Reflective Sheeting Market Average Price Estimates and Forecasts (2021–2032)
1.7 Assumptions and Limitations
2 Market Competition by Manufacturers
2.1 Global Reflective Sheeting Production Market Share by Manufacturers (2021–2026)
2.2 Global Reflective Sheeting Production Value Market Share by Manufacturers (2021–2026)
2.3 Global Key Players of Reflective Sheeting, Industry Ranking, 2024 vs 2025
2.4 Global Reflective Sheeting Market Share by Company Tier (Tier 1, Tier 2, Tier 3)
2.5 Global Reflective Sheeting Average Price by Manufacturers (2021–2026)
2.6 Global Key Manufacturers of Reflective Sheeting, Manufacturing Footprints and Headquarters
2.7 Global Key Manufacturers of Reflective Sheeting, Product Offerings and Applications
2.8 Global Key Manufacturers of Reflective Sheeting, Date of Entry into the Industry
2.9 Reflective Sheeting Market Competitive Situation and Trends
2.9.1 Reflective Sheeting Market Concentration Rate
2.9.2 Top 5 and Top 10 Global Reflective Sheeting Players Market Share by Revenue
2.10 Mergers & Acquisitions and Expansion
3 Reflective Sheeting Production by Region
3.1 Global Reflective Sheeting Production Value Estimates and Forecasts by Region: 2021 vs 2025 vs 2032
3.2 Global Reflective Sheeting Production Value by Region (2021–2032)
3.2.1 Global Reflective Sheeting Production Value by Region (2021–2026)
3.2.2 Global Forecasted Production Value of Reflective Sheeting by Region (2027–2032)
3.3 Global Reflective Sheeting Production Estimates and Forecasts by Region: 2021 vs 2025 vs 2032
3.4 Global Reflective Sheeting Production Volume by Region (2021–2032)
3.4.1 Global Reflective Sheeting Production by Region (2021–2026)
3.4.2 Global Forecasted Production of Reflective Sheeting by Region (2027–2032)
3.5 Global Reflective Sheeting Market Price Analysis by Region (2021–2026)
3.6 Global Reflective Sheeting Production, Value, and Year-over-Year Growth
3.6.1 North America Reflective Sheeting Production Value Estimates and Forecasts (2021–2032)
3.6.2 Europe Reflective Sheeting Production Value Estimates and Forecasts (2021–2032)
3.6.3 China Reflective Sheeting Production Value Estimates and Forecasts (2021–2032)
3.6.4 Japan Reflective Sheeting Production Value Estimates and Forecasts (2021–2032)
3.6.5 South Korea Reflective Sheeting Production Value Estimates and Forecasts (2021–2032)
4 Reflective Sheeting Consumption by Region
4.1 Global Reflective Sheeting Consumption Estimates and Forecasts by Region: 2021 vs 2025 vs 2032
4.2 Global Reflective Sheeting Consumption by Region (2021–2032)
4.2.1 Global Reflective Sheeting Consumption by Region (2021–2026)
4.2.2 Global Reflective Sheeting Forecasted Consumption by Region (2027–2032)
4.3 North America
4.3.1 North America Reflective Sheeting Consumption Growth Rate by Country: 2021 vs 2025 vs 2032
4.3.2 North America Reflective Sheeting Consumption by Country (2021–2032)
4.3.3 U.S.
4.3.4 Canada
4.4 Europe
4.4.1 Europe Reflective Sheeting Consumption Growth Rate by Country: 2021 vs 2025 vs 2032
4.4.2 Europe Reflective Sheeting Consumption by Country (2021–2032)
4.4.3 Germany
4.4.4 France
4.4.5 U.K.
4.4.6 Italy
4.4.7 Russia
4.5 Asia Pacific
4.5.1 Asia Pacific Reflective Sheeting Consumption Growth Rate by Region: 2021 vs 2025 vs 2032
4.5.2 Asia Pacific Reflective Sheeting Consumption by Region (2021–2032)
4.5.3 China
4.5.4 Japan
4.5.5 South Korea
4.5.6 China Taiwan
4.5.7 Southeast Asia
4.5.8 India
4.6 Latin America, Middle East & Africa
4.6.1 Latin America, Middle East & Africa Reflective Sheeting Consumption Growth Rate by Country: 2021 vs 2025 vs 2032
4.6.2 Latin America, Middle East & Africa Reflective Sheeting Consumption by Country (2021–2032)
4.6.3 Mexico
4.6.4 Brazil
4.6.5 Turkey
4.6.6 GCC Countries
5 Segment by Technology
5.1 Global Reflective Sheeting Production by Technology (2021–2032)
5.1.1 Global Reflective Sheeting Production by Technology (2021–2026)
5.1.2 Global Reflective Sheeting Production by Technology (2027–2032)
5.1.3 Global Reflective Sheeting Production Market Share by Technology (2021–2032)
5.2 Global Reflective Sheeting Production Value by Technology (2021–2032)
5.2.1 Global Reflective Sheeting Production Value by Technology (2021–2026)
5.2.2 Global Reflective Sheeting Production Value by Technology (2027–2032)
5.2.3 Global Reflective Sheeting Production Value Market Share by Technology (2021–2032)
5.3 Global Reflective Sheeting Price by Technology (2021–2032)
6 Segment by Application
6.1 Global Reflective Sheeting Production by Application (2021–2032)
6.1.1 Global Reflective Sheeting Production by Application (2021–2026)
6.1.2 Global Reflective Sheeting Production by Application (2027–2032)
6.1.3 Global Reflective Sheeting Production Market Share by Application (2021–2032)
6.2 Global Reflective Sheeting Production Value by Application (2021–2032)
6.2.1 Global Reflective Sheeting Production Value by Application (2021–2026)
6.2.2 Global Reflective Sheeting Production Value by Application (2027–2032)
6.2.3 Global Reflective Sheeting Production Value Market Share by Application (2021–2032)
6.3 Global Reflective Sheeting Price by Application (2021–2032)
7 Key Companies Profiled
7.1 3M Company
7.1.1 3M Company Reflective Sheeting Company Information
7.1.2 3M Company Reflective Sheeting Product Portfolio
7.1.3 3M Company Reflective Sheeting Production, Value, Price, and Gross Margin (2021–2026)
7.1.4 3M Company Main Business and Markets Served
7.1.5 3M Company Recent Developments/Updates
7.2 Avery Dennison Corporation
7.2.1 Avery Dennison Corporation Reflective Sheeting Company Information
7.2.2 Avery Dennison Corporation Reflective Sheeting Product Portfolio
7.2.3 Avery Dennison Corporation Reflective Sheeting Production, Value, Price, and Gross Margin (2021–2026)
7.2.4 Avery Dennison Corporation Main Business and Markets Served
7.2.5 Avery Dennison Corporation Recent Developments/Updates
7.3 ORAFOL Europe GmbH
7.3.1 ORAFOL Europe GmbH Reflective Sheeting Company Information
7.3.2 ORAFOL Europe GmbH Reflective Sheeting Product Portfolio
7.3.3 ORAFOL Europe GmbH Reflective Sheeting Production, Value, Price, and Gross Margin (2021–2026)
7.3.4 ORAFOL Europe GmbH Main Business and Markets Served
7.3.5 ORAFOL Europe GmbH Recent Developments/Updates
7.4 Nippon Carbide Industries Co., Inc.
7.4.1 Nippon Carbide Industries Co., Inc. Reflective Sheeting Company Information
7.4.2 Nippon Carbide Industries Co., Inc. Reflective Sheeting Product Portfolio
7.4.3 Nippon Carbide Industries Co., Inc. Reflective Sheeting Production, Value, Price, and Gross Margin (2021–2026)
7.4.4 Nippon Carbide Industries Co., Inc. Main Business and Markets Served
7.4.5 Nippon Carbide Industries Co., Inc. Recent Developments/Updates
7.5 Daoming Optics & Chemical Co., Ltd.
7.5.1 Daoming Optics & Chemical Co., Ltd. Reflective Sheeting Company Information
7.5.2 Daoming Optics & Chemical Co., Ltd. Reflective Sheeting Product Portfolio
7.5.3 Daoming Optics & Chemical Co., Ltd. Reflective Sheeting Production, Value, Price, and Gross Margin (2021–2026)
7.5.4 Daoming Optics & Chemical Co., Ltd. Main Business and Markets Served
7.5.5 Daoming Optics & Chemical Co., Ltd. Recent Developments/Updates
7.6 Jinsung Corporation
7.6.1 Jinsung Corporation Reflective Sheeting Company Information
7.6.2 Jinsung Corporation Reflective Sheeting Product Portfolio
7.6.3 Jinsung Corporation Reflective Sheeting Production, Value, Price, and Gross Margin (2021–2026)
7.6.4 Jinsung Corporation Main Business and Markets Served
7.6.5 Jinsung Corporation Recent Developments/Updates
7.7 Viz Reflectives Ltd.
7.7.1 Viz Reflectives Ltd. Reflective Sheeting Company Information
7.7.2 Viz Reflectives Ltd. Reflective Sheeting Product Portfolio
7.7.3 Viz Reflectives Ltd. Reflective Sheeting Production, Value, Price, and Gross Margin (2021–2026)
7.7.4 Viz Reflectives Ltd. Main Business and Markets Served
7.7.5 Viz Reflectives Ltd. Recent Developments/Updates
7.8 ATSM
7.8.1 ATSM Reflective Sheeting Company Information
7.8.2 ATSM Reflective Sheeting Product Portfolio
7.8.3 ATSM Reflective Sheeting Production, Value, Price, and Gross Margin (2021–2026)
7.8.4 ATSM Main Business and Markets Served
7.8.5 ATSM Recent Developments/Updates
7.9 STAR-REFLEX
7.9.1 STAR-REFLEX Reflective Sheeting Company Information
7.9.2 STAR-REFLEX Reflective Sheeting Product Portfolio
7.9.3 STAR-REFLEX Reflective Sheeting Production, Value, Price, and Gross Margin (2021–2026)
7.9.4 STAR-REFLEX Main Business and Markets Served
7.9.5 STAR-REFLEX Recent Developments/Updates
7.10 Viz Reflectives
7.10.1 Viz Reflectives Reflective Sheeting Company Information
7.10.2 Viz Reflectives Reflective Sheeting Product Portfolio
7.10.3 Viz Reflectives Reflective Sheeting Production, Value, Price, and Gross Margin (2021–2026)
7.10.4 Viz Reflectives Main Business and Markets Served
7.10.5 Viz Reflectives Recent Developments/Updates
7.11 MN Tech Global
7.11.1 MN Tech Global Reflective Sheeting Company Information
7.11.2 MN Tech Global Reflective Sheeting Product Portfolio
7.11.3 MN Tech Global Reflective Sheeting Production, Value, Price, and Gross Margin (2021–2026)
7.11.4 MN Tech Global Main Business and Markets Served
7.11.5 MN Tech Global Recent Developments/Updates
7.12 Changzhou Hua R Sheng Reflective Material Co., Ltd.
7.12.1 Changzhou Hua R Sheng Reflective Material Co., Ltd. Reflective Sheeting Company Information
7.12.2 Changzhou Hua R Sheng Reflective Material Co., Ltd. Reflective Sheeting Product Portfolio
7.12.3 Changzhou Hua R Sheng Reflective Material Co., Ltd. Reflective Sheeting Production, Value, Price, and Gross Margin (2021–2026)
7.12.4 Changzhou Hua R Sheng Reflective Material Co., Ltd. Main Business and Markets Served
7.12.5 Changzhou Hua R Sheng Reflective Material Co., Ltd. Recent Developments/Updates
7.13 Yeshili / YSL
7.13.1 Yeshili / YSL Reflective Sheeting Company Information
7.13.2 Yeshili / YSL Reflective Sheeting Product Portfolio
7.13.3 Yeshili / YSL Reflective Sheeting Production, Value, Price, and Gross Margin (2021–2026)
7.13.4 Yeshili / YSL Main Business and Markets Served
7.13.5 Yeshili / YSL Recent Developments/Updates
7.14 Huangshan Xingwei Reflective Material Co., Ltd. (XW Reflective)
7.14.1 Huangshan Xingwei Reflective Material Co., Ltd. (XW Reflective) Reflective Sheeting Company Information
7.14.2 Huangshan Xingwei Reflective Material Co., Ltd. (XW Reflective) Reflective Sheeting Product Portfolio
7.14.3 Huangshan Xingwei Reflective Material Co., Ltd. (XW Reflective) Reflective Sheeting Production, Value, Price, and Gross Margin (2021–2026)
7.14.4 Huangshan Xingwei Reflective Material Co., Ltd. (XW Reflective) Main Business and Markets Served
7.14.5 Huangshan Xingwei Reflective Material Co., Ltd. (XW Reflective) Recent Developments/Updates
7.15 Anhui Alsafety Reflective Material Co., Ltd.
7.15.1 Anhui Alsafety Reflective Material Co., Ltd. Reflective Sheeting Company Information
7.15.2 Anhui Alsafety Reflective Material Co., Ltd. Reflective Sheeting Product Portfolio
7.15.3 Anhui Alsafety Reflective Material Co., Ltd. Reflective Sheeting Production, Value, Price, and Gross Margin (2021–2026)
7.15.4 Anhui Alsafety Reflective Material Co., Ltd. Main Business and Markets Served
7.15.5 Anhui Alsafety Reflective Material Co., Ltd. Recent Developments/Updates
7.16 Anhui Alsafety Reflective Material Co., Ltd.
7.16.1 Anhui Alsafety Reflective Material Co., Ltd. Reflective Sheeting Company Information
7.16.2 Anhui Alsafety Reflective Material Co., Ltd. Reflective Sheeting Product Portfolio
7.16.3 Anhui Alsafety Reflective Material Co., Ltd. Reflective Sheeting Production, Value, Price, and Gross Margin (2021–2026)
7.16.4 Anhui Alsafety Reflective Material Co., Ltd. Main Business and Markets Served
7.16.5 Anhui Alsafety Reflective Material Co., Ltd. Recent Developments/Updates
8 Industry Chain and Sales Channels Analysis
8.1 Reflective Sheeting Industry Chain Analysis
8.2 Reflective Sheeting Raw Material Supply Analysis
8.2.1 Key Raw Materials
8.2.2 Raw Materials Key Suppliers
8.3 Reflective Sheeting Production Modes and Processes
8.4 Reflective Sheeting Sales and Marketing
8.4.1 Reflective Sheeting Sales Channels
8.4.2 Reflective Sheeting Distributors
8.5 Reflective Sheeting Customer Analysis
9 Reflective Sheeting Market Dynamics
9.1 Reflective Sheeting Industry Trends
9.2 Reflective Sheeting Market Drivers
9.3 Reflective Sheeting Market Challenges
9.4 Reflective Sheeting Market Restraints
9.5 Impact of U.S. Tariffs
10 Research Findings and Conclusion
11 Methodology and Data Source
11.1 Methodology/Research Approach
11.1.1 Research Programs/Design
11.1.2 Market Size Estimation
11.1.3 Market Breakdown and Data Triangulation
11.2 Data Source
11.2.1 Secondary Sources
11.2.2 Primary Sources
11.3 Author List
11.4 Disclaimer
List of Tables
 Table 1. Global Reflective Sheeting Market Value by Technology (US$ Million), 2025 vs 2032
 Table 2. Global Reflective Sheeting Market Value by Material (US$ Million), 2025 vs 2032
 Table 3. Global Reflective Sheeting Market Value by Intensity (US$ Million), 2025 vs 2032
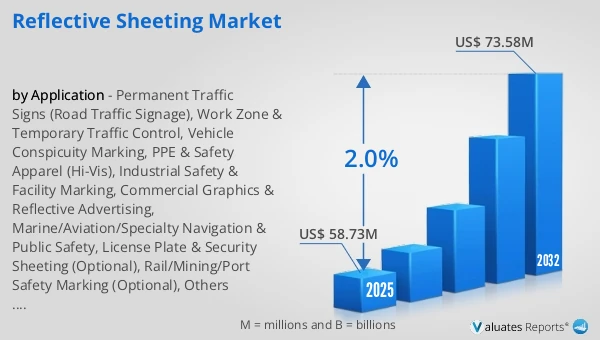
 Table 4. Global Reflective Sheeting Market Value by Application (US$ Million), 2025 vs 2032
 Table 5. Global Reflective Sheeting Production Capacity (M Sq.m) by Manufacturers in 2025
 Table 6. Global Reflective Sheeting Production by Manufacturers (M Sq.m), 2021–2026
 Table 7. Global Reflective Sheeting Production Market Share by Manufacturers (2021–2026)
 Table 8. Global Reflective Sheeting Production Value by Manufacturers (US$ Million), 2021–2026
 Table 9. Global Reflective Sheeting Production Value Share by Manufacturers (2021–2026)
 Table 10. Global Key Players of Reflective Sheeting, Industry Ranking, 2024 vs 2025
 Table 11. Classification of Companies by Tier (Tier 1, Tier 2, Tier 3), based on Reflective Sheeting Production Value, 2025
 Table 12. Global Market Reflective Sheeting Average Price by Manufacturers (USD/Sq.m), 2021–2026
 Table 13. Global Key Manufacturers of Reflective Sheeting, Manufacturing Footprints and Headquarters
 Table 14. Global Key Manufacturers of Reflective Sheeting, Product Offerings and Applications
 Table 15. Global Key Manufacturers of Reflective Sheeting, Date of Entry into the Industry
 Table 16. Global Reflective Sheeting Manufacturers Market Concentration Ratio (CR5 and HHI)
 Table 17. Mergers & Acquisitions and Expansion Plans
 Table 18. Global Reflective Sheeting Production Value by Region: 2021 vs 2025 vs 2032 (US$ Million)
 Table 19. Global Reflective Sheeting Production Value (US$ Million) by Region (2021–2026)
 Table 20. Global Reflective Sheeting Production Value Market Share by Region (2021–2026)
 Table 21. Global Reflective Sheeting Production Value (US$ Million) Forecast by Region (2027–2032)
 Table 22. Global Reflective Sheeting Production Value Market Share Forecast by Region (2027–2032)
 Table 23. Global Reflective Sheeting Production Comparison by Region: 2021 vs 2025 vs 2032 (M Sq.m)
 Table 24. Global Reflective Sheeting Production (M Sq.m) by Region (2021–2026)
 Table 25. Global Reflective Sheeting Production Market Share by Region (2021–2026)
 Table 26. Global Reflective Sheeting Production (M Sq.m) Forecast by Region (2027–2032)
 Table 27. Global Reflective Sheeting Production Market Share Forecast by Region (2027–2032)
 Table 28. Global Reflective Sheeting Market Average Price (USD/Sq.m) by Region (2021–2026)
 Table 29. Global Reflective Sheeting Market Average Price (USD/Sq.m) by Region (2027–2032)
 Table 30. Global Reflective Sheeting Consumption Growth Rate by Region: 2021 vs 2025 vs 2032 (M Sq.m)
 Table 31. Global Reflective Sheeting Consumption by Region (M Sq.m), 2021–2026
 Table 32. Global Reflective Sheeting Consumption Market Share by Region (2021–2026)
 Table 33. Global Reflective Sheeting Forecasted Consumption by Region (M Sq.m), 2027–2032
 Table 34. Global Reflective Sheeting Forecasted Consumption Market Share by Region (2027–2032)
 Table 35. North America Reflective Sheeting Consumption Growth Rate by Country: 2021 vs 2025 vs 2032 (M Sq.m)
 Table 36. North America Reflective Sheeting Consumption by Country (M Sq.m), 2021–2026
 Table 37. North America Reflective Sheeting Consumption by Country (M Sq.m), 2027–2032
 Table 38. Europe Reflective Sheeting Consumption Growth Rate by Country: 2021 vs 2025 vs 2032 (M Sq.m)
 Table 39. Europe Reflective Sheeting Consumption by Country (M Sq.m), 2021–2026
 Table 40. Europe Reflective Sheeting Consumption by Country (M Sq.m), 2027–2032
 Table 41. Asia Pacific Reflective Sheeting Consumption Growth Rate by Region: 2021 vs 2025 vs 2032 (M Sq.m)
 Table 42. Asia Pacific Reflective Sheeting Consumption by Region (M Sq.m), 2021–2026
 Table 43. Asia Pacific Reflective Sheeting Consumption by Region (M Sq.m), 2027–2032
 Table 44. Latin America, Middle East & Africa Reflective Sheeting Consumption Growth Rate by Country: 2021 vs 2025 vs 2032 (M Sq.m)
 Table 45. Latin America, Middle East & Africa Reflective Sheeting Consumption by Country (M Sq.m), 2021–2026
 Table 46. Latin America, Middle East & Africa Reflective Sheeting Consumption by Country (M Sq.m), 2027–2032
 Table 47. Global Reflective Sheeting Production (M Sq.m) by Technology (2021–2026)
 Table 48. Global Reflective Sheeting Production (M Sq.m) by Technology (2027–2032)
 Table 49. Global Reflective Sheeting Production Market Share by Technology (2021–2026)
 Table 50. Global Reflective Sheeting Production Market Share by Technology (2027–2032)
 Table 51. Global Reflective Sheeting Production Value (US$ Million) by Technology (2021–2026)
 Table 52. Global Reflective Sheeting Production Value (US$ Million) by Technology (2027–2032)
 Table 53. Global Reflective Sheeting Production Value Market Share by Technology (2021–2026)
 Table 54. Global Reflective Sheeting Production Value Market Share by Technology (2027–2032)
 Table 55. Global Reflective Sheeting Price (USD/Sq.m) by Technology (2021–2026)
 Table 56. Global Reflective Sheeting Price (USD/Sq.m) by Technology (2027–2032)
 Table 57. Global Reflective Sheeting Production (M Sq.m) by Application (2021–2026)
 Table 58. Global Reflective Sheeting Production (M Sq.m) by Application (2027–2032)
 Table 59. Global Reflective Sheeting Production Market Share by Application (2021–2026)
 Table 60. Global Reflective Sheeting Production Market Share by Application (2027–2032)
 Table 61. Global Reflective Sheeting Production Value (US$ Million) by Application (2021–2026)
 Table 62. Global Reflective Sheeting Production Value (US$ Million) by Application (2027–2032)
 Table 63. Global Reflective Sheeting Production Value Market Share by Application (2021–2026)
 Table 64. Global Reflective Sheeting Production Value Market Share by Application (2027–2032)
 Table 65. Global Reflective Sheeting Price (USD/Sq.m) by Application (2021–2026)
 Table 66. Global Reflective Sheeting Price (USD/Sq.m) by Application (2027–2032)
 Table 67. 3M Company Reflective Sheeting Company Information
 Table 68. 3M Company Reflective Sheeting Specification and Application
 Table 69. 3M Company Reflective Sheeting Production (M Sq.m), Value (US$ Million), Price (USD/Sq.m) and Gross Margin (2021–2026)
 Table 70. 3M Company Main Business and Markets Served
 Table 71. 3M Company Recent Developments/Updates
 Table 72. Avery Dennison Corporation Reflective Sheeting Company Information
 Table 73. Avery Dennison Corporation Reflective Sheeting Specification and Application
 Table 74. Avery Dennison Corporation Reflective Sheeting Production (M Sq.m), Value (US$ Million), Price (USD/Sq.m) and Gross Margin (2021–2026)
 Table 75. Avery Dennison Corporation Main Business and Markets Served
 Table 76. Avery Dennison Corporation Recent Developments/Updates
 Table 77. ORAFOL Europe GmbH Reflective Sheeting Company Information
 Table 78. ORAFOL Europe GmbH Reflective Sheeting Specification and Application
 Table 79. ORAFOL Europe GmbH Reflective Sheeting Production (M Sq.m), Value (US$ Million), Price (USD/Sq.m) and Gross Margin (2021–2026)
 Table 80. ORAFOL Europe GmbH Main Business and Markets Served
 Table 81. ORAFOL Europe GmbH Recent Developments/Updates
 Table 82. Nippon Carbide Industries Co., Inc. Reflective Sheeting Company Information
 Table 83. Nippon Carbide Industries Co., Inc. Reflective Sheeting Specification and Application
 Table 84. Nippon Carbide Industries Co., Inc. Reflective Sheeting Production (M Sq.m), Value (US$ Million), Price (USD/Sq.m) and Gross Margin (2021–2026)
 Table 85. Nippon Carbide Industries Co., Inc. Main Business and Markets Served
 Table 86. Nippon Carbide Industries Co., Inc. Recent Developments/Updates
 Table 87. Daoming Optics & Chemical Co., Ltd. Reflective Sheeting Company Information
 Table 88. Daoming Optics & Chemical Co., Ltd. Reflective Sheeting Specification and Application
 Table 89. Daoming Optics & Chemical Co., Ltd. Reflective Sheeting Production (M Sq.m), Value (US$ Million), Price (USD/Sq.m) and Gross Margin (2021–2026)
 Table 90. Daoming Optics & Chemical Co., Ltd. Main Business and Markets Served
 Table 91. Daoming Optics & Chemical Co., Ltd. Recent Developments/Updates
 Table 92. Jinsung Corporation Reflective Sheeting Company Information
 Table 93. Jinsung Corporation Reflective Sheeting Specification and Application
 Table 94. Jinsung Corporation Reflective Sheeting Production (M Sq.m), Value (US$ Million), Price (USD/Sq.m) and Gross Margin (2021–2026)
 Table 95. Jinsung Corporation Main Business and Markets Served
 Table 96. Jinsung Corporation Recent Developments/Updates
 Table 97. Viz Reflectives Ltd. Reflective Sheeting Company Information
 Table 98. Viz Reflectives Ltd. Reflective Sheeting Specification and Application
 Table 99. Viz Reflectives Ltd. Reflective Sheeting Production (M Sq.m), Value (US$ Million), Price (USD/Sq.m) and Gross Margin (2021–2026)
 Table 100. Viz Reflectives Ltd. Main Business and Markets Served
 Table 101. Viz Reflectives Ltd. Recent Developments/Updates
 Table 102. ATSM Reflective Sheeting Company Information
 Table 103. ATSM Reflective Sheeting Specification and Application
 Table 104. ATSM Reflective Sheeting Production (M Sq.m), Value (US$ Million), Price (USD/Sq.m) and Gross Margin (2021–2026)
 Table 105. ATSM Main Business and Markets Served
 Table 106. ATSM Recent Developments/Updates
 Table 107. STAR-REFLEX Reflective Sheeting Company Information
 Table 108. STAR-REFLEX Reflective Sheeting Specification and Application
 Table 109. STAR-REFLEX Reflective Sheeting Production (M Sq.m), Value (US$ Million), Price (USD/Sq.m) and Gross Margin (2021–2026)
 Table 110. STAR-REFLEX Main Business and Markets Served
 Table 111. STAR-REFLEX Recent Developments/Updates
 Table 112. Viz Reflectives Reflective Sheeting Company Information
 Table 113. Viz Reflectives Reflective Sheeting Specification and Application
 Table 114. Viz Reflectives Reflective Sheeting Production (M Sq.m), Value (US$ Million), Price (USD/Sq.m) and Gross Margin (2021–2026)
 Table 115. Viz Reflectives Main Business and Markets Served
 Table 116. Viz Reflectives Recent Developments/Updates
 Table 117. MN Tech Global Reflective Sheeting Company Information
 Table 118. MN Tech Global Reflective Sheeting Specification and Application
 Table 119. MN Tech Global Reflective Sheeting Production (M Sq.m), Value (US$ Million), Price (USD/Sq.m) and Gross Margin (2021–2026)
 Table 120. MN Tech Global Main Business and Markets Served
 Table 121. MN Tech Global Recent Developments/Updates
 Table 122. Changzhou Hua R Sheng Reflective Material Co., Ltd. Reflective Sheeting Company Information
 Table 123. Changzhou Hua R Sheng Reflective Material Co., Ltd. Reflective Sheeting Specification and Application
 Table 124. Changzhou Hua R Sheng Reflective Material Co., Ltd. Reflective Sheeting Production (M Sq.m), Value (US$ Million), Price (USD/Sq.m) and Gross Margin (2021–2026)
 Table 125. Changzhou Hua R Sheng Reflective Material Co., Ltd. Main Business and Markets Served
 Table 126. Changzhou Hua R Sheng Reflective Material Co., Ltd. Recent Developments/Updates
 Table 127. Yeshili / YSL Reflective Sheeting Company Information
 Table 128. Yeshili / YSL Reflective Sheeting Specification and Application
 Table 129. Yeshili / YSL Reflective Sheeting Production (M Sq.m), Value (US$ Million), Price (USD/Sq.m) and Gross Margin (2021–2026)
 Table 130. Yeshili / YSL Main Business and Markets Served
 Table 131. Yeshili / YSL Recent Developments/Updates
 Table 132. Huangshan Xingwei Reflective Material Co., Ltd. (XW Reflective) Reflective Sheeting Company Information
 Table 133. Huangshan Xingwei Reflective Material Co., Ltd. (XW Reflective) Reflective Sheeting Specification and Application
 Table 134. Huangshan Xingwei Reflective Material Co., Ltd. (XW Reflective) Reflective Sheeting Production (M Sq.m), Value (US$ Million), Price (USD/Sq.m) and Gross Margin (2021–2026)
 Table 135. Huangshan Xingwei Reflective Material Co., Ltd. (XW Reflective) Main Business and Markets Served
 Table 136. Huangshan Xingwei Reflective Material Co., Ltd. (XW Reflective) Recent Developments/Updates
 Table 137. Anhui Alsafety Reflective Material Co., Ltd. Reflective Sheeting Company Information
 Table 138. Anhui Alsafety Reflective Material Co., Ltd. Reflective Sheeting Specification and Application
 Table 139. Anhui Alsafety Reflective Material Co., Ltd. Reflective Sheeting Production (M Sq.m), Value (US$ Million), Price (USD/Sq.m) and Gross Margin (2021–2026)
 Table 140. Anhui Alsafety Reflective Material Co., Ltd. Main Business and Markets Served
 Table 141. Anhui Alsafety Reflective Material Co., Ltd. Recent Developments/Updates
 Table 142. Anhui Alsafety Reflective Material Co., Ltd. Reflective Sheeting Company Information
 Table 143. Anhui Alsafety Reflective Material Co., Ltd. Reflective Sheeting Specification and Application
 Table 144. Anhui Alsafety Reflective Material Co., Ltd. Reflective Sheeting Production (M Sq.m), Value (US$ Million), Price (USD/Sq.m) and Gross Margin (2021–2026)
 Table 145. Anhui Alsafety Reflective Material Co., Ltd. Main Business and Markets Served
 Table 146. Anhui Alsafety Reflective Material Co., Ltd. Recent Developments/Updates
 Table 147. Key Raw Materials Lists
 Table 148. Raw Materials Key Suppliers Lists
 Table 149. Reflective Sheeting Distributors List
 Table 150. Reflective Sheeting Customers List
 Table 151. Reflective Sheeting Market Trends
 Table 152. Reflective Sheeting Market Drivers
 Table 153. Reflective Sheeting Market Challenges
 Table 154. Reflective Sheeting Market Restraints
 Table 155. Research Programs/Design for This Report
 Table 156. Key Data Information from Secondary Sources
 Table 157. Key Data Information from Primary Sources
 Table 158. Authors List of This Report


List of Figures
 Figure 1. Product Picture of Reflective Sheeting
 Figure 2. Global Reflective Sheeting Market Value by Technology (US$ Million), 2021–2032
 Figure 3. Global Reflective Sheeting Market Share by Technology: 2025 vs 2032
 Figure 4. Glass Bead Type Product Picture
 Figure 5. Micro Prismatic Type Product Picture
 Figure 6. Global Reflective Sheeting Market Value by Material (US$ Million), 2021–2032
 Figure 7. Global Reflective Sheeting Market Share by Material: 2025 vs 2032
 Figure 8. 丙烯酸(PMMA)面层反光膜 Product Picture
 Figure 9. 聚碳酸酯(PC)面层反光膜(耐磨型) Product Picture
 Figure 10. 聚氯乙烯(PVC)反光膜 Product Picture
 Figure 11. 聚酯(PET)反光膜(刻字/印刷基材常见) Product Picture
 Figure 12. 金属化反光膜 Product Picture
 Figure 13. 荧光颜料体系反光膜(荧光层) Product Picture
 Figure 14. Global Reflective Sheeting Market Value by Intensity (US$ Million), 2021–2032
 Figure 15. Global Reflective Sheeting Market Share by Intensity: 2025 vs 2032
 Figure 16. 钻石级 Product Picture
 Figure 17. 高强级 Product Picture
 Figure 18. 超强级 Product Picture
 Figure 19. 工程级 Product Picture
 Figure 20. 高级工程级 Product Picture
 Figure 21. Global Reflective Sheeting Market Value by Application (US$ Million), 2021–2032
 Figure 22. Global Reflective Sheeting Market Share by Application: 2025 vs 2032
 Figure 23. Permanent Traffic Signs (Road Traffic Signage)
 Figure 24. Work Zone & Temporary Traffic Control
 Figure 25. Vehicle Conspicuity Marking
 Figure 26. PPE & Safety Apparel (Hi-Vis)
 Figure 27. Industrial Safety & Facility Marking
 Figure 28. Commercial Graphics & Reflective Advertising
 Figure 29. Marine/Aviation/Specialty Navigation & Public Safety
 Figure 30. License Plate & Security Sheeting (Optional)
 Figure 31. Rail/Mining/Port Safety Marking (Optional)
 Figure 32. Global Reflective Sheeting Production Value (US$ Million), 2021 vs 2025 vs 2032
 Figure 33. Global Reflective Sheeting Production Value (US$ Million), 2021–2032
 Figure 34. Global Reflective Sheeting Production Capacity (M Sq.m), 2021–2032
 Figure 35. Global Reflective Sheeting Production (M Sq.m), 2021–2032
 Figure 36. Global Reflective Sheeting Average Price (USD/Sq.m), 2021–2032
 Figure 37. Reflective Sheeting Report Years Considered
 Figure 38. Reflective Sheeting Production Share by Manufacturers in 2025
 Figure 39. Global Reflective Sheeting Production Value Share by Manufacturers (2025)
 Figure 40. Reflective Sheeting Market Share by Company Type (Tier 1, Tier 2, and Tier 3): 2021 vs 2025
 Figure 41. Top 5 and Top 10 Global Players: Market Share by Reflective Sheeting Revenue in 2025
 Figure 42. Global Reflective Sheeting Production Value by Region: 2021 vs 2025 vs 2032 (US$ Million)
 Figure 43. Global Reflective Sheeting Production Value Market Share by Region: 2021 vs 2025 vs 2032
 Figure 44. Global Reflective Sheeting Production Comparison by Region: 2021 vs 2025 vs 2032 (M Sq.m)
 Figure 45. Global Reflective Sheeting Production Market Share by Region: 2021 vs 2025 vs 2032
 Figure 46. North America Reflective Sheeting Production Value (US$ Million) Growth Rate (2021–2032)
 Figure 47. Europe Reflective Sheeting Production Value (US$ Million) Growth Rate (2021–2032)
 Figure 48. China Reflective Sheeting Production Value (US$ Million) Growth Rate (2021–2032)
 Figure 49. Japan Reflective Sheeting Production Value (US$ Million) Growth Rate (2021–2032)
 Figure 50. South Korea Reflective Sheeting Production Value (US$ Million) Growth Rate (2021–2032)
 Figure 51. Global Reflective Sheeting Consumption by Region: 2021 vs 2025 vs 2032 (M Sq.m)
 Figure 52. Global Reflective Sheeting Consumption Market Share by Region: 2021 vs 2025 vs 2032
 Figure 53. North America Reflective Sheeting Consumption and Growth Rate (M Sq.m), 2021–2032
 Figure 54. North America Reflective Sheeting Consumption Market Share by Country (2021–2032)
 Figure 55. U.S. Reflective Sheeting Consumption and Growth Rate (M Sq.m), 2021–2032
 Figure 56. Canada Reflective Sheeting Consumption and Growth Rate (M Sq.m), 2021–2032
 Figure 57. Europe Reflective Sheeting Consumption and Growth Rate (M Sq.m), 2021–2032
 Figure 58. Europe Reflective Sheeting Consumption Market Share by Country (2021–2032)
 Figure 59. Germany Reflective Sheeting Consumption and Growth Rate (M Sq.m), 2021–2032
 Figure 60. France Reflective Sheeting Consumption and Growth Rate (M Sq.m), 2021–2032
 Figure 61. U.K. Reflective Sheeting Consumption and Growth Rate (M Sq.m), 2021–2032
 Figure 62. Italy Reflective Sheeting Consumption and Growth Rate (M Sq.m), 2021–2032
 Figure 63. Russia Reflective Sheeting Consumption and Growth Rate (M Sq.m), 2021–2032
 Figure 64. Asia Pacific Reflective Sheeting Consumption and Growth Rate (M Sq.m), 2021–2032
 Figure 65. Asia Pacific Reflective Sheeting Consumption Market Share by Region (2021–2032)
 Figure 66. China Reflective Sheeting Consumption and Growth Rate (M Sq.m), 2021–2032
 Figure 67. Japan Reflective Sheeting Consumption and Growth Rate (M Sq.m), 2021–2032
 Figure 68. South Korea Reflective Sheeting Consumption and Growth Rate (M Sq.m), 2021–2032
 Figure 69. China Taiwan Reflective Sheeting Consumption and Growth Rate (M Sq.m), 2021–2032
 Figure 70. Southeast Asia Reflective Sheeting Consumption and Growth Rate (M Sq.m), 2021–2032
 Figure 71. India Reflective Sheeting Consumption and Growth Rate (M Sq.m), 2021–2032
 Figure 72. Latin America, Middle East & Africa Reflective Sheeting Consumption and Growth Rate (M Sq.m), 2021–2032
 Figure 73. Latin America, Middle East & Africa Reflective Sheeting Consumption Market Share by Country (2021–2032)
 Figure 74. Mexico Reflective Sheeting Consumption and Growth Rate (M Sq.m), 2021–2032
 Figure 75. Brazil Reflective Sheeting Consumption and Growth Rate (M Sq.m), 2021–2032
 Figure 76. Turkey Reflective Sheeting Consumption and Growth Rate (M Sq.m), 2021–2032
 Figure 77. GCC Countries Reflective Sheeting Consumption and Growth Rate (M Sq.m), 2021–2032
 Figure 78. Global Production Market Share of Reflective Sheeting by Technology (2021–2032)
 Figure 79. Global Production Value Market Share of Reflective Sheeting by Technology (2021–2032)
 Figure 80. Global Reflective Sheeting Price (USD/Sq.m) by Technology (2021–2032)
 Figure 81. Global Production Market Share of Reflective Sheeting by Application (2021–2032)
 Figure 82. Global Production Value Market Share of Reflective Sheeting by Application (2021–2032)
 Figure 83. Global Reflective Sheeting Price (USD/Sq.m) by Application (2021–2032)
 Figure 84. Reflective Sheeting Value Chain
 Figure 85. Channels of Distribution (Direct Vs Distribution)
 Figure 86. Bottom-up and Top-down Approaches for This Report
 Figure 87. Data Triangulation
SELECT A FORMAT
Added to Cart
Electronic

$2900

Single User License
Electronic

$4350

Multi User License
Electronic

$5800

Enterprise License
Add to Cart
Buy Now (15% Discount)

OUR CUSTOMER

SecuX Technology Inc