List of Tables
Table 1. Global Fuel-Driven Fixed Wing Unmanned Aerial Vehicles Market Value by Type, (US$ Million) & (2023 VS 2030)
Table 2. Global Fuel-Driven Fixed Wing Unmanned Aerial Vehicles Market Value by Application, (US$ Million) & (2023 VS 2030)
Table 3. Global Fuel-Driven Fixed Wing Unmanned Aerial Vehicles Production Capacity (K Units) by Manufacturers in 2023
Table 4. Global Fuel-Driven Fixed Wing Unmanned Aerial Vehicles Production by Manufacturers (2019-2024) & (K Units)
Table 5. Global Fuel-Driven Fixed Wing Unmanned Aerial Vehicles Production Market Share by Manufacturers (2019-2024)
Table 6. Global Fuel-Driven Fixed Wing Unmanned Aerial Vehicles Production Value by Manufacturers (2019-2024) & (US$ Million)
Table 7. Global Fuel-Driven Fixed Wing Unmanned Aerial Vehicles Production Value Share by Manufacturers (2019-2024)
Table 8. Global Fuel-Driven Fixed Wing Unmanned Aerial Vehicles Industry Ranking 2022 VS 2023 VS 2024
Table 9. Company Type (Tier 1, Tier 2 and Tier 3) & (based on the Revenue in Fuel-Driven Fixed Wing Unmanned Aerial Vehicles as of 2023)
Table 10. Global Market Fuel-Driven Fixed Wing Unmanned Aerial Vehicles Average Price by Manufacturers (US$/Unit) & (2019-2024)
Table 11. Manufacturers Fuel-Driven Fixed Wing Unmanned Aerial Vehicles Production Sites and Area Served
Table 12. Manufacturers Fuel-Driven Fixed Wing Unmanned Aerial Vehicles Product Types
Table 13. Global Fuel-Driven Fixed Wing Unmanned Aerial Vehicles Manufacturers Market Concentration Ratio (CR5 and HHI)
Table 14. Mergers & Acquisitions, Expansion
Table 15. Global Fuel-Driven Fixed Wing Unmanned Aerial Vehicles Production Value by Region: 2019 VS 2023 VS 2030 (US$ Million)
Table 16. Global Fuel-Driven Fixed Wing Unmanned Aerial Vehicles Production Value (US$ Million) by Region (2019-2024)
Table 17. Global Fuel-Driven Fixed Wing Unmanned Aerial Vehicles Production Value Market Share by Region (2019-2024)
Table 18. Global Fuel-Driven Fixed Wing Unmanned Aerial Vehicles Production Value (US$ Million) Forecast by Region (2025-2030)
Table 19. Global Fuel-Driven Fixed Wing Unmanned Aerial Vehicles Production Value Market Share Forecast by Region (2025-2030)
Table 20. Global Fuel-Driven Fixed Wing Unmanned Aerial Vehicles Production Comparison by Region: 2019 VS 2023 VS 2030 (K Units)
Table 21. Global Fuel-Driven Fixed Wing Unmanned Aerial Vehicles Production (K Units) by Region (2019-2024)
Table 22. Global Fuel-Driven Fixed Wing Unmanned Aerial Vehicles Production Market Share by Region (2019-2024)
Table 23. Global Fuel-Driven Fixed Wing Unmanned Aerial Vehicles Production (K Units) Forecast by Region (2025-2030)
Table 24. Global Fuel-Driven Fixed Wing Unmanned Aerial Vehicles Production Market Share Forecast by Region (2025-2030)
Table 25. Global Fuel-Driven Fixed Wing Unmanned Aerial Vehicles Market Average Price (US$/Unit) by Region (2019-2024)
Table 26. Global Fuel-Driven Fixed Wing Unmanned Aerial Vehicles Market Average Price (US$/Unit) by Region (2025-2030)
Table 27. Global Fuel-Driven Fixed Wing Unmanned Aerial Vehicles Consumption Growth Rate by Region: 2019 VS 2023 VS 2030 (K Units)
Table 28. Global Fuel-Driven Fixed Wing Unmanned Aerial Vehicles Consumption by Region (2019-2024) & (K Units)
Table 29. Global Fuel-Driven Fixed Wing Unmanned Aerial Vehicles Consumption Market Share by Region (2019-2024)
Table 30. Global Fuel-Driven Fixed Wing Unmanned Aerial Vehicles Forecasted Consumption by Region (2025-2030) & (K Units)
Table 31. Global Fuel-Driven Fixed Wing Unmanned Aerial Vehicles Forecasted Consumption Market Share by Region (2019-2024)
Table 32. North America Fuel-Driven Fixed Wing Unmanned Aerial Vehicles Consumption Growth Rate by Country: 2019 VS 2023 VS 2030 (K Units)
Table 33. North America Fuel-Driven Fixed Wing Unmanned Aerial Vehicles Consumption by Country (2019-2024) & (K Units)
Table 34. North America Fuel-Driven Fixed Wing Unmanned Aerial Vehicles Consumption by Country (2025-2030) & (K Units)
Table 35. Europe Fuel-Driven Fixed Wing Unmanned Aerial Vehicles Consumption Growth Rate by Country: 2019 VS 2023 VS 2030 (K Units)
Table 36. Europe Fuel-Driven Fixed Wing Unmanned Aerial Vehicles Consumption by Country (2019-2024) & (K Units)
Table 37. Europe Fuel-Driven Fixed Wing Unmanned Aerial Vehicles Consumption by Country (2025-2030) & (K Units)
Table 38. Asia Pacific Fuel-Driven Fixed Wing Unmanned Aerial Vehicles Consumption Growth Rate by Region: 2019 VS 2023 VS 2030 (K Units)
Table 39. Asia Pacific Fuel-Driven Fixed Wing Unmanned Aerial Vehicles Consumption by Region (2019-2024) & (K Units)
Table 40. Asia Pacific Fuel-Driven Fixed Wing Unmanned Aerial Vehicles Consumption by Region (2025-2030) & (K Units)
Table 41. Latin America, Middle East & Africa Fuel-Driven Fixed Wing Unmanned Aerial Vehicles Consumption Growth Rate by Country: 2019 VS 2023 VS 2030 (K Units)
Table 42. Latin America, Middle East & Africa Fuel-Driven Fixed Wing Unmanned Aerial Vehicles Consumption by Country (2019-2024) & (K Units)
Table 43. Latin America, Middle East & Africa Fuel-Driven Fixed Wing Unmanned Aerial Vehicles Consumption by Country (2025-2030) & (K Units)
Table 44. Global Fuel-Driven Fixed Wing Unmanned Aerial Vehicles Production (K Units) by Type (2019-2024)
Table 45. Global Fuel-Driven Fixed Wing Unmanned Aerial Vehicles Production (K Units) by Type (2025-2030)
Table 46. Global Fuel-Driven Fixed Wing Unmanned Aerial Vehicles Production Market Share by Type (2019-2024)
Table 47. Global Fuel-Driven Fixed Wing Unmanned Aerial Vehicles Production Market Share by Type (2025-2030)
Table 48. Global Fuel-Driven Fixed Wing Unmanned Aerial Vehicles Production Value (US$ Million) by Type (2019-2024)
Table 49. Global Fuel-Driven Fixed Wing Unmanned Aerial Vehicles Production Value (US$ Million) by Type (2025-2030)
Table 50. Global Fuel-Driven Fixed Wing Unmanned Aerial Vehicles Production Value Share by Type (2019-2024)
Table 51. Global Fuel-Driven Fixed Wing Unmanned Aerial Vehicles Production Value Share by Type (2025-2030)
Table 52. Global Fuel-Driven Fixed Wing Unmanned Aerial Vehicles Price (US$/Unit) by Type (2019-2024)
Table 53. Global Fuel-Driven Fixed Wing Unmanned Aerial Vehicles Price (US$/Unit) by Type (2025-2030)
Table 54. Global Fuel-Driven Fixed Wing Unmanned Aerial Vehicles Production (K Units) by Application (2019-2024)
Table 55. Global Fuel-Driven Fixed Wing Unmanned Aerial Vehicles Production (K Units) by Application (2025-2030)
Table 56. Global Fuel-Driven Fixed Wing Unmanned Aerial Vehicles Production Market Share by Application (2019-2024)
Table 57. Global Fuel-Driven Fixed Wing Unmanned Aerial Vehicles Production Market Share by Application (2025-2030)
Table 58. Global Fuel-Driven Fixed Wing Unmanned Aerial Vehicles Production Value (US$ Million) by Application (2019-2024)
Table 59. Global Fuel-Driven Fixed Wing Unmanned Aerial Vehicles Production Value (US$ Million) by Application (2025-2030)
Table 60. Global Fuel-Driven Fixed Wing Unmanned Aerial Vehicles Production Value Share by Application (2019-2024)
Table 61. Global Fuel-Driven Fixed Wing Unmanned Aerial Vehicles Production Value Share by Application (2025-2030)
Table 62. Global Fuel-Driven Fixed Wing Unmanned Aerial Vehicles Price (US$/Unit) by Application (2019-2024)
Table 63. Global Fuel-Driven Fixed Wing Unmanned Aerial Vehicles Price (US$/Unit) by Application (2025-2030)
Table 64. General Atomics Fuel-Driven Fixed Wing Unmanned Aerial Vehicles Corporation Information
Table 65. General Atomics Specification and Application
Table 66. General Atomics Fuel-Driven Fixed Wing Unmanned Aerial Vehicles Production (K Units), Value (US$ Million), Price (US$/Unit) and Gross Margin (2019-2024)
Table 67. General Atomics Main Business and Markets Served
Table 68. General Atomics Recent Developments/Updates
Table 69. Northrop Grumman Fuel-Driven Fixed Wing Unmanned Aerial Vehicles Corporation Information
Table 70. Northrop Grumman Specification and Application
Table 71. Northrop Grumman Fuel-Driven Fixed Wing Unmanned Aerial Vehicles Production (K Units), Value (US$ Million), Price (US$/Unit) and Gross Margin (2019-2024)
Table 72. Northrop Grumman Main Business and Markets Served
Table 73. Northrop Grumman Recent Developments/Updates
Table 74. AeroVironment Fuel-Driven Fixed Wing Unmanned Aerial Vehicles Corporation Information
Table 75. AeroVironment Specification and Application
Table 76. AeroVironment Fuel-Driven Fixed Wing Unmanned Aerial Vehicles Production (K Units), Value (US$ Million), Price (US$/Unit) and Gross Margin (2019-2024)
Table 77. AeroVironment Main Business and Markets Served
Table 78. AeroVironment Recent Developments/Updates
Table 79. Insitu Fuel-Driven Fixed Wing Unmanned Aerial Vehicles Corporation Information
Table 80. Insitu Specification and Application
Table 81. Insitu Fuel-Driven Fixed Wing Unmanned Aerial Vehicles Production (K Units), Value (US$ Million), Price (US$/Unit) and Gross Margin (2019-2024)
Table 82. Insitu Main Business and Markets Served
Table 83. Insitu Recent Developments/Updates
Table 84. AVIC Fuel-Driven Fixed Wing Unmanned Aerial Vehicles Corporation Information
Table 85. AVIC Specification and Application
Table 86. AVIC Fuel-Driven Fixed Wing Unmanned Aerial Vehicles Production (K Units), Value (US$ Million), Price (US$/Unit) and Gross Margin (2019-2024)
Table 87. AVIC Main Business and Markets Served
Table 88. AVIC Recent Developments/Updates
Table 89. Lockheed Martin Fuel-Driven Fixed Wing Unmanned Aerial Vehicles Corporation Information
Table 90. Lockheed Martin Specification and Application
Table 91. Lockheed Martin Fuel-Driven Fixed Wing Unmanned Aerial Vehicles Production (K Units), Value (US$ Million), Price (US$/Unit) and Gross Margin (2019-2024)
Table 92. Lockheed Martin Main Business and Markets Served
Table 93. Lockheed Martin Recent Developments/Updates
Table 94. JOUAV Fuel-Driven Fixed Wing Unmanned Aerial Vehicles Corporation Information
Table 95. JOUAV Specification and Application
Table 96. JOUAV Fuel-Driven Fixed Wing Unmanned Aerial Vehicles Production (K Units), Value (US$ Million), Price (US$/Unit) and Gross Margin (2019-2024)
Table 97. JOUAV Main Business and Markets Served
Table 98. JOUAV Recent Developments/Updates
Table 99. Aerospace CH UAV(CASC) Fuel-Driven Fixed Wing Unmanned Aerial Vehicles Corporation Information
Table 100. Aerospace CH UAV(CASC) Specification and Application
Table 101. Aerospace CH UAV(CASC) Fuel-Driven Fixed Wing Unmanned Aerial Vehicles Production (K Units), Value (US$ Million), Price (US$/Unit) and Gross Margin (2019-2024)
Table 102. Aerospace CH UAV(CASC) Main Business and Markets Served
Table 103. Aerospace CH UAV(CASC) Recent Developments/Updates
Table 104. Edge Autonomy Fuel-Driven Fixed Wing Unmanned Aerial Vehicles Corporation Information
Table 105. Edge Autonomy Specification and Application
Table 106. Edge Autonomy Fuel-Driven Fixed Wing Unmanned Aerial Vehicles Production (K Units), Value (US$ Million), Price (US$/Unit) and Gross Margin (2019-2024)
Table 107. Edge Autonomy Main Business and Markets Served
Table 108. Edge Autonomy Recent Developments/Updates
Table 109. Beijing Beihang Tianyu Changying UAV Technology Fuel-Driven Fixed Wing Unmanned Aerial Vehicles Corporation Information
Table 110. Beijing Beihang Tianyu Changying UAV Technology Specification and Application
Table 111. Beijing Beihang Tianyu Changying UAV Technology Fuel-Driven Fixed Wing Unmanned Aerial Vehicles Production (K Units), Value (US$ Million), Price (US$/Unit) and Gross Margin (2019-2024)
Table 112. Beijing Beihang Tianyu Changying UAV Technology Main Business and Markets Served
Table 113. Beijing Beihang Tianyu Changying UAV Technology Recent Developments/Updates
Table 114. Skycam Defense Technology Fuel-Driven Fixed Wing Unmanned Aerial Vehicles Corporation Information
Table 115. Skycam Defense Technology Specification and Application
Table 116. Skycam Defense Technology Fuel-Driven Fixed Wing Unmanned Aerial Vehicles Production (K Units), Value (US$ Million), Price (US$/Unit) and Gross Margin (2019-2024)
Table 117. Skycam Defense Technology Main Business and Markets Served
Table 118. Skycam Defense Technology Recent Developments/Updates
Table 119. Delair Fuel-Driven Fixed Wing Unmanned Aerial Vehicles Corporation Information
Table 120. Delair Specification and Application
Table 121. Delair Fuel-Driven Fixed Wing Unmanned Aerial Vehicles Production (K Units), Value (US$ Million), Price (US$/Unit) and Gross Margin (2019-2024)
Table 122. Delair Main Business and Markets Served
Table 123. Delair Recent Developments/Updates
Table 124. senseFly Fuel-Driven Fixed Wing Unmanned Aerial Vehicles Corporation Information
Table 125. senseFly Specification and Application
Table 126. senseFly Fuel-Driven Fixed Wing Unmanned Aerial Vehicles Production (K Units), Value (US$ Million), Price (US$/Unit) and Gross Margin (2019-2024)
Table 127. senseFly Main Business and Markets Served
Table 128. senseFly Recent Developments/Updates
Table 129. BlueBird Aero Systems Fuel-Driven Fixed Wing Unmanned Aerial Vehicles Corporation Information
Table 130. BlueBird Aero Systems Specification and Application
Table 131. BlueBird Aero Systems Fuel-Driven Fixed Wing Unmanned Aerial Vehicles Production (K Units), Value (US$ Million), Price (US$/Unit) and Gross Margin (2019-2024)
Table 132. BlueBird Aero Systems Main Business and Markets Served
Table 133. BlueBird Aero Systems Recent Developments/Updates
Table 134. BlueBird Aero Systems Fuel-Driven Fixed Wing Unmanned Aerial Vehicles Corporation Information
Table 135. Wingtra AG Specification and Application
Table 136. Wingtra AG Fuel-Driven Fixed Wing Unmanned Aerial Vehicles Production (K Units), Value (US$ Million), Price (US$/Unit) and Gross Margin (2019-2024)
Table 137. Wingtra AG Main Business and Markets Served
Table 138. Wingtra AG Recent Developments/Updates
Table 139. Quantum-Systems Fuel-Driven Fixed Wing Unmanned Aerial Vehicles Corporation Information
Table 140. Quantum-Systems Fuel-Driven Fixed Wing Unmanned Aerial Vehicles Production (K Units), Value (US$ Million), Price (US$/Unit) and Gross Margin (2019-2024)
Table 141. Quantum-Systems Main Business and Markets Served
Table 142. Quantum-Systems Recent Developments/Updates
Table 143. Atmos UAV Fuel-Driven Fixed Wing Unmanned Aerial Vehicles Corporation Information
Table 144. Atmos UAV Specification and Application
Table 145. Atmos UAV Fuel-Driven Fixed Wing Unmanned Aerial Vehicles Production (K Units), Value (US$ Million), Price (US$/Unit) and Gross Margin (2019-2024)
Table 146. Atmos UAV Main Business and Markets Served
Table 147. Atmos UAV Recent Developments/Updates
Table 148. DeltaQuad Fuel-Driven Fixed Wing Unmanned Aerial Vehicles Corporation Information
Table 149. DeltaQuad Specification and Application
Table 150. DeltaQuad Fuel-Driven Fixed Wing Unmanned Aerial Vehicles Production (K Units), Value (US$ Million), Price (US$/Unit) and Gross Margin (2019-2024)
Table 151. DeltaQuad Main Business and Markets Served
Table 152. DeltaQuad Recent Developments/Updates
Table 153. SURVEY Copter Fuel-Driven Fixed Wing Unmanned Aerial Vehicles Corporation Information
Table 154. SURVEY Copter Specification and Application
Table 155. SURVEY Copter Fuel-Driven Fixed Wing Unmanned Aerial Vehicles Production (K Units), Value (US$ Million), Price (US$/Unit) and Gross Margin (2019-2024)
Table 156. SURVEY Copter Main Business and Markets Served
Table 157. SURVEY Copter Recent Developments/Updates
Table 158. Hitec Commercial Solutions Fuel-Driven Fixed Wing Unmanned Aerial Vehicles Corporation Information
Table 159. Hitec Commercial Solutions Specification and Application
Table 160. Hitec Commercial Solutions Fuel-Driven Fixed Wing Unmanned Aerial Vehicles Production (K Units), Value (US$ Million), Price (US$/Unit) and Gross Margin (2019-2024)
Table 161. Hitec Commercial Solutions Main Business and Markets Served
Table 162. Hitec Commercial Solutions Recent Developments/Updates
Table 163. Key Raw Materials Lists
Table 164. Raw Materials Key Suppliers Lists
Table 165. Fuel-Driven Fixed Wing Unmanned Aerial Vehicles Distributors List
Table 166. Fuel-Driven Fixed Wing Unmanned Aerial Vehicles Customers List
Table 167. Fuel-Driven Fixed Wing Unmanned Aerial Vehicles Market Trends
Table 168. Fuel-Driven Fixed Wing Unmanned Aerial Vehicles Market Drivers
Table 169. Fuel-Driven Fixed Wing Unmanned Aerial Vehicles Market Challenges
Table 170. Fuel-Driven Fixed Wing Unmanned Aerial Vehicles Market Restraints
Table 171. Research Programs/Design for This Report
Table 172. Key Data Information from Secondary Sources
Table 173. Key Data Information from Primary Sources
List of Figures
Figure 1. Product Picture of Fuel-Driven Fixed Wing Unmanned Aerial Vehicles
Figure 2. Global Fuel-Driven Fixed Wing Unmanned Aerial Vehicles Market Value by Type, (US$ Million) & (2023 VS 2030)
Figure 3. Global Fuel-Driven Fixed Wing Unmanned Aerial Vehicles Market Share by Type: 2023 VS 2030
Figure 4. Small UAV Product Picture
Figure 5. Medium UAV Product Picture
Figure 6. Large UAV Product Picture
Figure 7. Global Fuel-Driven Fixed Wing Unmanned Aerial Vehicles Market Value by Application, (US$ Million) & (2023 VS 2030)
Figure 8. Global Fuel-Driven Fixed Wing Unmanned Aerial Vehicles Market Share by Application: 2023 VS 2030
Figure 9. Military Use
Figure 10. Civil Use
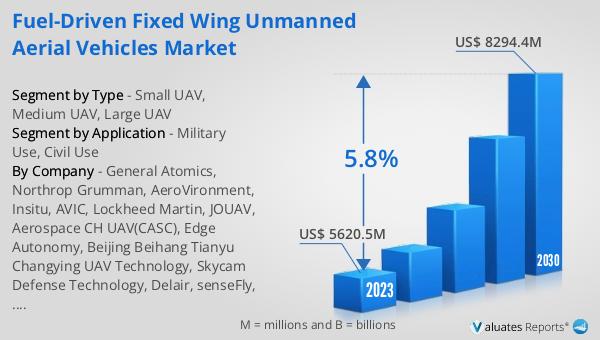
Figure 11. Global Fuel-Driven Fixed Wing Unmanned Aerial Vehicles Production Value (US$ Million), 2019 VS 2023 VS 2030
Figure 12. Global Fuel-Driven Fixed Wing Unmanned Aerial Vehicles Production Value (US$ Million) & (2019-2030)
Figure 13. Global Fuel-Driven Fixed Wing Unmanned Aerial Vehicles Production (K Units) & (2019-2030)
Figure 14. Global Fuel-Driven Fixed Wing Unmanned Aerial Vehicles Average Price (US$/Unit) & (2019-2030)
Figure 15. Fuel-Driven Fixed Wing Unmanned Aerial Vehicles Report Years Considered
Figure 16. Fuel-Driven Fixed Wing Unmanned Aerial Vehicles Production Share by Manufacturers in 2023
Figure 17. Fuel-Driven Fixed Wing Unmanned Aerial Vehicles Market Share by Company Type (Tier 1, Tier 2, and Tier 3): 2019 VS 2023
Figure 18. The Global 5 and 10 Largest Players: Market Share by Fuel-Driven Fixed Wing Unmanned Aerial Vehicles Revenue in 2023
Figure 19. Global Fuel-Driven Fixed Wing Unmanned Aerial Vehicles Production Value by Region: 2019 VS 2023 VS 2030 (US$ Million)
Figure 20. Global Fuel-Driven Fixed Wing Unmanned Aerial Vehicles Production Value Market Share by Region: 2019 VS 2023 VS 2030
Figure 21. Global Fuel-Driven Fixed Wing Unmanned Aerial Vehicles Production Comparison by Region: 2019 VS 2023 VS 2030 (K Units)
Figure 22. Global Fuel-Driven Fixed Wing Unmanned Aerial Vehicles Production Market Share by Region: 2019 VS 2023 VS 2030
Figure 23. North America Fuel-Driven Fixed Wing Unmanned Aerial Vehicles Production Value (US$ Million) Growth Rate (2019-2030)
Figure 24. Europe Fuel-Driven Fixed Wing Unmanned Aerial Vehicles Production Value (US$ Million) Growth Rate (2019-2030)
Figure 25. China Fuel-Driven Fixed Wing Unmanned Aerial Vehicles Production Value (US$ Million) Growth Rate (2019-2030)
Figure 26. Japan Fuel-Driven Fixed Wing Unmanned Aerial Vehicles Production Value (US$ Million) Growth Rate (2019-2030)
Figure 27. Global Fuel-Driven Fixed Wing Unmanned Aerial Vehicles Consumption by Region: 2019 VS 2023 VS 2030 (K Units)
Figure 28. Global Fuel-Driven Fixed Wing Unmanned Aerial Vehicles Consumption Market Share by Region: 2019 VS 2023 VS 2030
Figure 29. North America Fuel-Driven Fixed Wing Unmanned Aerial Vehicles Consumption and Growth Rate (2019-2024) & (K Units)
Figure 30. North America Fuel-Driven Fixed Wing Unmanned Aerial Vehicles Consumption Market Share by Country (2019-2030)
Figure 31. Canada Fuel-Driven Fixed Wing Unmanned Aerial Vehicles Consumption and Growth Rate (2019-2024) & (K Units)
Figure 32. U.S. Fuel-Driven Fixed Wing Unmanned Aerial Vehicles Consumption and Growth Rate (2019-2024) & (K Units)
Figure 33. Europe Fuel-Driven Fixed Wing Unmanned Aerial Vehicles Consumption and Growth Rate (2019-2024) & (K Units)
Figure 34. Europe Fuel-Driven Fixed Wing Unmanned Aerial Vehicles Consumption Market Share by Country (2019-2030)
Figure 35. Germany Fuel-Driven Fixed Wing Unmanned Aerial Vehicles Consumption and Growth Rate (2019-2024) & (K Units)
Figure 36. France Fuel-Driven Fixed Wing Unmanned Aerial Vehicles Consumption and Growth Rate (2019-2024) & (K Units)
Figure 37. U.K. Fuel-Driven Fixed Wing Unmanned Aerial Vehicles Consumption and Growth Rate (2019-2024) & (K Units)
Figure 38. Italy Fuel-Driven Fixed Wing Unmanned Aerial Vehicles Consumption and Growth Rate (2019-2024) & (K Units)
Figure 39. Russia Fuel-Driven Fixed Wing Unmanned Aerial Vehicles Consumption and Growth Rate (2019-2024) & (K Units)
Figure 40. Asia Pacific Fuel-Driven Fixed Wing Unmanned Aerial Vehicles Consumption and Growth Rate (2019-2024) & (K Units)
Figure 41. Asia Pacific Fuel-Driven Fixed Wing Unmanned Aerial Vehicles Consumption Market Share by Regions (2019-2030)
Figure 42. China Fuel-Driven Fixed Wing Unmanned Aerial Vehicles Consumption and Growth Rate (2019-2024) & (K Units)
Figure 43. Japan Fuel-Driven Fixed Wing Unmanned Aerial Vehicles Consumption and Growth Rate (2019-2024) & (K Units)
Figure 44. South Korea Fuel-Driven Fixed Wing Unmanned Aerial Vehicles Consumption and Growth Rate (2019-2024) & (K Units)
Figure 45. China Taiwan Fuel-Driven Fixed Wing Unmanned Aerial Vehicles Consumption and Growth Rate (2019-2024) & (K Units)
Figure 46. Southeast Asia Fuel-Driven Fixed Wing Unmanned Aerial Vehicles Consumption and Growth Rate (2019-2024) & (K Units)
Figure 47. India Fuel-Driven Fixed Wing Unmanned Aerial Vehicles Consumption and Growth Rate (2019-2024) & (K Units)
Figure 48. Latin America, Middle East & Africa Fuel-Driven Fixed Wing Unmanned Aerial Vehicles Consumption and Growth Rate (2019-2024) & (K Units)
Figure 49. Latin America, Middle East & Africa Fuel-Driven Fixed Wing Unmanned Aerial Vehicles Consumption Market Share by Country (2019-2030)
Figure 50. Mexico Fuel-Driven Fixed Wing Unmanned Aerial Vehicles Consumption and Growth Rate (2019-2024) & (K Units)
Figure 51. Brazil Fuel-Driven Fixed Wing Unmanned Aerial Vehicles Consumption and Growth Rate (2019-2024) & (K Units)
Figure 52. Turkey Fuel-Driven Fixed Wing Unmanned Aerial Vehicles Consumption and Growth Rate (2019-2024) & (K Units)
Figure 53. GCC Countries Fuel-Driven Fixed Wing Unmanned Aerial Vehicles Consumption and Growth Rate (2019-2024) & (K Units)
Figure 54. Global Production Market Share of Fuel-Driven Fixed Wing Unmanned Aerial Vehicles by Type (2019-2030)
Figure 55. Global Production Value Market Share of Fuel-Driven Fixed Wing Unmanned Aerial Vehicles by Type (2019-2030)
Figure 56. Global Fuel-Driven Fixed Wing Unmanned Aerial Vehicles Price (US$/Unit) by Type (2019-2030)
Figure 57. Global Production Market Share of Fuel-Driven Fixed Wing Unmanned Aerial Vehicles by Application (2019-2030)
Figure 58. Global Production Value Market Share of Fuel-Driven Fixed Wing Unmanned Aerial Vehicles by Application (2019-2030)
Figure 59. Global Fuel-Driven Fixed Wing Unmanned Aerial Vehicles Price (US$/Unit) by Application (2019-2030)
Figure 60. Fuel-Driven Fixed Wing Unmanned Aerial Vehicles Value Chain
Figure 61. Fuel-Driven Fixed Wing Unmanned Aerial Vehicles Production Process
Figure 62. Channels of Distribution (Direct Vs Distribution)
Figure 63. Distributors Profiles
Figure 64. Bottom-up and Top-down Approaches for This Report
Figure 65. Data Triangulation