List of Tables
Table 1. Global AI-Powered Continuous Delivery Platform Market Size Growth Rate by Type (US$ Million): 2020 VS 2024 VS 2031
Table 2. Key Players of Cloud-Native Saas CD Platforms
Table 3. Key Players of On-Premises CD Solutions
Table 4. Key Players of Hybrid CD Platforms
Table 5. Global AI-Powered Continuous Delivery Platform Market Size Growth Rate by AI/ML Capabilities (US$ Million): 2020 VS 2024 VS 2031
Table 6. Key Players of Predictive Release Optimization
Table 7. Key Players of Anomaly Detection & Remediation
Table 8. Key Players of Automated Workflow Orchestration
Table 9. Key Players of Adaptive Testing & Quality Control
Table 10. Global AI-Powered Continuous Delivery Platform Market Size Growth Rate by Enterprise Focus (US$ Million): 2020 VS 2024 VS 2031
Table 11. Key Players of Enterprise-grade Platforms
Table 12. Key Players of DevOps-as-a-Service Solutions
Table 13. Global AI-Powered Continuous Delivery Platform Market Size Growth Rate by Integration Type (US$ Million): 2020 VS 2024 VS 2031
Table 14. Key Players of CI/CD Integrated Platforms
Table 15. Key Players of Standalone CD Platforms
Table 16. Global AI-Powered Continuous Delivery Platform Market Size Growth by Application (US$ Million): 2020 VS 2024 VS 2031
Table 17. Global AI-Powered Continuous Delivery Platform Market Size by Region (US$ Million): 2020 VS 2024 VS 2031
Table 18. Global AI-Powered Continuous Delivery Platform Market Size by Region (2020-2025) & (US$ Million)
Table 19. Global AI-Powered Continuous Delivery Platform Market Share by Region (2020-2025)
Table 20. Global AI-Powered Continuous Delivery Platform Forecasted Market Size by Region (2026-2031) & (US$ Million)
Table 21. Global AI-Powered Continuous Delivery Platform Market Share by Region (2026-2031)
Table 22. AI-Powered Continuous Delivery Platform Market Trends
Table 23. AI-Powered Continuous Delivery Platform Market Drivers
Table 24. AI-Powered Continuous Delivery Platform Market Challenges
Table 25. AI-Powered Continuous Delivery Platform Market Restraints
Table 26. Global AI-Powered Continuous Delivery Platform Revenue by Players (2020-2025) & (US$ Million)
Table 27. Global AI-Powered Continuous Delivery Platform Market Share by Players (2020-2025)
Table 28. Global Top AI-Powered Continuous Delivery Platform Players by Company Type (Tier 1, Tier 2, and Tier 3) & (based on the Revenue in AI-Powered Continuous Delivery Platform as of 2024)
Table 29. Ranking of Global Top AI-Powered Continuous Delivery Platform Companies by Revenue (US$ Million) in 2024
Table 30. Global 5 Largest Players Market Share by AI-Powered Continuous Delivery Platform Revenue (CR5 and HHI) & (2020-2025)
Table 31. Global Key Players of AI-Powered Continuous Delivery Platform, Headquarters and Area Served
Table 32. Global Key Players of AI-Powered Continuous Delivery Platform, Product and Application
Table 33. Global Key Players of AI-Powered Continuous Delivery Platform, Date of Enter into This Industry
Table 34. Mergers & Acquisitions, Expansion Plans
Table 35. Global AI-Powered Continuous Delivery Platform Market Size by Type (2020-2025) & (US$ Million)
Table 36. Global AI-Powered Continuous Delivery Platform Revenue Market Share by Type (2020-2025)
Table 37. Global AI-Powered Continuous Delivery Platform Forecasted Market Size by Type (2026-2031) & (US$ Million)
Table 38. Global AI-Powered Continuous Delivery Platform Revenue Market Share by Type (2026-2031)
Table 39. Global AI-Powered Continuous Delivery Platform Market Size by Application (2020-2025) & (US$ Million)
Table 40. Global AI-Powered Continuous Delivery Platform Revenue Market Share by Application (2020-2025)
Table 41. Global AI-Powered Continuous Delivery Platform Forecasted Market Size by Application (2026-2031) & (US$ Million)
Table 42. Global AI-Powered Continuous Delivery Platform Revenue Market Share by Application (2026-2031)
Table 43. North America AI-Powered Continuous Delivery Platform Market Size Growth Rate by Country (US$ Million): 2020 VS 2024 VS 2031
Table 44. North America AI-Powered Continuous Delivery Platform Market Size by Country (2020-2025) & (US$ Million)
Table 45. North America AI-Powered Continuous Delivery Platform Market Size by Country (2026-2031) & (US$ Million)
Table 46. Europe AI-Powered Continuous Delivery Platform Market Size Growth Rate by Country (US$ Million): 2020 VS 2024 VS 2031
Table 47. Europe AI-Powered Continuous Delivery Platform Market Size by Country (2020-2025) & (US$ Million)
Table 48. Europe AI-Powered Continuous Delivery Platform Market Size by Country (2026-2031) & (US$ Million)
Table 49. Asia-Pacific AI-Powered Continuous Delivery Platform Market Size Growth Rate by Region (US$ Million): 2020 VS 2024 VS 2031
Table 50. Asia-Pacific AI-Powered Continuous Delivery Platform Market Size by Region (2020-2025) & (US$ Million)
Table 51. Asia-Pacific AI-Powered Continuous Delivery Platform Market Size by Region (2026-2031) & (US$ Million)
Table 52. Latin America AI-Powered Continuous Delivery Platform Market Size Growth Rate by Country (US$ Million): 2020 VS 2024 VS 2031
Table 53. Latin America AI-Powered Continuous Delivery Platform Market Size by Country (2020-2025) & (US$ Million)
Table 54. Latin America AI-Powered Continuous Delivery Platform Market Size by Country (2026-2031) & (US$ Million)
Table 55. Middle East & Africa AI-Powered Continuous Delivery Platform Market Size Growth Rate by Country (US$ Million): 2020 VS 2024 VS 2031
Table 56. Middle East & Africa AI-Powered Continuous Delivery Platform Market Size by Country (2020-2025) & (US$ Million)
Table 57. Middle East & Africa AI-Powered Continuous Delivery Platform Market Size by Country (2026-2031) & (US$ Million)
Table 58. Harness Company Details
Table 59. Harness Business Overview
Table 60. Harness AI-Powered Continuous Delivery Platform Product
Table 61. Harness Revenue in AI-Powered Continuous Delivery Platform Business (2020-2025) & (US$ Million)
Table 62. Harness Recent Development
Table 63. GitLab Company Details
Table 64. GitLab Business Overview
Table 65. GitLab AI-Powered Continuous Delivery Platform Product
Table 66. GitLab Revenue in AI-Powered Continuous Delivery Platform Business (2020-2025) & (US$ Million)
Table 67. GitLab Recent Development
Table 68. Akuity Company Details
Table 69. Akuity Business Overview
Table 70. Akuity AI-Powered Continuous Delivery Platform Product
Table 71. Akuity Revenue in AI-Powered Continuous Delivery Platform Business (2020-2025) & (US$ Million)
Table 72. Akuity Recent Development
Table 73. Octopus Deploy Company Details
Table 74. Octopus Deploy Business Overview
Table 75. Octopus Deploy AI-Powered Continuous Delivery Platform Product
Table 76. Octopus Deploy Revenue in AI-Powered Continuous Delivery Platform Business (2020-2025) & (US$ Million)
Table 77. Octopus Deploy Recent Development
Table 78. Codefresh Company Details
Table 79. Codefresh Business Overview
Table 80. Codefresh AI-Powered Continuous Delivery Platform Product
Table 81. Codefresh Revenue in AI-Powered Continuous Delivery Platform Business (2020-2025) & (US$ Million)
Table 82. Codefresh Recent Development
Table 83. Spinnaker Company Details
Table 84. Spinnaker Business Overview
Table 85. Spinnaker AI-Powered Continuous Delivery Platform Product
Table 86. Spinnaker Revenue in AI-Powered Continuous Delivery Platform Business (2020-2025) & (US$ Million)
Table 87. Spinnaker Recent Development
Table 88. Jenkins Company Details
Table 89. Jenkins Business Overview
Table 90. Jenkins AI-Powered Continuous Delivery Platform Product
Table 91. Jenkins Revenue in AI-Powered Continuous Delivery Platform Business (2020-2025) & (US$ Million)
Table 92. Jenkins Recent Development
Table 93. GitHub Actions Company Details
Table 94. GitHub Actions Business Overview
Table 95. GitHub Actions AI-Powered Continuous Delivery Platform Product
Table 96. GitHub Actions Revenue in AI-Powered Continuous Delivery Platform Business (2020-2025) & (US$ Million)
Table 97. GitHub Actions Recent Development
Table 98. CircleCI Company Details
Table 99. CircleCI Business Overview
Table 100. CircleCI AI-Powered Continuous Delivery Platform Product
Table 101. CircleCI Revenue in AI-Powered Continuous Delivery Platform Business (2020-2025) & (US$ Million)
Table 102. CircleCI Recent Development
Table 103. Azure Pipelines Company Details
Table 104. Azure Pipelines Business Overview
Table 105. Azure Pipelines AI-Powered Continuous Delivery Platform Product
Table 106. Azure Pipelines Revenue in AI-Powered Continuous Delivery Platform Business (2020-2025) & (US$ Million)
Table 107. Azure Pipelines Recent Development
Table 108. AWS CodePipeline Company Details
Table 109. AWS CodePipeline Business Overview
Table 110. AWS CodePipeline AI-Powered Continuous Delivery Platform Product
Table 111. AWS CodePipeline Revenue in AI-Powered Continuous Delivery Platform Business (2020-2025) & (US$ Million)
Table 112. AWS CodePipeline Recent Development
Table 113. TeamCity Company Details
Table 114. TeamCity Business Overview
Table 115. TeamCity AI-Powered Continuous Delivery Platform Product
Table 116. TeamCity Revenue in AI-Powered Continuous Delivery Platform Business (2020-2025) & (US$ Million)
Table 117. TeamCity Recent Development
Table 118. Argo CD Company Details
Table 119. Argo CD Business Overview
Table 120. Argo CD AI-Powered Continuous Delivery Platform Product
Table 121. Argo CD Revenue in AI-Powered Continuous Delivery Platform Business (2020-2025) & (US$ Million)
Table 122. Argo CD Recent Development
Table 123. GoCD Company Details
Table 124. GoCD Business Overview
Table 125. GoCD AI-Powered Continuous Delivery Platform Product
Table 126. GoCD Revenue in AI-Powered Continuous Delivery Platform Business (2020-2025) & (US$ Million)
Table 127. GoCD Recent Development
Table 128. Research Programs/Design for This Report
Table 129. Key Data Information from Secondary Sources
Table 130. Key Data Information from Primary Sources
Table 131. Authors List of This Report
List of Figures
Figure 1. AI-Powered Continuous Delivery Platform Picture
Figure 2. Global AI-Powered Continuous Delivery Platform Market Size Comparison by Type (2020-2031) & (US$ Million)
Figure 3. Global AI-Powered Continuous Delivery Platform Market Share by Type: 2024 VS 2031
Figure 4. Cloud-Native Saas CD Platforms Features
Figure 5. On-Premises CD Solutions Features
Figure 6. Hybrid CD Platforms Features
Figure 7. Global AI-Powered Continuous Delivery Platform Market Size Comparison by AI/ML Capabilities (2020-2031) & (US$ Million)
Figure 8. Predictive Release Optimization Features
Figure 9. Anomaly Detection & Remediation Features
Figure 10. Automated Workflow Orchestration Features
Figure 11. Adaptive Testing & Quality Control Features
Figure 12. Global AI-Powered Continuous Delivery Platform Market Size Comparison by Enterprise Focus (2020-2031) & (US$ Million)
Figure 13. Enterprise-grade Platforms Features
Figure 14. DevOps-as-a-Service Solutions Features
Figure 15. Global AI-Powered Continuous Delivery Platform Market Size Comparison by Integration Type (2020-2031) & (US$ Million)
Figure 16. CI/CD Integrated Platforms Features
Figure 17. Standalone CD Platforms Features
Figure 18. Global AI-Powered Continuous Delivery Platform Market Size by Application (2020-2031) & (US$ Million)
Figure 19. Global AI-Powered Continuous Delivery Platform Market Share by Application: 2024 VS 2031
Figure 20. E-Commerce Case Studies
Figure 21. Financial Case Studies
Figure 22. IoT Case Studies
Figure 23. Others Case Studies
Figure 24. AI-Powered Continuous Delivery Platform Report Years Considered
Figure 25. Global AI-Powered Continuous Delivery Platform Market Size (US$ Million), Year-over-Year: 2020-2031
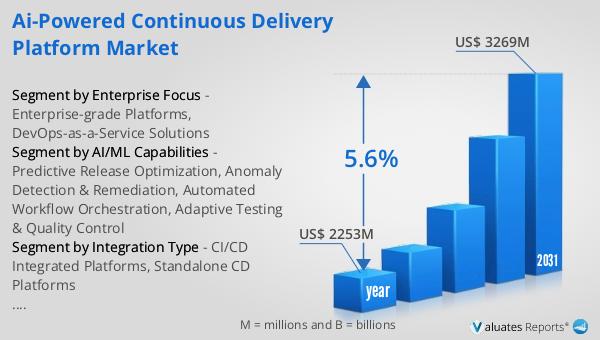
Figure 26. Global AI-Powered Continuous Delivery Platform Market Size, (US$ Million), 2020 VS 2024 VS 2031
Figure 27. Global AI-Powered Continuous Delivery Platform Market Share by Region: 2024 VS 2031
Figure 28. Global AI-Powered Continuous Delivery Platform Market Share by Players in 2024
Figure 29. Global AI-Powered Continuous Delivery Platform Market Share by Company Type (Tier 1, Tier 2, and Tier 3)
Figure 30. The Top 10 and 5 Players Market Share by AI-Powered Continuous Delivery Platform Revenue in 2024
Figure 31. North America AI-Powered Continuous Delivery Platform Market Size YoY Growth (2020-2031) & (US$ Million)
Figure 32. North America AI-Powered Continuous Delivery Platform Market Share by Country (2020-2031)
Figure 33. United States AI-Powered Continuous Delivery Platform Market Size YoY Growth (2020-2031) & (US$ Million)
Figure 34. Canada AI-Powered Continuous Delivery Platform Market Size YoY Growth (2020-2031) & (US$ Million)
Figure 35. Europe AI-Powered Continuous Delivery Platform Market Size YoY Growth (2020-2031) & (US$ Million)
Figure 36. Europe AI-Powered Continuous Delivery Platform Market Share by Country (2020-2031)
Figure 37. Germany AI-Powered Continuous Delivery Platform Market Size YoY Growth (2020-2031) & (US$ Million)
Figure 38. France AI-Powered Continuous Delivery Platform Market Size YoY Growth (2020-2031) & (US$ Million)
Figure 39. U.K. AI-Powered Continuous Delivery Platform Market Size YoY Growth (2020-2031) & (US$ Million)
Figure 40. Italy AI-Powered Continuous Delivery Platform Market Size YoY Growth (2020-2031) & (US$ Million)
Figure 41. Russia AI-Powered Continuous Delivery Platform Market Size YoY Growth (2020-2031) & (US$ Million)
Figure 42. Ireland AI-Powered Continuous Delivery Platform Market Size YoY Growth (2020-2031) & (US$ Million)
Figure 43. Asia-Pacific AI-Powered Continuous Delivery Platform Market Size YoY Growth (2020-2031) & (US$ Million)
Figure 44. Asia-Pacific AI-Powered Continuous Delivery Platform Market Share by Region (2020-2031)
Figure 45. China AI-Powered Continuous Delivery Platform Market Size YoY Growth (2020-2031) & (US$ Million)
Figure 46. Japan AI-Powered Continuous Delivery Platform Market Size YoY Growth (2020-2031) & (US$ Million)
Figure 47. South Korea AI-Powered Continuous Delivery Platform Market Size YoY Growth (2020-2031) & (US$ Million)
Figure 48. Southeast Asia AI-Powered Continuous Delivery Platform Market Size YoY Growth (2020-2031) & (US$ Million)
Figure 49. India AI-Powered Continuous Delivery Platform Market Size YoY Growth (2020-2031) & (US$ Million)
Figure 50. Australia & New Zealand AI-Powered Continuous Delivery Platform Market Size YoY Growth (2020-2031) & (US$ Million)
Figure 51. Latin America AI-Powered Continuous Delivery Platform Market Size YoY Growth (2020-2031) & (US$ Million)
Figure 52. Latin America AI-Powered Continuous Delivery Platform Market Share by Country (2020-2031)
Figure 53. Mexico AI-Powered Continuous Delivery Platform Market Size YoY Growth (2020-2031) & (US$ Million)
Figure 54. Brazil AI-Powered Continuous Delivery Platform Market Size YoY Growth (2020-2031) & (US$ Million)
Figure 55. Middle East & Africa AI-Powered Continuous Delivery Platform Market Size YoY Growth (2020-2031) & (US$ Million)
Figure 56. Middle East & Africa AI-Powered Continuous Delivery Platform Market Share by Country (2020-2031)
Figure 57. Israel AI-Powered Continuous Delivery Platform Market Size YoY Growth (2020-2031) & (US$ Million)
Figure 58. Saudi Arabia AI-Powered Continuous Delivery Platform Market Size YoY Growth (2020-2031) & (US$ Million)
Figure 59. UAE AI-Powered Continuous Delivery Platform Market Size YoY Growth (2020-2031) & (US$ Million)
Figure 60. Harness Revenue Growth Rate in AI-Powered Continuous Delivery Platform Business (2020-2025)
Figure 61. GitLab Revenue Growth Rate in AI-Powered Continuous Delivery Platform Business (2020-2025)
Figure 62. Akuity Revenue Growth Rate in AI-Powered Continuous Delivery Platform Business (2020-2025)
Figure 63. Octopus Deploy Revenue Growth Rate in AI-Powered Continuous Delivery Platform Business (2020-2025)
Figure 64. Codefresh Revenue Growth Rate in AI-Powered Continuous Delivery Platform Business (2020-2025)
Figure 65. Spinnaker Revenue Growth Rate in AI-Powered Continuous Delivery Platform Business (2020-2025)
Figure 66. Jenkins Revenue Growth Rate in AI-Powered Continuous Delivery Platform Business (2020-2025)
Figure 67. GitHub Actions Revenue Growth Rate in AI-Powered Continuous Delivery Platform Business (2020-2025)
Figure 68. CircleCI Revenue Growth Rate in AI-Powered Continuous Delivery Platform Business (2020-2025)
Figure 69. Azure Pipelines Revenue Growth Rate in AI-Powered Continuous Delivery Platform Business (2020-2025)
Figure 70. AWS CodePipeline Revenue Growth Rate in AI-Powered Continuous Delivery Platform Business (2020-2025)
Figure 71. TeamCity Revenue Growth Rate in AI-Powered Continuous Delivery Platform Business (2020-2025)
Figure 72. Argo CD Revenue Growth Rate in AI-Powered Continuous Delivery Platform Business (2020-2025)
Figure 73. GoCD Revenue Growth Rate in AI-Powered Continuous Delivery Platform Business (2020-2025)
Figure 74. Bottom-up and Top-down Approaches for This Report
Figure 75. Data Triangulation
Figure 76. Key Executives Interviewed