List of Tables
Table 1. Global Target Enrichment Solutions for Next-Generation Sequencing Market Size Growth Rate by Type (US$ Million): 2020 VS 2024 VS 2031
Table 2. Key Players of Multiplex PCR-based (Amplicon Sequencing)
Table 3. Key Players of Hybrid Capture-based
Table 4. Global Target Enrichment Solutions for Next-Generation Sequencing Market Size Growth by Application (US$ Million): 2020 VS 2024 VS 2031
Table 5. Global Target Enrichment Solutions for Next-Generation Sequencing Market Size by Region (US$ Million): 2020 VS 2024 VS 2031
Table 6. Global Target Enrichment Solutions for Next-Generation Sequencing Market Size by Region (2020-2025) & (US$ Million)
Table 7. Global Target Enrichment Solutions for Next-Generation Sequencing Market Share by Region (2020-2025)
Table 8. Global Target Enrichment Solutions for Next-Generation Sequencing Forecasted Market Size by Region (2026-2031) & (US$ Million)
Table 9. Global Target Enrichment Solutions for Next-Generation Sequencing Market Share by Region (2026-2031)
Table 10. Target Enrichment Solutions for Next-Generation Sequencing Market Trends
Table 11. Target Enrichment Solutions for Next-Generation Sequencing Market Drivers
Table 12. Target Enrichment Solutions for Next-Generation Sequencing Market Challenges
Table 13. Target Enrichment Solutions for Next-Generation Sequencing Market Restraints
Table 14. Global Target Enrichment Solutions for Next-Generation Sequencing Revenue by Players (2020-2025) & (US$ Million)
Table 15. Global Target Enrichment Solutions for Next-Generation Sequencing Market Share by Players (2020-2025)
Table 16. Global Top Target Enrichment Solutions for Next-Generation Sequencing Players by Company Type (Tier 1, Tier 2, and Tier 3) & (based on the Revenue in Target Enrichment Solutions for Next-Generation Sequencing as of 2024)
Table 17. Ranking of Global Top Target Enrichment Solutions for Next-Generation Sequencing Companies by Revenue (US$ Million) in 2024
Table 18. Global 5 Largest Players Market Share by Target Enrichment Solutions for Next-Generation Sequencing Revenue (CR5 and HHI) & (2020-2025)
Table 19. Global Key Players of Target Enrichment Solutions for Next-Generation Sequencing, Headquarters and Area Served
Table 20. Global Key Players of Target Enrichment Solutions for Next-Generation Sequencing, Product and Application
Table 21. Global Key Players of Target Enrichment Solutions for Next-Generation Sequencing, Date of Enter into This Industry
Table 22. Mergers & Acquisitions, Expansion Plans
Table 23. Global Target Enrichment Solutions for Next-Generation Sequencing Market Size by Type (2020-2025) & (US$ Million)
Table 24. Global Target Enrichment Solutions for Next-Generation Sequencing Revenue Market Share by Type (2020-2025)
Table 25. Global Target Enrichment Solutions for Next-Generation Sequencing Forecasted Market Size by Type (2026-2031) & (US$ Million)
Table 26. Global Target Enrichment Solutions for Next-Generation Sequencing Revenue Market Share by Type (2026-2031)
Table 27. Global Target Enrichment Solutions for Next-Generation Sequencing Market Size by Application (2020-2025) & (US$ Million)
Table 28. Global Target Enrichment Solutions for Next-Generation Sequencing Revenue Market Share by Application (2020-2025)
Table 29. Global Target Enrichment Solutions for Next-Generation Sequencing Forecasted Market Size by Application (2026-2031) & (US$ Million)
Table 30. Global Target Enrichment Solutions for Next-Generation Sequencing Revenue Market Share by Application (2026-2031)
Table 31. North America Target Enrichment Solutions for Next-Generation Sequencing Market Size Growth Rate by Country (US$ Million): 2020 VS 2024 VS 2031
Table 32. North America Target Enrichment Solutions for Next-Generation Sequencing Market Size by Country (2020-2025) & (US$ Million)
Table 33. North America Target Enrichment Solutions for Next-Generation Sequencing Market Size by Country (2026-2031) & (US$ Million)
Table 34. Europe Target Enrichment Solutions for Next-Generation Sequencing Market Size Growth Rate by Country (US$ Million): 2020 VS 2024 VS 2031
Table 35. Europe Target Enrichment Solutions for Next-Generation Sequencing Market Size by Country (2020-2025) & (US$ Million)
Table 36. Europe Target Enrichment Solutions for Next-Generation Sequencing Market Size by Country (2026-2031) & (US$ Million)
Table 37. Asia-Pacific Target Enrichment Solutions for Next-Generation Sequencing Market Size Growth Rate by Region (US$ Million): 2020 VS 2024 VS 2031
Table 38. Asia-Pacific Target Enrichment Solutions for Next-Generation Sequencing Market Size by Region (2020-2025) & (US$ Million)
Table 39. Asia-Pacific Target Enrichment Solutions for Next-Generation Sequencing Market Size by Region (2026-2031) & (US$ Million)
Table 40. Latin America Target Enrichment Solutions for Next-Generation Sequencing Market Size Growth Rate by Country (US$ Million): 2020 VS 2024 VS 2031
Table 41. Latin America Target Enrichment Solutions for Next-Generation Sequencing Market Size by Country (2020-2025) & (US$ Million)
Table 42. Latin America Target Enrichment Solutions for Next-Generation Sequencing Market Size by Country (2026-2031) & (US$ Million)
Table 43. Middle East & Africa Target Enrichment Solutions for Next-Generation Sequencing Market Size Growth Rate by Country (US$ Million): 2020 VS 2024 VS 2031
Table 44. Middle East & Africa Target Enrichment Solutions for Next-Generation Sequencing Market Size by Country (2020-2025) & (US$ Million)
Table 45. Middle East & Africa Target Enrichment Solutions for Next-Generation Sequencing Market Size by Country (2026-2031) & (US$ Million)
Table 46. Thermo Fisher Scientific Company Details
Table 47. Thermo Fisher Scientific Business Overview
Table 48. Thermo Fisher Scientific Target Enrichment Solutions for Next-Generation Sequencing Product
Table 49. Thermo Fisher Scientific Revenue in Target Enrichment Solutions for Next-Generation Sequencing Business (2020-2025) & (US$ Million)
Table 50. Thermo Fisher Scientific Recent Development
Table 51. Illumina Company Details
Table 52. Illumina Business Overview
Table 53. Illumina Target Enrichment Solutions for Next-Generation Sequencing Product
Table 54. Illumina Revenue in Target Enrichment Solutions for Next-Generation Sequencing Business (2020-2025) & (US$ Million)
Table 55. Illumina Recent Development
Table 56. Agilent Technologies Company Details
Table 57. Agilent Technologies Business Overview
Table 58. Agilent Technologies Target Enrichment Solutions for Next-Generation Sequencing Product
Table 59. Agilent Technologies Revenue in Target Enrichment Solutions for Next-Generation Sequencing Business (2020-2025) & (US$ Million)
Table 60. Agilent Technologies Recent Development
Table 61. QIAGEN Company Details
Table 62. QIAGEN Business Overview
Table 63. QIAGEN Target Enrichment Solutions for Next-Generation Sequencing Product
Table 64. QIAGEN Revenue in Target Enrichment Solutions for Next-Generation Sequencing Business (2020-2025) & (US$ Million)
Table 65. QIAGEN Recent Development
Table 66. Integrated DNA Technologies Company Details
Table 67. Integrated DNA Technologies Business Overview
Table 68. Integrated DNA Technologies Target Enrichment Solutions for Next-Generation Sequencing Product
Table 69. Integrated DNA Technologies Revenue in Target Enrichment Solutions for Next-Generation Sequencing Business (2020-2025) & (US$ Million)
Table 70. Integrated DNA Technologies Recent Development
Table 71. Twist Bioscience Company Details
Table 72. Twist Bioscience Business Overview
Table 73. Twist Bioscience Target Enrichment Solutions for Next-Generation Sequencing Product
Table 74. Twist Bioscience Revenue in Target Enrichment Solutions for Next-Generation Sequencing Business (2020-2025) & (US$ Million)
Table 75. Twist Bioscience Recent Development
Table 76. Takara Bio Company Details
Table 77. Takara Bio Business Overview
Table 78. Takara Bio Target Enrichment Solutions for Next-Generation Sequencing Product
Table 79. Takara Bio Revenue in Target Enrichment Solutions for Next-Generation Sequencing Business (2020-2025) & (US$ Million)
Table 80. Takara Bio Recent Development
Table 81. GenScript Company Details
Table 82. GenScript Business Overview
Table 83. GenScript Target Enrichment Solutions for Next-Generation Sequencing Product
Table 84. GenScript Revenue in Target Enrichment Solutions for Next-Generation Sequencing Business (2020-2025) & (US$ Million)
Table 85. GenScript Recent Development
Table 86. Roche Sequencing Solutions Company Details
Table 87. Roche Sequencing Solutions Business Overview
Table 88. Roche Sequencing Solutions Target Enrichment Solutions for Next-Generation Sequencing Product
Table 89. Roche Sequencing Solutions Revenue in Target Enrichment Solutions for Next-Generation Sequencing Business (2020-2025) & (US$ Million)
Table 90. Roche Sequencing Solutions Recent Development
Table 91. Oxford Gene Technology Company Details
Table 92. Oxford Gene Technology Business Overview
Table 93. Oxford Gene Technology Target Enrichment Solutions for Next-Generation Sequencing Product
Table 94. Oxford Gene Technology Revenue in Target Enrichment Solutions for Next-Generation Sequencing Business (2020-2025) & (US$ Million)
Table 95. Oxford Gene Technology Recent Development
Table 96. Pillar Biosciences Company Details
Table 97. Pillar Biosciences Business Overview
Table 98. Pillar Biosciences Target Enrichment Solutions for Next-Generation Sequencing Product
Table 99. Pillar Biosciences Revenue in Target Enrichment Solutions for Next-Generation Sequencing Business (2020-2025) & (US$ Million)
Table 100. Pillar Biosciences Recent Development
Table 101. Celemics Company Details
Table 102. Celemics Business Overview
Table 103. Celemics Target Enrichment Solutions for Next-Generation Sequencing Product
Table 104. Celemics Revenue in Target Enrichment Solutions for Next-Generation Sequencing Business (2020-2025) & (US$ Million)
Table 105. Celemics Recent Development
Table 106. Daicel Arbor Biosciences Company Details
Table 107. Daicel Arbor Biosciences Business Overview
Table 108. Daicel Arbor Biosciences Target Enrichment Solutions for Next-Generation Sequencing Product
Table 109. Daicel Arbor Biosciences Revenue in Target Enrichment Solutions for Next-Generation Sequencing Business (2020-2025) & (US$ Million)
Table 110. Daicel Arbor Biosciences Recent Development
Table 111. Nonacus Company Details
Table 112. Nonacus Business Overview
Table 113. Nonacus Target Enrichment Solutions for Next-Generation Sequencing Product
Table 114. Nonacus Revenue in Target Enrichment Solutions for Next-Generation Sequencing Business (2020-2025) & (US$ Million)
Table 115. Nonacus Recent Development
Table 116. Tecan Company Details
Table 117. Tecan Business Overview
Table 118. Tecan Target Enrichment Solutions for Next-Generation Sequencing Product
Table 119. Tecan Revenue in Target Enrichment Solutions for Next-Generation Sequencing Business (2020-2025) & (US$ Million)
Table 120. Tecan Recent Development
Table 121. Cantata Bio Company Details
Table 122. Cantata Bio Business Overview
Table 123. Cantata Bio Target Enrichment Solutions for Next-Generation Sequencing Product
Table 124. Cantata Bio Revenue in Target Enrichment Solutions for Next-Generation Sequencing Business (2020-2025) & (US$ Million)
Table 125. Cantata Bio Recent Development
Table 126. Paragon Genomics Company Details
Table 127. Paragon Genomics Business Overview
Table 128. Paragon Genomics Target Enrichment Solutions for Next-Generation Sequencing Product
Table 129. Paragon Genomics Revenue in Target Enrichment Solutions for Next-Generation Sequencing Business (2020-2025) & (US$ Million)
Table 130. Paragon Genomics Recent Development
Table 131. New England Biolabs Company Details
Table 132. New England Biolabs Business Overview
Table 133. New England Biolabs Target Enrichment Solutions for Next-Generation Sequencing Product
Table 134. New England Biolabs Revenue in Target Enrichment Solutions for Next-Generation Sequencing Business (2020-2025) & (US$ Million)
Table 135. New England Biolabs Recent Development
Table 136. Shanghai Dynegene Technologies Company Details
Table 137. Shanghai Dynegene Technologies Business Overview
Table 138. Shanghai Dynegene Technologies Target Enrichment Solutions for Next-Generation Sequencing Product
Table 139. Shanghai Dynegene Technologies Revenue in Target Enrichment Solutions for Next-Generation Sequencing Business (2020-2025) & (US$ Million)
Table 140. Shanghai Dynegene Technologies Recent Development
Table 141. Research Programs/Design for This Report
Table 142. Key Data Information from Secondary Sources
Table 143. Key Data Information from Primary Sources
Table 144. Authors List of This Report
List of Figures
Figure 1. Target Enrichment Solutions for Next-Generation Sequencing Picture
Figure 2. Global Target Enrichment Solutions for Next-Generation Sequencing Market Size Comparison by Type (2020-2031) & (US$ Million)
Figure 3. Global Target Enrichment Solutions for Next-Generation Sequencing Market Share by Type: 2024 VS 2031
Figure 4. Multiplex PCR-based (Amplicon Sequencing) Features
Figure 5. Hybrid Capture-based Features
Figure 6. Global Target Enrichment Solutions for Next-Generation Sequencing Market Size by Application (2020-2031) & (US$ Million)
Figure 7. Global Target Enrichment Solutions for Next-Generation Sequencing Market Share by Application: 2024 VS 2031
Figure 8. Hospitals and Clinics Case Studies
Figure 9. Biopharma Companies Case Studies
Figure 10. Academic and Research Organizations Case Studies
Figure 11. Others Case Studies
Figure 12. Target Enrichment Solutions for Next-Generation Sequencing Report Years Considered
Figure 13. Global Target Enrichment Solutions for Next-Generation Sequencing Market Size (US$ Million), Year-over-Year: 2020-2031
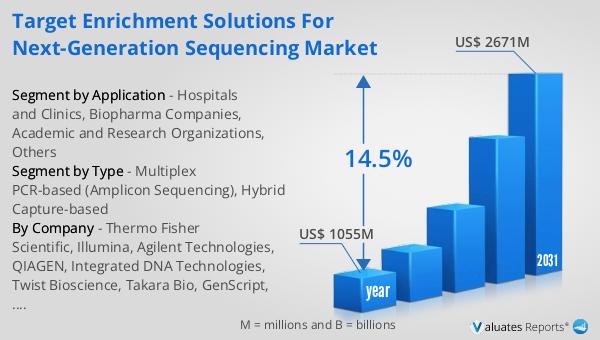
Figure 14. Global Target Enrichment Solutions for Next-Generation Sequencing Market Size, (US$ Million), 2020 VS 2024 VS 2031
Figure 15. Global Target Enrichment Solutions for Next-Generation Sequencing Market Share by Region: 2024 VS 2031
Figure 16. Global Target Enrichment Solutions for Next-Generation Sequencing Market Share by Players in 2024
Figure 17. Global Target Enrichment Solutions for Next-Generation Sequencing Market Share by Company Type (Tier 1, Tier 2, and Tier 3)
Figure 18. The Top 10 and 5 Players Market Share by Target Enrichment Solutions for Next-Generation Sequencing Revenue in 2024
Figure 19. North America Target Enrichment Solutions for Next-Generation Sequencing Market Size YoY Growth (2020-2031) & (US$ Million)
Figure 20. North America Target Enrichment Solutions for Next-Generation Sequencing Market Share by Country (2020-2031)
Figure 21. United States Target Enrichment Solutions for Next-Generation Sequencing Market Size YoY Growth (2020-2031) & (US$ Million)
Figure 22. Canada Target Enrichment Solutions for Next-Generation Sequencing Market Size YoY Growth (2020-2031) & (US$ Million)
Figure 23. Europe Target Enrichment Solutions for Next-Generation Sequencing Market Size YoY Growth (2020-2031) & (US$ Million)
Figure 24. Europe Target Enrichment Solutions for Next-Generation Sequencing Market Share by Country (2020-2031)
Figure 25. Germany Target Enrichment Solutions for Next-Generation Sequencing Market Size YoY Growth (2020-2031) & (US$ Million)
Figure 26. France Target Enrichment Solutions for Next-Generation Sequencing Market Size YoY Growth (2020-2031) & (US$ Million)
Figure 27. U.K. Target Enrichment Solutions for Next-Generation Sequencing Market Size YoY Growth (2020-2031) & (US$ Million)
Figure 28. Italy Target Enrichment Solutions for Next-Generation Sequencing Market Size YoY Growth (2020-2031) & (US$ Million)
Figure 29. Russia Target Enrichment Solutions for Next-Generation Sequencing Market Size YoY Growth (2020-2031) & (US$ Million)
Figure 30. Nordic Countries Target Enrichment Solutions for Next-Generation Sequencing Market Size YoY Growth (2020-2031) & (US$ Million)
Figure 31. Asia-Pacific Target Enrichment Solutions for Next-Generation Sequencing Market Size YoY Growth (2020-2031) & (US$ Million)
Figure 32. Asia-Pacific Target Enrichment Solutions for Next-Generation Sequencing Market Share by Region (2020-2031)
Figure 33. China Target Enrichment Solutions for Next-Generation Sequencing Market Size YoY Growth (2020-2031) & (US$ Million)
Figure 34. Japan Target Enrichment Solutions for Next-Generation Sequencing Market Size YoY Growth (2020-2031) & (US$ Million)
Figure 35. South Korea Target Enrichment Solutions for Next-Generation Sequencing Market Size YoY Growth (2020-2031) & (US$ Million)
Figure 36. Southeast Asia Target Enrichment Solutions for Next-Generation Sequencing Market Size YoY Growth (2020-2031) & (US$ Million)
Figure 37. India Target Enrichment Solutions for Next-Generation Sequencing Market Size YoY Growth (2020-2031) & (US$ Million)
Figure 38. Australia Target Enrichment Solutions for Next-Generation Sequencing Market Size YoY Growth (2020-2031) & (US$ Million)
Figure 39. Latin America Target Enrichment Solutions for Next-Generation Sequencing Market Size YoY Growth (2020-2031) & (US$ Million)
Figure 40. Latin America Target Enrichment Solutions for Next-Generation Sequencing Market Share by Country (2020-2031)
Figure 41. Mexico Target Enrichment Solutions for Next-Generation Sequencing Market Size YoY Growth (2020-2031) & (US$ Million)
Figure 42. Brazil Target Enrichment Solutions for Next-Generation Sequencing Market Size YoY Growth (2020-2031) & (US$ Million)
Figure 43. Middle East & Africa Target Enrichment Solutions for Next-Generation Sequencing Market Size YoY Growth (2020-2031) & (US$ Million)
Figure 44. Middle East & Africa Target Enrichment Solutions for Next-Generation Sequencing Market Share by Country (2020-2031)
Figure 45. Turkey Target Enrichment Solutions for Next-Generation Sequencing Market Size YoY Growth (2020-2031) & (US$ Million)
Figure 46. Saudi Arabia Target Enrichment Solutions for Next-Generation Sequencing Market Size YoY Growth (2020-2031) & (US$ Million)
Figure 47. UAE Target Enrichment Solutions for Next-Generation Sequencing Market Size YoY Growth (2020-2031) & (US$ Million)
Figure 48. Thermo Fisher Scientific Revenue Growth Rate in Target Enrichment Solutions for Next-Generation Sequencing Business (2020-2025)
Figure 49. Illumina Revenue Growth Rate in Target Enrichment Solutions for Next-Generation Sequencing Business (2020-2025)
Figure 50. Agilent Technologies Revenue Growth Rate in Target Enrichment Solutions for Next-Generation Sequencing Business (2020-2025)
Figure 51. QIAGEN Revenue Growth Rate in Target Enrichment Solutions for Next-Generation Sequencing Business (2020-2025)
Figure 52. Integrated DNA Technologies Revenue Growth Rate in Target Enrichment Solutions for Next-Generation Sequencing Business (2020-2025)
Figure 53. Twist Bioscience Revenue Growth Rate in Target Enrichment Solutions for Next-Generation Sequencing Business (2020-2025)
Figure 54. Takara Bio Revenue Growth Rate in Target Enrichment Solutions for Next-Generation Sequencing Business (2020-2025)
Figure 55. GenScript Revenue Growth Rate in Target Enrichment Solutions for Next-Generation Sequencing Business (2020-2025)
Figure 56. Roche Sequencing Solutions Revenue Growth Rate in Target Enrichment Solutions for Next-Generation Sequencing Business (2020-2025)
Figure 57. Oxford Gene Technology Revenue Growth Rate in Target Enrichment Solutions for Next-Generation Sequencing Business (2020-2025)
Figure 58. Pillar Biosciences Revenue Growth Rate in Target Enrichment Solutions for Next-Generation Sequencing Business (2020-2025)
Figure 59. Celemics Revenue Growth Rate in Target Enrichment Solutions for Next-Generation Sequencing Business (2020-2025)
Figure 60. Daicel Arbor Biosciences Revenue Growth Rate in Target Enrichment Solutions for Next-Generation Sequencing Business (2020-2025)
Figure 61. Nonacus Revenue Growth Rate in Target Enrichment Solutions for Next-Generation Sequencing Business (2020-2025)
Figure 62. Tecan Revenue Growth Rate in Target Enrichment Solutions for Next-Generation Sequencing Business (2020-2025)
Figure 63. Cantata Bio Revenue Growth Rate in Target Enrichment Solutions for Next-Generation Sequencing Business (2020-2025)
Figure 64. Paragon Genomics Revenue Growth Rate in Target Enrichment Solutions for Next-Generation Sequencing Business (2020-2025)
Figure 65. New England Biolabs Revenue Growth Rate in Target Enrichment Solutions for Next-Generation Sequencing Business (2020-2025)
Figure 66. Shanghai Dynegene Technologies Revenue Growth Rate in Target Enrichment Solutions for Next-Generation Sequencing Business (2020-2025)
Figure 67. Bottom-up and Top-down Approaches for This Report
Figure 68. Data Triangulation
Figure 69. Key Executives Interviewed