0
U.S. (TOLL FREE)
+1 (315) 215-3225
Automative

0
U.S. (TOLL FREE)
+1 (315) 215-3225
Global AI-Powered App Development and Digital IT Solutions Market Research Report 2026
Published Date: 2026-01-28
|
Report Code: QYRE-Auto-35C20002
Home | Market Reports | Computers & Electronics| Programming
Global AI Powered App Development and Digital IT Solutions Market Research Report 2026
BUY CHAPTERS

Global AI-Powered App Development and Digital IT Solutions Market Research Report 2026

Code: QYRE-Auto-35C20002
Report
2026-01-28
Pages:199
QYResearch
Buy Now with 15% Discount
DESCRIPTION
TABLE OF CONTENT
TABLES & FIGURES

AI-Powered App Development and Digital IT Solutions Market Size

The global AI-Powered App Development and Digital IT Solutions market was valued at US$ 5081 million in 2025 and is anticipated to reach US$ 15615 million by 2032, at a CAGR of 17.4% from 2026 to 2032.

AI-Powered App Development and Digital IT Solutions Market

AI-Powered App Development and Digital IT Solutions Market

AI-Powered App Development and Digital IT Solutions refer to a suite of technology services and products that integrate artificial intelligence (AI) and machine learning (ML) capabilities into custom software applications, enterprise IT systems, and digital workflows. Unlike traditional app development (which focuses on rule-based functionality and manual process automation), these solutions leverage AI to enable predictive decision-making, natural language interaction, intelligent automation, and data-driven personalization—transforming how businesses operate, engage customers, and optimize their IT infrastructure.
These solutions span the entire IT lifecycle: from strategy and design to development, deployment, and maintenance—with AI embedded as a core component rather than an add-on feature. They cater to diverse industries (e.g., healthcare, finance, retail, manufacturing) and use cases, addressing needs ranging from customer-facing chatbots to enterprise-grade predictive analytics platforms.
The North American market for AI-Powered App Development and Digital IT Solutions is projected to increase from US$ million in 2025 to US$ million by 2032, at a CAGR of % over 2026–2032.
The Asia-Pacific market for AI-Powered App Development and Digital IT Solutions is projected to rise from US$ million in 2025 to US$ million by 2032, at a CAGR of % over 2026–2032.
The global market for AI-Powered App Development and Digital IT Solutions in Healthcare is estimated to increase from US$ million in 2025 to US$ million by 2032, at a CAGR of % from 2026 to 2032.
Major global companies of AI-Powered App Development and Digital IT Solutions include The Distance, Prismmetric, Sparx IT Solutions, MindInventory, Appinventiv, Orange Mantra, Emizentech, Microsoft, MobileCoderz, BigOhTech, etc. In 2025, the world's top three vendors accounted for approximately % of revenue.
This report delivers a comprehensive overview of the global AI-Powered App Development and Digital IT Solutions market, with both quantitative and qualitative analyses, to help readers develop growth strategies, assess the competitive landscape, evaluate their position in the current market, and make informed business decisions regarding AI-Powered App Development and Digital IT Solutions. The AI-Powered App Development and Digital IT Solutions market size, estimates, and forecasts are provided in terms of revenue (US$ millions), with 2025 as the base year and historical and forecast data for 2021–2032.
The report segments the global AI-Powered App Development and Digital IT Solutions market comprehensively. Regional market sizes by Type, by Application, by AI Capability Focus, and by player are also provided. For deeper insight, the report profiles the competitive landscape, key competitors, and their respective market rankings, and discusses technological trends and new product developments.
This report will assist AI-Powered App Development and Digital IT Solutions manufacturers, new entrants, and companies across the industry value chain with information on revenues, sales volume, and average prices for the overall market and its sub-segments, by company, by Type, by Application, and by region.
Market Segmentation

Scope of AI-Powered App Development and Digital IT Solutions Market Report

Report Metric Details
Report Name AI-Powered App Development and Digital IT Solutions Market
Accounted market size in 2025 US$ 5081 million
Forecasted market size in 2032 US$ 15615 million
CAGR 17.4%
Base Year 2025
Forecasted years 2026 - 2032
Segment by Type
  • Cloud-Based AI Solutions
  • On-Premises AI Solutions
  • Hybrid AI Solutions
  • Edge AI Solutions
Segment by AI Capability Focus
  • Conversational AI Solutions
  • Predictive Analytics Solutions
  • Computer Vision Solutions
  • Generative AI Solutions
  • Intelligent Process Automation (IPA) Solutions
Segment by Application
  • Healthcare
  • Finance
  • Retail & E-Commerce
  • Manufacturing
  • Enterprise IT
  • Others
By Region
  • North America (United States, Canada)
  • Europe (Germany, France, UK, Italy, Russia) Rest of Europe
  • Nordic Countries
  • Asia-Pacific (China, Japan, South Korea)
  • Southeast Asia (India, Australia)
  • Rest of Asia
  • Latin America (Mexico, Brazil)
  • Rest of Latin America
  • Middle East & Africa (Turkey, Saudi Arabia, UAE, Rest of MEA)
By Company The Distance, Prismmetric, Sparx IT Solutions, MindInventory, Appinventiv, Orange Mantra, Emizentech, Microsoft, MobileCoderz, BigOhTech, DianApps, Matellio, Andersen Lab, Guru TechnoLabs, Mbicycle, Nevina Infotech, PNDigital, Folio3 AI, Riseup Labs, AppsChopper, EvinceDev, Flatworld Solutions, SysBunny, GoodFirms, SemiDot, BLE Mobile App, Hidden Brains, Saffron Tech, Zfort Group, Octal, Excellent Webworld, Day One, Appsnado, Peerbits, APPSTIRR, Tekrevol, Dreamsoft4u, Weelorum, Fexle Services, Softwareistic, WEDOWEBAPPS, SARA Technologies, APPWRK IT Solutions, iPraxa, BlueLabel, Hattrick-IT, TechGropse, Mobulous
Forecast units USD million in value
Report coverage Revenue and volume forecast, company share, competitive landscape, growth factors and trends

Chapter Outline

  • Chapter 1: Defines the scope of the report and presents an executive summary of market segments (by Type, by Application, by AI Capability Focus, etc.), including the size of each segment and its future growth potential. It offers a high-level view of the current market and its likely evolution in the short, medium, and long term.
  • Chapter 2: Summarizes global and regional market size and outlines market dynamics and recent developments, including key drivers, restraints, challenges and risks for industry participants, and relevant policy analysis.
  • Chapter 3: Provides a detailed view of the competitive landscape for AI-Powered App Development and Digital IT Solutions companies, covering revenue share, development plans, and mergers and acquisitions.
  • Chapter 4: Analyzes segments by Type, detailing the size and growth potential of each segment to help readers identify blue-ocean opportunities.
  • Chapter 5: Analyzes segments by Application, detailing the size and growth potential of each downstream segment to help readers identify blue-ocean opportunities.
  • Chapter 6–10: Regional deep dives (North America, Europe, Asia Pacific, Latin America, Middle East & Africa) broken down by country. Each chapter quantifies market size and growth potential by region and key countries, and outlines market development, outlook, addressable space, and capacity.
  • Chapter 11: Profiles key players, presenting essential information on leading companies, including product/ service offerings, revenue, gross margin, product introductions/portfolios, recent developments, etc.
  • Chapter 12: Key findings and conclusions of the report.

FAQ for this report

How fast is AI-Powered App Development and Digital IT Solutions Market growing?

Ans: The AI-Powered App Development and Digital IT Solutions Market witnessing a CAGR of 17.4% during the forecast period 2026-2032.

What is the AI-Powered App Development and Digital IT Solutions Market size in 2032?

Ans: The AI-Powered App Development and Digital IT Solutions Market size in 2032 will be US$ 15615 million.

Who are the main players in the AI-Powered App Development and Digital IT Solutions Market report?

Ans: The main players in the AI-Powered App Development and Digital IT Solutions Market are The Distance, Prismmetric, Sparx IT Solutions, MindInventory, Appinventiv, Orange Mantra, Emizentech, Microsoft, MobileCoderz, BigOhTech, DianApps, Matellio, Andersen Lab, Guru TechnoLabs, Mbicycle, Nevina Infotech, PNDigital, Folio3 AI, Riseup Labs, AppsChopper, EvinceDev, Flatworld Solutions, SysBunny, GoodFirms, SemiDot, BLE Mobile App, Hidden Brains, Saffron Tech, Zfort Group, Octal, Excellent Webworld, Day One, Appsnado, Peerbits, APPSTIRR, Tekrevol, Dreamsoft4u, Weelorum, Fexle Services, Softwareistic, WEDOWEBAPPS, SARA Technologies, APPWRK IT Solutions, iPraxa, BlueLabel, Hattrick-IT, TechGropse, Mobulous

What are the Application segmentation covered in the AI-Powered App Development and Digital IT Solutions Market report?

Ans: The Applications covered in the AI-Powered App Development and Digital IT Solutions Market report are Healthcare, Finance, Retail & E-Commerce, Manufacturing, Enterprise IT, Others

What are the Type segmentation covered in the AI-Powered App Development and Digital IT Solutions Market report?

Ans: The Types covered in the AI-Powered App Development and Digital IT Solutions Market report are Cloud-Based AI Solutions, On-Premises AI Solutions, Hybrid AI Solutions, Edge AI Solutions

1 Report Overview
1.1 Study Scope
1.2 Market Analysis by Type
1.2.1 Global AI-Powered App Development and Digital IT Solutions Market Size Growth Rate by Type: 2021 vs 2025 vs 2032
1.2.2 Cloud-Based AI Solutions
1.2.3 On-Premises AI Solutions
1.2.4 Hybrid AI Solutions
1.2.5 Edge AI Solutions
1.3 Market by AI Capability Focus
1.3.1 Global AI-Powered App Development and Digital IT Solutions Market Size Growth Rate by AI Capability Focus: 2021 vs 2025 vs 2032
1.3.2 Conversational AI Solutions
1.3.3 Predictive Analytics Solutions
1.3.4 Computer Vision Solutions
1.3.5 Generative AI Solutions
1.3.6 Intelligent Process Automation (IPA) Solutions
1.4 Market by Application
1.4.1 Global AI-Powered App Development and Digital IT Solutions Market Growth by Application: 2021 vs 2025 vs 2032
1.4.2 Healthcare
1.4.3 Finance
1.4.4 Retail & E-Commerce
1.4.5 Manufacturing
1.4.6 Enterprise IT
1.4.7 Others
1.5 Assumptions and Limitations
1.6 Study Objectives
1.7 Years Considered
2 Global Growth Trends
2.1 Global AI-Powered App Development and Digital IT Solutions Market Perspective (2021–2032)
2.2 Global AI-Powered App Development and Digital IT Solutions Growth Trends by Region
2.2.1 Global AI-Powered App Development and Digital IT Solutions Market Size by Region: 2021 vs 2025 vs 2032
2.2.2 AI-Powered App Development and Digital IT Solutions Historic Market Size by Region (2021–2026)
2.2.3 AI-Powered App Development and Digital IT Solutions Forecasted Market Size by Region (2027–2032)
2.3 AI-Powered App Development and Digital IT Solutions Market Dynamics
2.3.1 AI-Powered App Development and Digital IT Solutions Industry Trends
2.3.2 AI-Powered App Development and Digital IT Solutions Market Drivers
2.3.3 AI-Powered App Development and Digital IT Solutions Market Challenges
2.3.4 AI-Powered App Development and Digital IT Solutions Market Restraints
3 Competition Landscape by Key Players
3.1 Global Top AI-Powered App Development and Digital IT Solutions Players by Revenue
3.1.1 Global Top AI-Powered App Development and Digital IT Solutions Players by Revenue (2021–2026)
3.1.2 Global AI-Powered App Development and Digital IT Solutions Revenue Market Share by Players (2021–2026)
3.2 Global Top AI-Powered App Development and Digital IT Solutions Players Market Share by Company Tier (Tier 1, Tier 2, Tier 3)
3.3 Global Key Players Ranking by AI-Powered App Development and Digital IT Solutions Revenue
3.4 Global AI-Powered App Development and Digital IT Solutions Market Concentration Ratio
3.4.1 Global AI-Powered App Development and Digital IT Solutions Market Concentration Ratio (CR5 and HHI)
3.4.2 Global Top 10 and Top 5 Companies by AI-Powered App Development and Digital IT Solutions Revenue in 2025
3.5 Global Key Players of AI-Powered App Development and Digital IT Solutions Head Offices and Areas Served
3.6 Global Key Players of AI-Powered App Development and Digital IT Solutions, Products and Applications
3.7 Global Key Players of AI-Powered App Development and Digital IT Solutions, Date of General Availability (GA)
3.8 Mergers and Acquisitions, Expansion Plans
4 AI-Powered App Development and Digital IT Solutions Breakdown Data by Type
4.1 Global AI-Powered App Development and Digital IT Solutions Historic Market Size by Type (2021–2026)
4.2 Global AI-Powered App Development and Digital IT Solutions Forecasted Market Size by Type (2027–2032)
5 AI-Powered App Development and Digital IT Solutions Breakdown Data by Application
5.1 Global AI-Powered App Development and Digital IT Solutions Historic Market Size by Application (2021–2026)
5.2 Global AI-Powered App Development and Digital IT Solutions Forecasted Market Size by Application (2027–2032)
6 North America
6.1 North America AI-Powered App Development and Digital IT Solutions Market Size (2021–2032)
6.2 North America AI-Powered App Development and Digital IT Solutions Market Growth Rate by Country: 2021 vs 2025 vs 2032
6.3 North America AI-Powered App Development and Digital IT Solutions Market Size by Country (2021–2026)
6.4 North America AI-Powered App Development and Digital IT Solutions Market Size by Country (2027–2032)
6.5 United States
6.6 Canada
7 Europe
7.1 Europe AI-Powered App Development and Digital IT Solutions Market Size (2021–2032)
7.2 Europe AI-Powered App Development and Digital IT Solutions Market Growth Rate by Country: 2021 vs 2025 vs 2032
7.3 Europe AI-Powered App Development and Digital IT Solutions Market Size by Country (2021–2026)
7.4 Europe AI-Powered App Development and Digital IT Solutions Market Size by Country (2027–2032)
7.5 Germany
7.6 France
7.7 U.K.
7.8 Italy
7.9 Russia
7.10 Ireland
8 Asia-Pacific
8.1 Asia-Pacific AI-Powered App Development and Digital IT Solutions Market Size (2021–2032)
8.2 Asia-Pacific AI-Powered App Development and Digital IT Solutions Market Growth Rate by Region: 2021 vs 2025 vs 2032
8.3 Asia-Pacific AI-Powered App Development and Digital IT Solutions Market Size by Region (2021–2026)
8.4 Asia-Pacific AI-Powered App Development and Digital IT Solutions Market Size by Region (2027–2032)
8.5 China
8.6 Japan
8.7 South Korea
8.8 Southeast Asia
8.9 India
8.10 Australia & New Zealand
9 Latin America
9.1 Latin America AI-Powered App Development and Digital IT Solutions Market Size (2021–2032)
9.2 Latin America AI-Powered App Development and Digital IT Solutions Market Growth Rate by Country: 2021 vs 2025 vs 2032
9.3 Latin America AI-Powered App Development and Digital IT Solutions Market Size by Country (2021–2026)
9.4 Latin America AI-Powered App Development and Digital IT Solutions Market Size by Country (2027–2032)
9.5 Mexico
9.6 Brazil
10 Middle East & Africa
10.1 Middle East & Africa AI-Powered App Development and Digital IT Solutions Market Size (2021–2032)
10.2 Middle East & Africa AI-Powered App Development and Digital IT Solutions Market Growth Rate by Country: 2021 vs 2025 vs 2032
10.3 Middle East & Africa AI-Powered App Development and Digital IT Solutions Market Size by Country (2021–2026)
10.4 Middle East & Africa AI-Powered App Development and Digital IT Solutions Market Size by Country (2027–2032)
10.5 Israel
10.6 Saudi Arabia
10.7 UAE
11 Key Players Profiles
11.1 The Distance
11.1.1 The Distance Company Details
11.1.2 The Distance Business Overview
11.1.3 The Distance AI-Powered App Development and Digital IT Solutions Introduction
11.1.4 The Distance Revenue in AI-Powered App Development and Digital IT Solutions Business (2021–2026)
11.1.5 The Distance Recent Development
11.2 Prismmetric
11.2.1 Prismmetric Company Details
11.2.2 Prismmetric Business Overview
11.2.3 Prismmetric AI-Powered App Development and Digital IT Solutions Introduction
11.2.4 Prismmetric Revenue in AI-Powered App Development and Digital IT Solutions Business (2021–2026)
11.2.5 Prismmetric Recent Development
11.3 Sparx IT Solutions
11.3.1 Sparx IT Solutions Company Details
11.3.2 Sparx IT Solutions Business Overview
11.3.3 Sparx IT Solutions AI-Powered App Development and Digital IT Solutions Introduction
11.3.4 Sparx IT Solutions Revenue in AI-Powered App Development and Digital IT Solutions Business (2021–2026)
11.3.5 Sparx IT Solutions Recent Development
11.4 MindInventory
11.4.1 MindInventory Company Details
11.4.2 MindInventory Business Overview
11.4.3 MindInventory AI-Powered App Development and Digital IT Solutions Introduction
11.4.4 MindInventory Revenue in AI-Powered App Development and Digital IT Solutions Business (2021–2026)
11.4.5 MindInventory Recent Development
11.5 Appinventiv
11.5.1 Appinventiv Company Details
11.5.2 Appinventiv Business Overview
11.5.3 Appinventiv AI-Powered App Development and Digital IT Solutions Introduction
11.5.4 Appinventiv Revenue in AI-Powered App Development and Digital IT Solutions Business (2021–2026)
11.5.5 Appinventiv Recent Development
11.6 Orange Mantra
11.6.1 Orange Mantra Company Details
11.6.2 Orange Mantra Business Overview
11.6.3 Orange Mantra AI-Powered App Development and Digital IT Solutions Introduction
11.6.4 Orange Mantra Revenue in AI-Powered App Development and Digital IT Solutions Business (2021–2026)
11.6.5 Orange Mantra Recent Development
11.7 Emizentech
11.7.1 Emizentech Company Details
11.7.2 Emizentech Business Overview
11.7.3 Emizentech AI-Powered App Development and Digital IT Solutions Introduction
11.7.4 Emizentech Revenue in AI-Powered App Development and Digital IT Solutions Business (2021–2026)
11.7.5 Emizentech Recent Development
11.8 Microsoft
11.8.1 Microsoft Company Details
11.8.2 Microsoft Business Overview
11.8.3 Microsoft AI-Powered App Development and Digital IT Solutions Introduction
11.8.4 Microsoft Revenue in AI-Powered App Development and Digital IT Solutions Business (2021–2026)
11.8.5 Microsoft Recent Development
11.9 MobileCoderz
11.9.1 MobileCoderz Company Details
11.9.2 MobileCoderz Business Overview
11.9.3 MobileCoderz AI-Powered App Development and Digital IT Solutions Introduction
11.9.4 MobileCoderz Revenue in AI-Powered App Development and Digital IT Solutions Business (2021–2026)
11.9.5 MobileCoderz Recent Development
11.10 BigOhTech
11.10.1 BigOhTech Company Details
11.10.2 BigOhTech Business Overview
11.10.3 BigOhTech AI-Powered App Development and Digital IT Solutions Introduction
11.10.4 BigOhTech Revenue in AI-Powered App Development and Digital IT Solutions Business (2021–2026)
11.10.5 BigOhTech Recent Development
11.11 DianApps
11.11.1 DianApps Company Details
11.11.2 DianApps Business Overview
11.11.3 DianApps AI-Powered App Development and Digital IT Solutions Introduction
11.11.4 DianApps Revenue in AI-Powered App Development and Digital IT Solutions Business (2021–2026)
11.11.5 DianApps Recent Development
11.12 Matellio
11.12.1 Matellio Company Details
11.12.2 Matellio Business Overview
11.12.3 Matellio AI-Powered App Development and Digital IT Solutions Introduction
11.12.4 Matellio Revenue in AI-Powered App Development and Digital IT Solutions Business (2021–2026)
11.12.5 Matellio Recent Development
11.13 Andersen Lab
11.13.1 Andersen Lab Company Details
11.13.2 Andersen Lab Business Overview
11.13.3 Andersen Lab AI-Powered App Development and Digital IT Solutions Introduction
11.13.4 Andersen Lab Revenue in AI-Powered App Development and Digital IT Solutions Business (2021–2026)
11.13.5 Andersen Lab Recent Development
11.14 Guru TechnoLabs
11.14.1 Guru TechnoLabs Company Details
11.14.2 Guru TechnoLabs Business Overview
11.14.3 Guru TechnoLabs AI-Powered App Development and Digital IT Solutions Introduction
11.14.4 Guru TechnoLabs Revenue in AI-Powered App Development and Digital IT Solutions Business (2021–2026)
11.14.5 Guru TechnoLabs Recent Development
11.15 Mbicycle
11.15.1 Mbicycle Company Details
11.15.2 Mbicycle Business Overview
11.15.3 Mbicycle AI-Powered App Development and Digital IT Solutions Introduction
11.15.4 Mbicycle Revenue in AI-Powered App Development and Digital IT Solutions Business (2021–2026)
11.15.5 Mbicycle Recent Development
11.16 Nevina Infotech
11.16.1 Nevina Infotech Company Details
11.16.2 Nevina Infotech Business Overview
11.16.3 Nevina Infotech AI-Powered App Development and Digital IT Solutions Introduction
11.16.4 Nevina Infotech Revenue in AI-Powered App Development and Digital IT Solutions Business (2021–2026)
11.16.5 Nevina Infotech Recent Development
11.17 PNDigital
11.17.1 PNDigital Company Details
11.17.2 PNDigital Business Overview
11.17.3 PNDigital AI-Powered App Development and Digital IT Solutions Introduction
11.17.4 PNDigital Revenue in AI-Powered App Development and Digital IT Solutions Business (2021–2026)
11.17.5 PNDigital Recent Development
11.18 Folio3 AI
11.18.1 Folio3 AI Company Details
11.18.2 Folio3 AI Business Overview
11.18.3 Folio3 AI AI-Powered App Development and Digital IT Solutions Introduction
11.18.4 Folio3 AI Revenue in AI-Powered App Development and Digital IT Solutions Business (2021–2026)
11.18.5 Folio3 AI Recent Development
11.19 Riseup Labs
11.19.1 Riseup Labs Company Details
11.19.2 Riseup Labs Business Overview
11.19.3 Riseup Labs AI-Powered App Development and Digital IT Solutions Introduction
11.19.4 Riseup Labs Revenue in AI-Powered App Development and Digital IT Solutions Business (2021–2026)
11.19.5 Riseup Labs Recent Development
11.20 AppsChopper
11.20.1 AppsChopper Company Details
11.20.2 AppsChopper Business Overview
11.20.3 AppsChopper AI-Powered App Development and Digital IT Solutions Introduction
11.20.4 AppsChopper Revenue in AI-Powered App Development and Digital IT Solutions Business (2021–2026)
11.20.5 AppsChopper Recent Development
11.21 EvinceDev
11.21.1 EvinceDev Company Details
11.21.2 EvinceDev Business Overview
11.21.3 EvinceDev AI-Powered App Development and Digital IT Solutions Introduction
11.21.4 EvinceDev Revenue in AI-Powered App Development and Digital IT Solutions Business (2021–2026)
11.21.5 EvinceDev Recent Development
11.22 Flatworld Solutions
11.22.1 Flatworld Solutions Company Details
11.22.2 Flatworld Solutions Business Overview
11.22.3 Flatworld Solutions AI-Powered App Development and Digital IT Solutions Introduction
11.22.4 Flatworld Solutions Revenue in AI-Powered App Development and Digital IT Solutions Business (2021–2026)
11.22.5 Flatworld Solutions Recent Development
11.23 SysBunny
11.23.1 SysBunny Company Details
11.23.2 SysBunny Business Overview
11.23.3 SysBunny AI-Powered App Development and Digital IT Solutions Introduction
11.23.4 SysBunny Revenue in AI-Powered App Development and Digital IT Solutions Business (2021–2026)
11.23.5 SysBunny Recent Development
11.24 GoodFirms
11.24.1 GoodFirms Company Details
11.24.2 GoodFirms Business Overview
11.24.3 GoodFirms AI-Powered App Development and Digital IT Solutions Introduction
11.24.4 GoodFirms Revenue in AI-Powered App Development and Digital IT Solutions Business (2021–2026)
11.24.5 GoodFirms Recent Development
11.25 SemiDot
11.25.1 SemiDot Company Details
11.25.2 SemiDot Business Overview
11.25.3 SemiDot AI-Powered App Development and Digital IT Solutions Introduction
11.25.4 SemiDot Revenue in AI-Powered App Development and Digital IT Solutions Business (2021–2026)
11.25.5 SemiDot Recent Development
11.26 BLE Mobile App
11.26.1 BLE Mobile App Company Details
11.26.2 BLE Mobile App Business Overview
11.26.3 BLE Mobile App AI-Powered App Development and Digital IT Solutions Introduction
11.26.4 BLE Mobile App Revenue in AI-Powered App Development and Digital IT Solutions Business (2021–2026)
11.26.5 BLE Mobile App Recent Development
11.27 Hidden Brains
11.27.1 Hidden Brains Company Details
11.27.2 Hidden Brains Business Overview
11.27.3 Hidden Brains AI-Powered App Development and Digital IT Solutions Introduction
11.27.4 Hidden Brains Revenue in AI-Powered App Development and Digital IT Solutions Business (2021–2026)
11.27.5 Hidden Brains Recent Development
11.28 Saffron Tech
11.28.1 Saffron Tech Company Details
11.28.2 Saffron Tech Business Overview
11.28.3 Saffron Tech AI-Powered App Development and Digital IT Solutions Introduction
11.28.4 Saffron Tech Revenue in AI-Powered App Development and Digital IT Solutions Business (2021–2026)
11.28.5 Saffron Tech Recent Development
11.29 Zfort Group
11.29.1 Zfort Group Company Details
11.29.2 Zfort Group Business Overview
11.29.3 Zfort Group AI-Powered App Development and Digital IT Solutions Introduction
11.29.4 Zfort Group Revenue in AI-Powered App Development and Digital IT Solutions Business (2021–2026)
11.29.5 Zfort Group Recent Development
11.30 Octal
11.30.1 Octal Company Details
11.30.2 Octal Business Overview
11.30.3 Octal AI-Powered App Development and Digital IT Solutions Introduction
11.30.4 Octal Revenue in AI-Powered App Development and Digital IT Solutions Business (2021–2026)
11.30.5 Octal Recent Development
11.31 Excellent Webworld
11.31.1 Excellent Webworld Company Details
11.31.2 Excellent Webworld Business Overview
11.31.3 Excellent Webworld AI-Powered App Development and Digital IT Solutions Introduction
11.31.4 Excellent Webworld Revenue in AI-Powered App Development and Digital IT Solutions Business (2021–2026)
11.31.5 Excellent Webworld Recent Development
11.32 Day One
11.32.1 Day One Company Details
11.32.2 Day One Business Overview
11.32.3 Day One AI-Powered App Development and Digital IT Solutions Introduction
11.32.4 Day One Revenue in AI-Powered App Development and Digital IT Solutions Business (2021–2026)
11.32.5 Day One Recent Development
11.33 Appsnado
11.33.1 Appsnado Company Details
11.33.2 Appsnado Business Overview
11.33.3 Appsnado AI-Powered App Development and Digital IT Solutions Introduction
11.33.4 Appsnado Revenue in AI-Powered App Development and Digital IT Solutions Business (2021–2026)
11.33.5 Appsnado Recent Development
11.34 Peerbits
11.34.1 Peerbits Company Details
11.34.2 Peerbits Business Overview
11.34.3 Peerbits AI-Powered App Development and Digital IT Solutions Introduction
11.34.4 Peerbits Revenue in AI-Powered App Development and Digital IT Solutions Business (2021–2026)
11.34.5 Peerbits Recent Development
11.35 APPSTIRR
11.35.1 APPSTIRR Company Details
11.35.2 APPSTIRR Business Overview
11.35.3 APPSTIRR AI-Powered App Development and Digital IT Solutions Introduction
11.35.4 APPSTIRR Revenue in AI-Powered App Development and Digital IT Solutions Business (2021–2026)
11.35.5 APPSTIRR Recent Development
11.36 Tekrevol
11.36.1 Tekrevol Company Details
11.36.2 Tekrevol Business Overview
11.36.3 Tekrevol AI-Powered App Development and Digital IT Solutions Introduction
11.36.4 Tekrevol Revenue in AI-Powered App Development and Digital IT Solutions Business (2021–2026)
11.36.5 Tekrevol Recent Development
11.37 Dreamsoft4u
11.37.1 Dreamsoft4u Company Details
11.37.2 Dreamsoft4u Business Overview
11.37.3 Dreamsoft4u AI-Powered App Development and Digital IT Solutions Introduction
11.37.4 Dreamsoft4u Revenue in AI-Powered App Development and Digital IT Solutions Business (2021–2026)
11.37.5 Dreamsoft4u Recent Development
11.38 Weelorum
11.38.1 Weelorum Company Details
11.38.2 Weelorum Business Overview
11.38.3 Weelorum AI-Powered App Development and Digital IT Solutions Introduction
11.38.4 Weelorum Revenue in AI-Powered App Development and Digital IT Solutions Business (2021–2026)
11.38.5 Weelorum Recent Development
11.39 Fexle Services
11.39.1 Fexle Services Company Details
11.39.2 Fexle Services Business Overview
11.39.3 Fexle Services AI-Powered App Development and Digital IT Solutions Introduction
11.39.4 Fexle Services Revenue in AI-Powered App Development and Digital IT Solutions Business (2021–2026)
11.39.5 Fexle Services Recent Development
11.40 Softwareistic
11.40.1 Softwareistic Company Details
11.40.2 Softwareistic Business Overview
11.40.3 Softwareistic AI-Powered App Development and Digital IT Solutions Introduction
11.40.4 Softwareistic Revenue in AI-Powered App Development and Digital IT Solutions Business (2021–2026)
11.40.5 Softwareistic Recent Development
12 Analyst's Viewpoints/Conclusions
13 Appendix
13.1 Research Methodology
13.1.1 Methodology/Research Approach
13.1.1.1 Research Programs/Design
13.1.1.2 Market Size Estimation
13.1.1.3 Market Breakdown and Data Triangulation
13.1.2 Data Source
13.1.2.1 Secondary Sources
13.1.2.2 Primary Sources
13.2 Author Details
13.3 Disclaimer
List of Tables
 Table 1. Global AI-Powered App Development and Digital IT Solutions Market Size Growth Rate by Type (US$ Million): 2021 vs 2025 vs 2032
 Table 2. Key Players of Cloud-Based AI Solutions
 Table 3. Key Players of On-Premises AI Solutions
 Table 4. Key Players of Hybrid AI Solutions
 Table 5. Key Players of Edge AI Solutions
 Table 6. Global AI-Powered App Development and Digital IT Solutions Market Size Growth Rate by AI Capability Focus (US$ Million): 2021 vs 2025 vs 2032
 Table 7. Key Players of Conversational AI Solutions
 Table 8. Key Players of Predictive Analytics Solutions
 Table 9. Key Players of Computer Vision Solutions
 Table 10. Key Players of Generative AI Solutions
 Table 11. Key Players of Intelligent Process Automation (IPA) Solutions
 Table 12. Global AI-Powered App Development and Digital IT Solutions Market Size Growth by Application (US$ Million): 2021 vs 2025 vs 2032
 Table 13. Global AI-Powered App Development and Digital IT Solutions Market Size by Region (US$ Million): 2021 vs 2025 vs 2032
 Table 14. Global AI-Powered App Development and Digital IT Solutions Market Size by Region (US$ Million), 2021–2026
 Table 15. Global AI-Powered App Development and Digital IT Solutions Market Share by Region (2021–2026)
 Table 16. Global AI-Powered App Development and Digital IT Solutions Forecasted Market Size by Region (US$ Million), 2027–2032
 Table 17. Global AI-Powered App Development and Digital IT Solutions Market Share by Region (2027–2032)
 Table 18. AI-Powered App Development and Digital IT Solutions Market Trends
 Table 19. AI-Powered App Development and Digital IT Solutions Market Drivers
 Table 20. AI-Powered App Development and Digital IT Solutions Market Challenges
 Table 21. AI-Powered App Development and Digital IT Solutions Market Restraints
 Table 22. Global AI-Powered App Development and Digital IT Solutions Revenue by Players (US$ Million), 2021–2026
 Table 23. Global AI-Powered App Development and Digital IT Solutions Market Share by Players (2021–2026)
 Table 24. Global Top AI-Powered App Development and Digital IT Solutions Players by Tier (Tier 1, Tier 2, and Tier 3), based on AI-Powered App Development and Digital IT Solutions Revenue, 2025
 Table 25. Ranking of Global Top AI-Powered App Development and Digital IT Solutions Companies by Revenue (US$ Million) in 2025
 Table 26. Global 5 Largest Players Market Share by AI-Powered App Development and Digital IT Solutions Revenue (CR5 and HHI), 2021–2026
 Table 27. Global Key Players of AI-Powered App Development and Digital IT Solutions, Headquarters and Area Served
 Table 28. Global Key Players of AI-Powered App Development and Digital IT Solutions, Products and Applications
 Table 29. Global Key Players of AI-Powered App Development and Digital IT Solutions, Date of General Availability (GA)
 Table 30. Mergers and Acquisitions, Expansion Plans
 Table 31. Global AI-Powered App Development and Digital IT Solutions Market Size by Type (US$ Million), 2021–2026
 Table 32. Global AI-Powered App Development and Digital IT Solutions Revenue Market Share by Type (2021–2026)
 Table 33. Global AI-Powered App Development and Digital IT Solutions Forecasted Market Size by Type (US$ Million), 2027–2032
 Table 34. Global AI-Powered App Development and Digital IT Solutions Revenue Market Share by Type (2027–2032)
 Table 35. Global AI-Powered App Development and Digital IT Solutions Market Size by Application (US$ Million), 2021–2026
 Table 36. Global AI-Powered App Development and Digital IT Solutions Revenue Market Share by Application (2021–2026)
 Table 37. Global AI-Powered App Development and Digital IT Solutions Forecasted Market Size by Application (US$ Million), 2027–2032
 Table 38. Global AI-Powered App Development and Digital IT Solutions Revenue Market Share by Application (2027–2032)
 Table 39. North America AI-Powered App Development and Digital IT Solutions Market Size Growth Rate by Country (US$ Million): 2021 vs 2025 vs 2032
 Table 40. North America AI-Powered App Development and Digital IT Solutions Market Size by Country (US$ Million), 2021–2026
 Table 41. North America AI-Powered App Development and Digital IT Solutions Market Size by Country (US$ Million), 2027–2032
 Table 42. Europe AI-Powered App Development and Digital IT Solutions Market Size Growth Rate by Country (US$ Million): 2021 vs 2025 vs 2032
 Table 43. Europe AI-Powered App Development and Digital IT Solutions Market Size by Country (US$ Million), 2021–2026
 Table 44. Europe AI-Powered App Development and Digital IT Solutions Market Size by Country (US$ Million), 2027–2032
 Table 45. Asia-Pacific AI-Powered App Development and Digital IT Solutions Market Size Growth Rate by Region (US$ Million): 2021 vs 2025 vs 2032
 Table 46. Asia-Pacific AI-Powered App Development and Digital IT Solutions Market Size by Region (US$ Million), 2021–2026
 Table 47. Asia-Pacific AI-Powered App Development and Digital IT Solutions Market Size by Region (US$ Million), 2027–2032
 Table 48. Latin America AI-Powered App Development and Digital IT Solutions Market Size Growth Rate by Country (US$ Million): 2021 vs 2025 vs 2032
 Table 49. Latin America AI-Powered App Development and Digital IT Solutions Market Size by Country (US$ Million), 2021–2026
 Table 50. Latin America AI-Powered App Development and Digital IT Solutions Market Size by Country (US$ Million), 2027–2032
 Table 51. Middle East & Africa AI-Powered App Development and Digital IT Solutions Market Size Growth Rate by Country (US$ Million): 2021 vs 2025 vs 2032
 Table 52. Middle East & Africa AI-Powered App Development and Digital IT Solutions Market Size by Country (US$ Million), 2021–2026
 Table 53. Middle East & Africa AI-Powered App Development and Digital IT Solutions Market Size by Country (US$ Million), 2027–2032
 Table 54. The Distance Company Details
 Table 55. The Distance Business Overview
 Table 56. The Distance AI-Powered App Development and Digital IT Solutions Product
 Table 57. The Distance Revenue in AI-Powered App Development and Digital IT Solutions Business (US$ Million), 2021–2026
 Table 58. The Distance Recent Development
 Table 59. Prismmetric Company Details
 Table 60. Prismmetric Business Overview
 Table 61. Prismmetric AI-Powered App Development and Digital IT Solutions Product
 Table 62. Prismmetric Revenue in AI-Powered App Development and Digital IT Solutions Business (US$ Million), 2021–2026
 Table 63. Prismmetric Recent Development
 Table 64. Sparx IT Solutions Company Details
 Table 65. Sparx IT Solutions Business Overview
 Table 66. Sparx IT Solutions AI-Powered App Development and Digital IT Solutions Product
 Table 67. Sparx IT Solutions Revenue in AI-Powered App Development and Digital IT Solutions Business (US$ Million), 2021–2026
 Table 68. Sparx IT Solutions Recent Development
 Table 69. MindInventory Company Details
 Table 70. MindInventory Business Overview
 Table 71. MindInventory AI-Powered App Development and Digital IT Solutions Product
 Table 72. MindInventory Revenue in AI-Powered App Development and Digital IT Solutions Business (US$ Million), 2021–2026
 Table 73. MindInventory Recent Development
 Table 74. Appinventiv Company Details
 Table 75. Appinventiv Business Overview
 Table 76. Appinventiv AI-Powered App Development and Digital IT Solutions Product
 Table 77. Appinventiv Revenue in AI-Powered App Development and Digital IT Solutions Business (US$ Million), 2021–2026
 Table 78. Appinventiv Recent Development
 Table 79. Orange Mantra Company Details
 Table 80. Orange Mantra Business Overview
 Table 81. Orange Mantra AI-Powered App Development and Digital IT Solutions Product
 Table 82. Orange Mantra Revenue in AI-Powered App Development and Digital IT Solutions Business (US$ Million), 2021–2026
 Table 83. Orange Mantra Recent Development
 Table 84. Emizentech Company Details
 Table 85. Emizentech Business Overview
 Table 86. Emizentech AI-Powered App Development and Digital IT Solutions Product
 Table 87. Emizentech Revenue in AI-Powered App Development and Digital IT Solutions Business (US$ Million), 2021–2026
 Table 88. Emizentech Recent Development
 Table 89. Microsoft Company Details
 Table 90. Microsoft Business Overview
 Table 91. Microsoft AI-Powered App Development and Digital IT Solutions Product
 Table 92. Microsoft Revenue in AI-Powered App Development and Digital IT Solutions Business (US$ Million), 2021–2026
 Table 93. Microsoft Recent Development
 Table 94. MobileCoderz Company Details
 Table 95. MobileCoderz Business Overview
 Table 96. MobileCoderz AI-Powered App Development and Digital IT Solutions Product
 Table 97. MobileCoderz Revenue in AI-Powered App Development and Digital IT Solutions Business (US$ Million), 2021–2026
 Table 98. MobileCoderz Recent Development
 Table 99. BigOhTech Company Details
 Table 100. BigOhTech Business Overview
 Table 101. BigOhTech AI-Powered App Development and Digital IT Solutions Product
 Table 102. BigOhTech Revenue in AI-Powered App Development and Digital IT Solutions Business (US$ Million), 2021–2026
 Table 103. BigOhTech Recent Development
 Table 104. DianApps Company Details
 Table 105. DianApps Business Overview
 Table 106. DianApps AI-Powered App Development and Digital IT Solutions Product
 Table 107. DianApps Revenue in AI-Powered App Development and Digital IT Solutions Business (US$ Million), 2021–2026
 Table 108. DianApps Recent Development
 Table 109. Matellio Company Details
 Table 110. Matellio Business Overview
 Table 111. Matellio AI-Powered App Development and Digital IT Solutions Product
 Table 112. Matellio Revenue in AI-Powered App Development and Digital IT Solutions Business (US$ Million), 2021–2026
 Table 113. Matellio Recent Development
 Table 114. Andersen Lab Company Details
 Table 115. Andersen Lab Business Overview
 Table 116. Andersen Lab AI-Powered App Development and Digital IT Solutions Product
 Table 117. Andersen Lab Revenue in AI-Powered App Development and Digital IT Solutions Business (US$ Million), 2021–2026
 Table 118. Andersen Lab Recent Development
 Table 119. Guru TechnoLabs Company Details
 Table 120. Guru TechnoLabs Business Overview
 Table 121. Guru TechnoLabs AI-Powered App Development and Digital IT Solutions Product
 Table 122. Guru TechnoLabs Revenue in AI-Powered App Development and Digital IT Solutions Business (US$ Million), 2021–2026
 Table 123. Guru TechnoLabs Recent Development
 Table 124. Mbicycle Company Details
 Table 125. Mbicycle Business Overview
 Table 126. Mbicycle AI-Powered App Development and Digital IT Solutions Product
 Table 127. Mbicycle Revenue in AI-Powered App Development and Digital IT Solutions Business (US$ Million), 2021–2026
 Table 128. Mbicycle Recent Development
 Table 129. Nevina Infotech Company Details
 Table 130. Nevina Infotech Business Overview
 Table 131. Nevina Infotech AI-Powered App Development and Digital IT Solutions Product
 Table 132. Nevina Infotech Revenue in AI-Powered App Development and Digital IT Solutions Business (US$ Million), 2021–2026
 Table 133. Nevina Infotech Recent Development
 Table 134. PNDigital Company Details
 Table 135. PNDigital Business Overview
 Table 136. PNDigital AI-Powered App Development and Digital IT Solutions Product
 Table 137. PNDigital Revenue in AI-Powered App Development and Digital IT Solutions Business (US$ Million), 2021–2026
 Table 138. PNDigital Recent Development
 Table 139. Folio3 AI Company Details
 Table 140. Folio3 AI Business Overview
 Table 141. Folio3 AI AI-Powered App Development and Digital IT Solutions Product
 Table 142. Folio3 AI Revenue in AI-Powered App Development and Digital IT Solutions Business (US$ Million), 2021–2026
 Table 143. Folio3 AI Recent Development
 Table 144. Riseup Labs Company Details
 Table 145. Riseup Labs Business Overview
 Table 146. Riseup Labs AI-Powered App Development and Digital IT Solutions Product
 Table 147. Riseup Labs Revenue in AI-Powered App Development and Digital IT Solutions Business (US$ Million), 2021–2026
 Table 148. Riseup Labs Recent Development
 Table 149. AppsChopper Company Details
 Table 150. AppsChopper Business Overview
 Table 151. AppsChopper AI-Powered App Development and Digital IT Solutions Product
 Table 152. AppsChopper Revenue in AI-Powered App Development and Digital IT Solutions Business (US$ Million), 2021–2026
 Table 153. AppsChopper Recent Development
 Table 154. EvinceDev Company Details
 Table 155. EvinceDev Business Overview
 Table 156. EvinceDev AI-Powered App Development and Digital IT Solutions Product
 Table 157. EvinceDev Revenue in AI-Powered App Development and Digital IT Solutions Business (US$ Million), 2021–2026
 Table 158. EvinceDev Recent Development
 Table 159. Flatworld Solutions Company Details
 Table 160. Flatworld Solutions Business Overview
 Table 161. Flatworld Solutions AI-Powered App Development and Digital IT Solutions Product
 Table 162. Flatworld Solutions Revenue in AI-Powered App Development and Digital IT Solutions Business (US$ Million), 2021–2026
 Table 163. Flatworld Solutions Recent Development
 Table 164. SysBunny Company Details
 Table 165. SysBunny Business Overview
 Table 166. SysBunny AI-Powered App Development and Digital IT Solutions Product
 Table 167. SysBunny Revenue in AI-Powered App Development and Digital IT Solutions Business (US$ Million), 2021–2026
 Table 168. SysBunny Recent Development
 Table 169. GoodFirms Company Details
 Table 170. GoodFirms Business Overview
 Table 171. GoodFirms AI-Powered App Development and Digital IT Solutions Product
 Table 172. GoodFirms Revenue in AI-Powered App Development and Digital IT Solutions Business (US$ Million), 2021–2026
 Table 173. GoodFirms Recent Development
 Table 174. SemiDot Company Details
 Table 175. SemiDot Business Overview
 Table 176. SemiDot AI-Powered App Development and Digital IT Solutions Product
 Table 177. SemiDot Revenue in AI-Powered App Development and Digital IT Solutions Business (US$ Million), 2021–2026
 Table 178. SemiDot Recent Development
 Table 179. BLE Mobile App Company Details
 Table 180. BLE Mobile App Business Overview
 Table 181. BLE Mobile App AI-Powered App Development and Digital IT Solutions Product
 Table 182. BLE Mobile App Revenue in AI-Powered App Development and Digital IT Solutions Business (US$ Million), 2021–2026
 Table 183. BLE Mobile App Recent Development
 Table 184. Hidden Brains Company Details
 Table 185. Hidden Brains Business Overview
 Table 186. Hidden Brains AI-Powered App Development and Digital IT Solutions Product
 Table 187. Hidden Brains Revenue in AI-Powered App Development and Digital IT Solutions Business (US$ Million), 2021–2026
 Table 188. Hidden Brains Recent Development
 Table 189. Saffron Tech Company Details
 Table 190. Saffron Tech Business Overview
 Table 191. Saffron Tech AI-Powered App Development and Digital IT Solutions Product
 Table 192. Saffron Tech Revenue in AI-Powered App Development and Digital IT Solutions Business (US$ Million), 2021–2026
 Table 193. Saffron Tech Recent Development
 Table 194. Zfort Group Company Details
 Table 195. Zfort Group Business Overview
 Table 196. Zfort Group AI-Powered App Development and Digital IT Solutions Product
 Table 197. Zfort Group Revenue in AI-Powered App Development and Digital IT Solutions Business (US$ Million), 2021–2026
 Table 198. Zfort Group Recent Development
 Table 199. Octal Company Details
 Table 200. Octal Business Overview
 Table 201. Octal AI-Powered App Development and Digital IT Solutions Product
 Table 202. Octal Revenue in AI-Powered App Development and Digital IT Solutions Business (US$ Million), 2021–2026
 Table 203. Octal Recent Development
 Table 204. Excellent Webworld Company Details
 Table 205. Excellent Webworld Business Overview
 Table 206. Excellent Webworld AI-Powered App Development and Digital IT Solutions Product
 Table 207. Excellent Webworld Revenue in AI-Powered App Development and Digital IT Solutions Business (US$ Million), 2021–2026
 Table 208. Excellent Webworld Recent Development
 Table 209. Day One Company Details
 Table 210. Day One Business Overview
 Table 211. Day One AI-Powered App Development and Digital IT Solutions Product
 Table 212. Day One Revenue in AI-Powered App Development and Digital IT Solutions Business (US$ Million), 2021–2026
 Table 213. Day One Recent Development
 Table 214. Appsnado Company Details
 Table 215. Appsnado Business Overview
 Table 216. Appsnado AI-Powered App Development and Digital IT Solutions Product
 Table 217. Appsnado Revenue in AI-Powered App Development and Digital IT Solutions Business (US$ Million), 2021–2026
 Table 218. Appsnado Recent Development
 Table 219. Peerbits Company Details
 Table 220. Peerbits Business Overview
 Table 221. Peerbits AI-Powered App Development and Digital IT Solutions Product
 Table 222. Peerbits Revenue in AI-Powered App Development and Digital IT Solutions Business (US$ Million), 2021–2026
 Table 223. Peerbits Recent Development
 Table 224. APPSTIRR Company Details
 Table 225. APPSTIRR Business Overview
 Table 226. APPSTIRR AI-Powered App Development and Digital IT Solutions Product
 Table 227. APPSTIRR Revenue in AI-Powered App Development and Digital IT Solutions Business (US$ Million), 2021–2026
 Table 228. APPSTIRR Recent Development
 Table 229. Tekrevol Company Details
 Table 230. Tekrevol Business Overview
 Table 231. Tekrevol AI-Powered App Development and Digital IT Solutions Product
 Table 232. Tekrevol Revenue in AI-Powered App Development and Digital IT Solutions Business (US$ Million), 2021–2026
 Table 233. Tekrevol Recent Development
 Table 234. Dreamsoft4u Company Details
 Table 235. Dreamsoft4u Business Overview
 Table 236. Dreamsoft4u AI-Powered App Development and Digital IT Solutions Product
 Table 237. Dreamsoft4u Revenue in AI-Powered App Development and Digital IT Solutions Business (US$ Million), 2021–2026
 Table 238. Dreamsoft4u Recent Development
 Table 239. Weelorum Company Details
 Table 240. Weelorum Business Overview
 Table 241. Weelorum AI-Powered App Development and Digital IT Solutions Product
 Table 242. Weelorum Revenue in AI-Powered App Development and Digital IT Solutions Business (US$ Million), 2021–2026
 Table 243. Weelorum Recent Development
 Table 244. Fexle Services Company Details
 Table 245. Fexle Services Business Overview
 Table 246. Fexle Services AI-Powered App Development and Digital IT Solutions Product
 Table 247. Fexle Services Revenue in AI-Powered App Development and Digital IT Solutions Business (US$ Million), 2021–2026
 Table 248. Fexle Services Recent Development
 Table 249. Softwareistic Company Details
 Table 250. Softwareistic Business Overview
 Table 251. Softwareistic AI-Powered App Development and Digital IT Solutions Product
 Table 252. Softwareistic Revenue in AI-Powered App Development and Digital IT Solutions Business (US$ Million), 2021–2026
 Table 253. Softwareistic Recent Development
 Table 254. Research Programs/Design for This Report
 Table 255. Key Data Information from Secondary Sources
 Table 256. Key Data Information from Primary Sources
 Table 257. Authors List of This Report


List of Figures
 Figure 1. AI-Powered App Development and Digital IT Solutions Picture
 Figure 2. Global AI-Powered App Development and Digital IT Solutions Market Size Comparison by Type (US$ Million), 2021–2032
 Figure 3. Global AI-Powered App Development and Digital IT Solutions Market Share by Type: 2025 vs 2032
 Figure 4. Cloud-Based AI Solutions Features
 Figure 5. On-Premises AI Solutions Features
 Figure 6. Hybrid AI Solutions Features
 Figure 7. Edge AI Solutions Features
 Figure 8. Global AI-Powered App Development and Digital IT Solutions Market Size Comparison by AI Capability Focus (US$ Million), 2021–2032
 Figure 9. Conversational AI Solutions Features
 Figure 10. Predictive Analytics Solutions Features
 Figure 11. Computer Vision Solutions Features
 Figure 12. Generative AI Solutions Features
 Figure 13. Intelligent Process Automation (IPA) Solutions Features
 Figure 14. Global AI-Powered App Development and Digital IT Solutions Market Size by Application (US$ Million), 2021–2032
 Figure 15. Global AI-Powered App Development and Digital IT Solutions Market Share by Application: 2025 vs 2032
 Figure 16. Healthcare Case Studies
 Figure 17. Finance Case Studies
 Figure 18. Retail & E-Commerce Case Studies
 Figure 19. Manufacturing Case Studies
 Figure 20. Enterprise IT Case Studies
 Figure 21. Others Case Studies
 Figure 22. AI-Powered App Development and Digital IT Solutions Report Years Considered
 Figure 23. Global AI-Powered App Development and Digital IT Solutions Market Size (US$ Million), Year-over-Year: 2021–2032
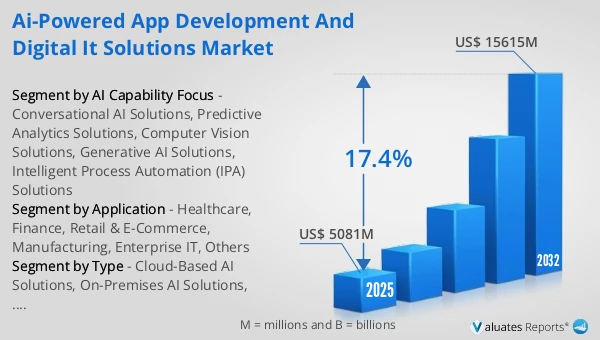
 Figure 24. Global AI-Powered App Development and Digital IT Solutions Market Size, (US$ Million), 2021 vs 2025 vs 2032
 Figure 25. Global AI-Powered App Development and Digital IT Solutions Market Share by Region: 2025 vs 2032
 Figure 26. Global AI-Powered App Development and Digital IT Solutions Market Share by Players in 2025
 Figure 27. Global AI-Powered App Development and Digital IT Solutions Market Share by Company Type (Tier 1, Tier 2, and Tier 3)
 Figure 28. The Top 10 and 5 Players Market Share by AI-Powered App Development and Digital IT Solutions Revenue in 2025
 Figure 29. North America AI-Powered App Development and Digital IT Solutions Market Size YoY Growth (US$ Million), 2021–2032
 Figure 30. North America AI-Powered App Development and Digital IT Solutions Market Share by Country (2021–2032)
 Figure 31. United States AI-Powered App Development and Digital IT Solutions Market Size YoY Growth (US$ Million), 2021–2032
 Figure 32. Canada AI-Powered App Development and Digital IT Solutions Market Size YoY Growth (US$ Million), 2021–2032
 Figure 33. Europe AI-Powered App Development and Digital IT Solutions Market Size YoY Growth (US$ Million), 2021–2032
 Figure 34. Europe AI-Powered App Development and Digital IT Solutions Market Share by Country (2021–2032)
 Figure 35. Germany AI-Powered App Development and Digital IT Solutions Market Size YoY Growth (US$ Million), 2021–2032
 Figure 36. France AI-Powered App Development and Digital IT Solutions Market Size YoY Growth (US$ Million), 2021–2032
 Figure 37. U.K. AI-Powered App Development and Digital IT Solutions Market Size YoY Growth (US$ Million), 2021–2032
 Figure 38. Italy AI-Powered App Development and Digital IT Solutions Market Size YoY Growth (US$ Million), 2021–2032
 Figure 39. Russia AI-Powered App Development and Digital IT Solutions Market Size YoY Growth (US$ Million), 2021–2032
 Figure 40. Ireland AI-Powered App Development and Digital IT Solutions Market Size YoY Growth (US$ Million), 2021–2032
 Figure 41. Asia-Pacific AI-Powered App Development and Digital IT Solutions Market Size YoY Growth (US$ Million), 2021–2032
 Figure 42. Asia-Pacific AI-Powered App Development and Digital IT Solutions Market Share by Region (2021–2032)
 Figure 43. China AI-Powered App Development and Digital IT Solutions Market Size YoY Growth (US$ Million), 2021–2032
 Figure 44. Japan AI-Powered App Development and Digital IT Solutions Market Size YoY Growth (US$ Million), 2021–2032
 Figure 45. South Korea AI-Powered App Development and Digital IT Solutions Market Size YoY Growth (US$ Million), 2021–2032
 Figure 46. Southeast Asia AI-Powered App Development and Digital IT Solutions Market Size YoY Growth (US$ Million), 2021–2032
 Figure 47. India AI-Powered App Development and Digital IT Solutions Market Size YoY Growth (US$ Million), 2021–2032
 Figure 48. Australia & New Zealand AI-Powered App Development and Digital IT Solutions Market Size YoY Growth (US$ Million), 2021–2032
 Figure 49. Latin America AI-Powered App Development and Digital IT Solutions Market Size YoY Growth (US$ Million), 2021–2032
 Figure 50. Latin America AI-Powered App Development and Digital IT Solutions Market Share by Country (2021–2032)
 Figure 51. Mexico AI-Powered App Development and Digital IT Solutions Market Size YoY Growth (US$ Million), 2021–2032
 Figure 52. Brazil AI-Powered App Development and Digital IT Solutions Market Size YoY Growth (US$ Million), 2021–2032
 Figure 53. Middle East & Africa AI-Powered App Development and Digital IT Solutions Market Size YoY Growth (US$ Million), 2021–2032
 Figure 54. Middle East & Africa AI-Powered App Development and Digital IT Solutions Market Share by Country (2021–2032)
 Figure 55. Israel AI-Powered App Development and Digital IT Solutions Market Size YoY Growth (US$ Million), 2021–2032
 Figure 56. Saudi Arabia AI-Powered App Development and Digital IT Solutions Market Size YoY Growth (US$ Million), 2021–2032
 Figure 57. UAE AI-Powered App Development and Digital IT Solutions Market Size YoY Growth (US$ Million), 2021–2032
 Figure 58. The Distance Revenue Growth Rate in AI-Powered App Development and Digital IT Solutions Business (2021–2026)
 Figure 59. Prismmetric Revenue Growth Rate in AI-Powered App Development and Digital IT Solutions Business (2021–2026)
 Figure 60. Sparx IT Solutions Revenue Growth Rate in AI-Powered App Development and Digital IT Solutions Business (2021–2026)
 Figure 61. MindInventory Revenue Growth Rate in AI-Powered App Development and Digital IT Solutions Business (2021–2026)
 Figure 62. Appinventiv Revenue Growth Rate in AI-Powered App Development and Digital IT Solutions Business (2021–2026)
 Figure 63. Orange Mantra Revenue Growth Rate in AI-Powered App Development and Digital IT Solutions Business (2021–2026)
 Figure 64. Emizentech Revenue Growth Rate in AI-Powered App Development and Digital IT Solutions Business (2021–2026)
 Figure 65. Microsoft Revenue Growth Rate in AI-Powered App Development and Digital IT Solutions Business (2021–2026)
 Figure 66. MobileCoderz Revenue Growth Rate in AI-Powered App Development and Digital IT Solutions Business (2021–2026)
 Figure 67. BigOhTech Revenue Growth Rate in AI-Powered App Development and Digital IT Solutions Business (2021–2026)
 Figure 68. DianApps Revenue Growth Rate in AI-Powered App Development and Digital IT Solutions Business (2021–2026)
 Figure 69. Matellio Revenue Growth Rate in AI-Powered App Development and Digital IT Solutions Business (2021–2026)
 Figure 70. Andersen Lab Revenue Growth Rate in AI-Powered App Development and Digital IT Solutions Business (2021–2026)
 Figure 71. Guru TechnoLabs Revenue Growth Rate in AI-Powered App Development and Digital IT Solutions Business (2021–2026)
 Figure 72. Mbicycle Revenue Growth Rate in AI-Powered App Development and Digital IT Solutions Business (2021–2026)
 Figure 73. Nevina Infotech Revenue Growth Rate in AI-Powered App Development and Digital IT Solutions Business (2021–2026)
 Figure 74. PNDigital Revenue Growth Rate in AI-Powered App Development and Digital IT Solutions Business (2021–2026)
 Figure 75. Folio3 AI Revenue Growth Rate in AI-Powered App Development and Digital IT Solutions Business (2021–2026)
 Figure 76. Riseup Labs Revenue Growth Rate in AI-Powered App Development and Digital IT Solutions Business (2021–2026)
 Figure 77. AppsChopper Revenue Growth Rate in AI-Powered App Development and Digital IT Solutions Business (2021–2026)
 Figure 78. EvinceDev Revenue Growth Rate in AI-Powered App Development and Digital IT Solutions Business (2021–2026)
 Figure 79. Flatworld Solutions Revenue Growth Rate in AI-Powered App Development and Digital IT Solutions Business (2021–2026)
 Figure 80. SysBunny Revenue Growth Rate in AI-Powered App Development and Digital IT Solutions Business (2021–2026)
 Figure 81. GoodFirms Revenue Growth Rate in AI-Powered App Development and Digital IT Solutions Business (2021–2026)
 Figure 82. SemiDot Revenue Growth Rate in AI-Powered App Development and Digital IT Solutions Business (2021–2026)
 Figure 83. BLE Mobile App Revenue Growth Rate in AI-Powered App Development and Digital IT Solutions Business (2021–2026)
 Figure 84. Hidden Brains Revenue Growth Rate in AI-Powered App Development and Digital IT Solutions Business (2021–2026)
 Figure 85. Saffron Tech Revenue Growth Rate in AI-Powered App Development and Digital IT Solutions Business (2021–2026)
 Figure 86. Zfort Group Revenue Growth Rate in AI-Powered App Development and Digital IT Solutions Business (2021–2026)
 Figure 87. Octal Revenue Growth Rate in AI-Powered App Development and Digital IT Solutions Business (2021–2026)
 Figure 88. Excellent Webworld Revenue Growth Rate in AI-Powered App Development and Digital IT Solutions Business (2021–2026)
 Figure 89. Day One Revenue Growth Rate in AI-Powered App Development and Digital IT Solutions Business (2021–2026)
 Figure 90. Appsnado Revenue Growth Rate in AI-Powered App Development and Digital IT Solutions Business (2021–2026)
 Figure 91. Peerbits Revenue Growth Rate in AI-Powered App Development and Digital IT Solutions Business (2021–2026)
 Figure 92. APPSTIRR Revenue Growth Rate in AI-Powered App Development and Digital IT Solutions Business (2021–2026)
 Figure 93. Tekrevol Revenue Growth Rate in AI-Powered App Development and Digital IT Solutions Business (2021–2026)
 Figure 94. Dreamsoft4u Revenue Growth Rate in AI-Powered App Development and Digital IT Solutions Business (2021–2026)
 Figure 95. Weelorum Revenue Growth Rate in AI-Powered App Development and Digital IT Solutions Business (2021–2026)
 Figure 96. Fexle Services Revenue Growth Rate in AI-Powered App Development and Digital IT Solutions Business (2021–2026)
 Figure 97. Softwareistic Revenue Growth Rate in AI-Powered App Development and Digital IT Solutions Business (2021–2026)
 Figure 98. Bottom-up and Top-down Approaches for This Report
 Figure 99. Data Triangulation
 Figure 100. Key Executives Interviewed
SELECT A FORMAT
Added to Cart
Electronic

$2900

Single User License
Electronic

$4350

Multi User License
Electronic

$5800

Enterprise License
Add to Cart
Buy Now (15% Discount)

OUR CUSTOMER

Samsung SD

SIMILAR REPORTS