
Polysilicon is a hyper pure form of silicon. It is multi-crystalline, high purity silicon, greater than 99.999% pure, used as the starting material for the growth of high purity single crystal silicon to be used for integrated circuits, other semiconductor devices, and solar cells. It is in the form of chunk, granular, powder and chip. Due to its semiconductor-like material properties, polysilicon is used as feedstock material in most solar energy applications.
Considering the economic change due to COVID-19 and Russia-Ukraine War Influence, the global Polysilicon market is projected to reach USD 21680 million by 2028 from an estimated USD 11720 million in 2022, at a CAGR of 10.8% during 2023 and 2028.
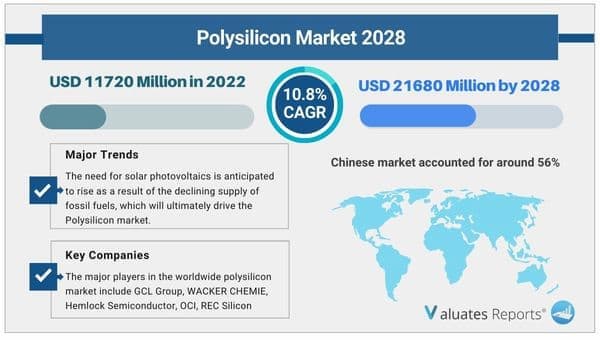
China is the largest consumption country of polysilicon in the world in the past few years and it will keep the same position in the next few years. The Chinese market took up about 56% the global market in 2015, followed by USA (18%), Europe and Korea are closely followed with the share about 7%.
GCL Group, WACKER CHEMIE, Hemlock Semiconductor, OCI, REC Silicon, TBEA, SunEdision, Sichuan Yongxiang, KCC and Tokuyama are the key suppliers in the global polysilicon market. Top four took up about 60% of the global market. GCL Group from China is the largest supplier over the world, while GCL Group, TBEA and Sichuan Yongxiang are the leading local supplier in China with the total local share of about 44%. Tokuyama is a leading supplier in Japan.
This report aims to provide a comprehensive presentation of the global market for Polysilicon, with both quantitative and qualitative analysis, to help readers develop business/growth strategies, assess the market competitive situation, analyse their position in the current marketplace, and make informed business decisions regarding Polysilicon.
The Polysilicon market size, estimations, and forecasts are provided in terms of sales volume (MT) and revenue ($ millions), considering 2021 as the base year, with history and forecast data for the period from 2017 to 2028. This report segments the global Polysilicon market comprehensively. Regional market sizes, concerning products by types, by application, and by players, are also provided. The influence of COVID-19 and the Russia-Ukraine War were considered while estimating market sizes.
For a more in-depth understanding of the market, the report provides profiles of the competitive landscape, key competitors, and their respective market ranks. The report also discusses technological trends and new product developments.
The report will help the Polysilicon manufacturers, new entrants, and industry chain related companies in this market with information on the revenues, sales volume, and average price for the overall market and the sub-segments across the different segments, by company, product type, application, and regions.
In this section, the readers will gain an understanding of the key players competing. This report has studied the key growth strategies, such as innovative trends and developments, intensification of product portfolio, mergers and acquisitions, collaborations, new product innovation, and geographical expansion, undertaken by these participants to maintain their presence. Apart from business strategies, the study includes current developments and key financials. The readers will also get access to the data related to global revenue, price, and sales by manufacturers for the period 2017-2022. This all-inclusive report will certainly serve the clients to stay updated and make effective decisions in their businesses. Some of the prominent players reviewed in the research report include:
Global markets are presented by Polysilicon type, along with growth forecasts through 2028. Estimates on sales and revenue are based on the price in the supply chain at which the Polysilicon are procured by the manufacturers.
This report has studied every segment and provided the market size using historical data. They have also talked about the growth opportunities that the segment may pose in the future. This study bestows sales and revenue data by type, and during the historical period (2017-2022) and forecast period (2023-2028).
This section of the report provides key insights regarding various regions and the key players operating in each region. Economic, social, environmental, technological, and political factors have been taken into consideration while assessing the growth of the particular region/country. The readers will also get their hands on the revenue and sales data of each region and country for the period 2017-2028.
The market has been segmented into various major geographies, including North America, Europe, Asia-Pacific, South America, Middle East & Africa. Detailed analysis of major countries such as the USA, Germany, the U.K., Italy, France, China, Japan, South Korea, Southeast Asia, and India will be covered within the regional segment. For market estimates, data are going to be provided for 2021 because of the base year, with estimates for 2022 and forecast revenue for 2028.
High-impact rendering factors and drivers have been studied in this report to aid the readers to understand the general development. Moreover, the report includes restraints and challenges that may act as stumbling blocks on the way of the players. This will assist the users to be attentive and make informed decisions related to business. Specialists have also laid their focus on the upcoming business prospects.
|
Report Metric |
Details |
|
Report Name |
Polysilicon Market |
|
Market size value in 2022 |
USD 11720 Million |
|
Revenue forecast in 2028 |
USD 21680 Million |
|
Growth Rate |
CAGR of 10.8% |
|
Base year considered |
2022 |
|
Forecast Period |
2023-2028 |
|
By Propulsion Type |
Solar Grade Polysilicon, Electronic Grade Polysilicon |
|
By Application |
Solar Photovoltaics (PV) Industry, Semiconductor Industry |
|
Report Coverage |
Revenue & volume forecast, company share, competitive landscape, growth factors, and trends |
|
Segments Covered |
By Type, Application, and Region |
|
Geographic Regions Covered |
North America, Europe, Asia Pacific, Latin America, Middle East & Africa |
Ans. Yes, we do provide the option to buy chapters in a report. We also can customize the report based on your specific requirements.
Ans. Considering the economic change due to COVID-19 and Russia-Ukraine War Influence, the global Polysilicon market is projected to reach US$ 21680 million by 2028 from an estimated US$ 11720 million in 2022, at a CAGR of 10.8% during 2023 and 2028.
Ans. Yes, the report includes a COVID-19 impact analysis. Also, it is further extended into every individual segment of the report.
List of Tables
Table 1. Global Polysilicon Market Size Growth Rate by Type (US$ Million): 2017 VS 2021 VS 2028
Table 2. Major Manufacturers of Solar Grade Polysilicon
Table 3. Major Manufacturers of Electronic Grade Polysilicon
Table 4. Global Polysilicon Market Size Growth by Application (US$ Million): 2017 VS 2021 VS 2028
Table 5. Global Polysilicon Market Size by Region (US$ Million): 2021 VS 2022 VS 2028
Table 6. Global Polysilicon Sales by Region (2017-2022) & (MT)
Table 7. Global Polysilicon Sales Forecast by Region (2023-2028) & (MT)
Table 8. Global Polysilicon Revenue by Region (2017-2022) & (US$ Million)
Table 9. Global Polysilicon Revenue Forecast by Region (2023-2028) & (US$ Million)
Table 10. Global Polysilicon Sales by Manufacturer (2017-2022) & (MT)
Table 11. Global Polysilicon Sales Share by Manufacturer (2017-2022)
Table 12. Polysilicon Revenue by Manufacturer (2017-2022) & (US$ Million)
Table 13. Polysilicon Revenue Share by Manufacturer (2017-2022)
Table 14. Key Manufacturers Polysilicon Price (2017-2022) & (USD/Kg)
Table 15. Ranking of Global Top Polysilicon Manufacturers by Revenue (US$ Million) in 2021
Table 16. Global Polysilicon Manufacturers Market Concentration Ratio (CR5 and HHI) & (2017-2022)
Table 17. Global Polysilicon by Company Type (Tier 1, Tier 2 and Tier 3) & (based on the Revenue in Polysilicon as of 2021)
Table 18. Polysilicon Manufacturers Manufacturing Base Distribution and Headquarters
Table 19. Manufacturers Polysilicon Product Type
Table 20. Date of International Manufacturers Enter into Polysilicon Market
Table 21. Manufacturers Mergers & Acquisitions, Expansion Plans
Table 22. GCL Group Corporation Information
Table 23. GCL Group Description and Business Overview
Table 24. GCL Group Polysilicon Sales (MT), Revenue (US$ Million), Price (USD/Kg) and Gross Margin (2017-2022)
Table 25. GCL Group Polysilicon Product
Table 26. GCL Group Polysilicon Sales Proportion of Polysilicon by Product in 2021
Table 27. GCL Group Polysilicon Sales Proportion of Polysilicon by Application in 2021
Table 28. GCL Group Polysilicon Sales Proportion of Polysilicon by Geographic Area in 2021
Table 29. GCL Group Recent Development
Table 30. WACKER CHEMIE Corporation Information
Table 31. WACKER CHEMIE Description and Business Overview
Table 32. WACKER CHEMIE Polysilicon Sales (MT), Revenue (US$ Million), Price (USD/Kg) and Gross Margin (2017-2022)
Table 33. WACKER CHEMIE Polysilicon Product
Table 34. WACKER CHEMIE Polysilicon Sales Proportion of Polysilicon by Product in 2021
Table 35. WACKER CHEMIE Polysilicon Sales Proportion of Polysilicon by Application in 2021
Table 36. WACKER CHEMIE Polysilicon Sales Proportion of Polysilicon by Geographic Area in 2021
Table 37. WACKER CHEMIE Recent Development
Table 38. Hemlock Semiconductor Corporation Information
Table 39. Hemlock Semiconductor Description and Business Overview
Table 40. Hemlock Semiconductor Polysilicon Sales (MT), Revenue (US$ Million), Price (USD/Kg) and Gross Margin (2017-2022)
Table 41. Hemlock Semiconductor Polysilicon Product
Table 42. Hemlock Semiconductor Polysilicon Sales Proportion of Polysilicon by Product in 2021
Table 43. Hemlock Semiconductor Polysilicon Sales Proportion of Polysilicon by Application in 2021
Table 44. Hemlock Semiconductor Polysilicon Sales Proportion of Polysilicon by Geographic Area in 2021
Table 45. Hemlock Semiconductor Recent Development
Table 46. OCI Corporation Information
Table 47. OCI Description and Business Overview
Table 48. OCI Polysilicon Sales (MT), Revenue (US$ Million), Price (USD/Kg) and Gross Margin (2017-2022)
Table 49. OCI Polysilicon Product
Table 50. OCI Polysilicon Sales Proportion of Polysilicon by Product in 2021
Table 51. OCI Polysilicon Sales Proportion of Polysilicon by Application in 2021
Table 52. OCI Polysilicon Sales Proportion of Polysilicon by Geographic Area in 2021
Table 53. OCI Recent Development
Table 54. REC Silicon Corporation Information
Table 55. REC Silicon Description and Business Overview
Table 56. REC Silicon Polysilicon Sales (MT), Revenue (US$ Million), Price (USD/Kg) and Gross Margin (2017-2022)
Table 57. REC Silicon Polysilicon Product
Table 58. REC Silicon Polysilicon Sales Proportion of Polysilicon by Product in 2021
Table 59. REC Silicon Polysilicon Sales Proportion of Polysilicon by Application in 2021
Table 60. REC Silicon Polysilicon Sales Proportion of Polysilicon by Geographic Area in 2021
Table 61. REC Silicon Recent Development
Table 62. TBEA Corporation Information
Table 63. TBEA Description and Business Overview
Table 64. TBEA Polysilicon Sales (MT), Revenue (US$ Million), Price (USD/Kg) and Gross Margin (2017-2022)
Table 65. TBEA Polysilicon Product
Table 66. TBEA Polysilicon Sales Proportion of Polysilicon by Product in 2021
Table 67. TBEA Polysilicon Sales Proportion of Polysilicon by Application in 2021
Table 68. TBEA Polysilicon Sales Proportion of Polysilicon by Geographic Area in 2021
Table 69. SunEdision Corporation Information
Table 70. SunEdision Description and Business Overview
Table 71. SunEdision Polysilicon Sales (MT), Revenue (US$ Million), Price (USD/Kg) and Gross Margin (2017-2022)
Table 72. SunEdision Polysilicon Product
Table 73. SunEdision Polysilicon Sales Proportion of Polysilicon by Product in 2021
Table 74. SunEdision Polysilicon Sales Proportion of Polysilicon by Application in 2021
Table 75. SunEdision Polysilicon Sales Proportion of Polysilicon by Geographic Area in 2021
Table 76. Sichuan Yongxiang Corporation Information
Table 77. Sichuan Yongxiang Description and Business Overview
Table 78. Sichuan Yongxiang Polysilicon Sales (MT), Revenue (US$ Million), Price (USD/Kg) and Gross Margin (2017-2022)
Table 79. Sichuan Yongxiang Polysilicon Product
Table 80. Sichuan Yongxiang Polysilicon Sales Proportion of Polysilicon by Product in 2021
Table 81. Sichuan Yongxiang Polysilicon Sales Proportion of Polysilicon by Application in 2021
Table 82. Sichuan Yongxiang Polysilicon Sales Proportion of Polysilicon by Geographic Area in 2021
Table 83. KCC Corporation Information
Table 84. KCC Description and Business Overview
Table 85. KCC Polysilicon Sales (MT), Revenue (US$ Million), Price (USD/Kg) and Gross Margin (2017-2022)
Table 86. KCC Polysilicon Product
Table 87. KCC Polysilicon Sales Proportion of Polysilicon by Product in 2021
Table 88. KCC Polysilicon Sales Proportion of Polysilicon by Application in 2021
Table 89. KCC Polysilicon Sales Proportion of Polysilicon by Geographic Area in 2021
Table 90. Tokuyama Corporation Information
Table 91. Tokuyama Description and Business Overview
Table 92. Tokuyama Polysilicon Sales (MT), Revenue (US$ Million), Price (USD/Kg) and Gross Margin (2017-2022)
Table 93. Tokuyama Polysilicon Product
Table 94. Tokuyama Polysilicon Sales Proportion of Polysilicon by Product in 2021
Table 95. Tokuyama Polysilicon Sales Proportion of Polysilicon by Application in 2021
Table 96. Tokuyama Polysilicon Sales Proportion of Polysilicon by Geographic Area in 2021
Table 97. HanKook Silicon Corporation Information
Table 98. HanKook Silicon Description and Business Overview
Table 99. HanKook Silicon Polysilicon Sales (MT), Revenue (US$ Million), Price (USD/Kg) and Gross Margin (2017-2022)
Table 100. HanKook Silicon Polysilicon Product
Table 101. HanKook Silicon Polysilicon Sales Proportion of Polysilicon by Product in 2021
Table 102. HanKook Silicon Polysilicon Sales Proportion of Polysilicon by Application in 2021
Table 103. HanKook Silicon Polysilicon Sales Proportion of Polysilicon by Geographic Area in 2021
Table 104. Daqo New Energy Corporation Information
Table 105. Daqo New Energy Description and Business Overview
Table 106. Daqo New Energy Polysilicon Sales (MT), Revenue (US$ Million), Price (USD/Kg) and Gross Margin (2017-2022)
Table 107. Daqo New Energy Polysilicon Product
Table 108. Daqo New Energy Polysilicon Sales Proportion of Polysilicon by Product in 2021
Table 109. Daqo New Energy Polysilicon Sales Proportion of Polysilicon by Application in 2021
Table 110. Daqo New Energy Polysilicon Sales Proportion of Polysilicon by Geographic Area in 2021
Table 111. Dun'an Group Corporation Information
Table 112. Dun'an Group Description and Business Overview
Table 113. Dun'an Group Polysilicon Sales (MT), Revenue (US$ Million), Price (USD/Kg) and Gross Margin (2017-2022)
Table 114. Dun'an Group Polysilicon Product
Table 115. Dun'an Group Polysilicon Sales Proportion of Polysilicon by Product in 2021
Table 116. Dun'an Group Polysilicon Sales Proportion of Polysilicon by Application in 2021
Table 117. Dun'an Group Polysilicon Sales Proportion of Polysilicon by Geographic Area in 2021
Table 118. LDK Solar Corporation Information
Table 119. LDK Solar Description and Business Overview
Table 120. LDK Solar Polysilicon Sales (MT), Revenue (US$ Million), Price (USD/Kg) and Gross Margin (2017-2022)
Table 121. LDK Solar Polysilicon Product
Table 122. LDK Solar Polysilicon Sales Proportion of Polysilicon by Product in 2021
Table 123. LDK Solar Polysilicon Sales Proportion of Polysilicon by Application in 2021
Table 124. LDK Solar Polysilicon Sales Proportion of Polysilicon by Geographic Area in 2021
Table 125. Hanwha Chemical Corporation Information
Table 126. Hanwha Chemical Description and Business Overview
Table 127. Hanwha Chemical Polysilicon Sales (MT), Revenue (US$ Million), Price (USD/Kg) and Gross Margin (2017-2022)
Table 128. Hanwha Chemical Polysilicon Product
Table 129. Hanwha Chemical Polysilicon Sales Proportion of Polysilicon by Product in 2021
Table 130. Hanwha Chemical Polysilicon Sales Proportion of Polysilicon by Application in 2021
Table 131. Hanwha Chemical Polysilicon Sales Proportion of Polysilicon by Geographic Area in 2021
Table 132. Luoyang China Silicon Corporation Information
Table 133. Luoyang China Silicon Description and Business Overview
Table 134. Luoyang China Silicon Polysilicon Sales (MT), Revenue (US$ Million), Price (USD/Kg) and Gross Margin (2017-2022)
Table 135. Luoyang China Silicon Polysilicon Product
Table 136. Luoyang China Silicon Polysilicon Sales Proportion of Polysilicon by Product in 2021
Table 137. Luoyang China Silicon Polysilicon Sales Proportion of Polysilicon by Application in 2021
Table 138. Luoyang China Silicon Polysilicon Sales Proportion of Polysilicon by Geographic Area in 2021
Table 139. Asia Silicon Corporation Information
Table 140. Asia Silicon Description and Business Overview
Table 141. Asia Silicon Polysilicon Sales (MT), Revenue (US$ Million), Price (USD/Kg) and Gross Margin (2017-2022)
Table 142. Asia Silicon Polysilicon Product
Table 143. Asia Silicon Polysilicon Sales Proportion of Polysilicon by Product in 2021
Table 144. Asia Silicon Polysilicon Sales Proportion of Polysilicon by Application in 2021
Table 145. Asia Silicon Polysilicon Sales Proportion of Polysilicon by Geographic Area in 2021
Table 146. Yichang CSG Corporation Information
Table 147. Yichang CSG Description and Business Overview
Table 148. Yichang CSG Polysilicon Sales (MT), Revenue (US$ Million), Price (USD/Kg) and Gross Margin (2017-2022)
Table 149. Yichang CSG Polysilicon Product
Table 150. Yichang CSG Polysilicon Sales Proportion of Polysilicon by Product in 2021
Table 151. Yichang CSG Polysilicon Sales Proportion of Polysilicon by Application in 2021
Table 152. Yichang CSG Polysilicon Sales Proportion of Polysilicon by Geographic Area in 2021
Table 153. Global Polysilicon Sales by Type (2017-2022) & (MT)
Table 154. Global Polysilicon Sales Forecast by Type (2023-2028) & (MT)
Table 155. Global Polysilicon Revenue by Type (2017-2022) & (US$ Million)
Table 156. Global Polysilicon Revenue Forecast by Type (2023-2028) & (US$ Million)
Table 157. Global Polysilicon Sales by Application (2017-2022) & (MT)
Table 158. Global Polysilicon Sales Forecast by Application (2023-2028) & (MT)
Table 159. Global Polysilicon Revenue by Application (2017-2022) & (US$ Million)
Table 160. Global Polysilicon Revenue Forecast by Application (2023-2028) & (US$ Million)
Table 161. North America Polysilicon Sales by Country (2017-2022) & (MT)
Table 162. North America Polysilicon Sales by Country (2023-2028) & (MT)
Table 163. North America Polysilicon Revenue by Country (2017-2022) & (US$ Million)
Table 164. North America Polysilicon Revenue by Country (2023-2028) & (US$ Million)
Table 165. North America Polysilicon Sales by Type (2017-2022) & (MT)
Table 166. North America Polysilicon Sales by Application (2017-2022) & (MT)
Table 167. Asia-Pacific Polysilicon Sales by Region (2017-2022) & (MT)
Table 168. Asia-Pacific Polysilicon Sales by Region (2023-2028) & (MT)
Table 169. Asia-Pacific Polysilicon Revenue by Region (2017-2028) & (US$ Million)
Table 170. Asia-Pacific Polysilicon Revenue by Region (2023-2028) & (US$ Million)
Table 171. Asia-Pacific Polysilicon Sales by Type (2017-2022) & (MT)
Table 172. Asia-Pacific Polysilicon Sales by Application (2017-2022) & (MT)
Table 173. Europe Polysilicon Sales by Country (2017-2022) & (MT)
Table 174. Europe Polysilicon Sales by Country (2023-2028) & (MT)
Table 175. Europe Polysilicon Revenue by Country (2017-2022) & (US$ Million)
Table 176. Europe Polysilicon Revenue by Country (2023-2028) & (US$ Million)
Table 177. Europe Polysilicon Sales by Type (2017-2022) & (MT)
Table 178. Europe Polysilicon Sales by Application (2017-2022) & (MT)
Table 179. Latin America Polysilicon Sales by Country (2017-2022) & (MT)
Table 180. Latin America Polysilicon Sales by Country (2023-2028) & (MT)
Table 181. Latin America Polysilicon Revenue by Country (2017-2022) & (US$ Million)
Table 182. Latin America Polysilicon Revenue by Country (2023-2028) & (US$ Million)
Table 183. Latin America Polysilicon Sales by Type (2017-2022) & (MT)
Table 184. Latin America Polysilicon Sales by Application (2017-2022) & (MT)
Table 185. Middle East and Africa Polysilicon Sales by Country (2017-2022) & (MT)
Table 186. Middle East and Africa Polysilicon Sales by Country (2023-2028) & (MT)
Table 187. Middle East and Africa Polysilicon Revenue by Country (2017-2022) & (US$ Million)
Table 188. Middle East and Africa Polysilicon Revenue by Country (2023-2028) & (US$ Million)
Table 189. Middle East and Africa Polysilicon Sales by Type (2017-2022) & (MT)
Table 190. Middle East and Africa Polysilicon Sales by Application (2017-2022) & (MT)
Table 191. Polysilicon Key Raw Materials, Industry Status and Trend
Table 192. Polysilicon Key Raw Materials and Upstream Suppliers
Table 193. Polysilicon Clients Status and Trend
Table 194. Polysilicon Typical Clients
Table 195. Polysilicon Distributors
Table 196. Polysilicon Market Trends
Table 197. Polysilicon Market Drivers
Table 198. Polysilicon Market Challenges
Table 199. Polysilicon Market Restraints
Table 200. Research Programs/Design for This Report
Table 201. Key Data Information from Secondary Sources
Table 202. Key Data Information from Primary Sources
List of Figures
Figure 1. Polysilicon Product Picture
Figure 2. Global Polysilicon Sales Market Share by Type in 2021 & 2028
Figure 3. Solar Grade Polysilicon Product Picture
Figure 4. Electronic Grade Polysilicon Product Picture
Figure 5. Global Polysilicon Sales Market Share by Application in 2021 & 2028
Figure 6. Solar Photovoltaics (PV) Industry Examples
Figure 7. Semiconductor Industry Examples
Figure 8. Others Examples
Figure 9. Polysilicon Report Years Considered
Figure 10. Global Polysilicon Market Size, (US$ Million), 2017 VS 2021 VS 2028
Figure 11. Global Polysilicon Market Size 2017-2028 (US$ Million)
Figure 12. Global Polysilicon Sales 2017-2028 (MT)
Figure 13. Global Polysilicon Market Size Market Share by Region: 2022 Versus 2028
Figure 14. Global Polysilicon Sales Market Share Forecast by Region (2017-2028)
Figure 15. Global Polysilicon Revenue Market Share by Region (2017-2028)
Figure 16. Global Polysilicon Sales Share by Manufacturer in 2021
Figure 17. Polysilicon Market Share by Company Type (Tier 1, Tier 2 and Tier 3): 2017 VS 2021
Figure 18. Global Polysilicon Sales Market Share Forecast by Type (2017-2028)
Figure 19. Global Polysilicon Revenue Market Share Forecast by Type (2017-2028)
Figure 20. Polysilicon Average Selling Price (ASP) by Type (2017-2022) & (USD/Kg)
Figure 21. Global Polysilicon Sales Market Share Forecast by Application (2017-2028)
Figure 22. Global Polysilicon Revenue Market Share Forecast by Application (2017-2028)
Figure 23. Polysilicon Average Selling Price (ASP) by Application (2017-2022) & (USD/Kg)
Figure 24. North America Polysilicon Revenue 2017-2028 (US$ Million)
Figure 25. North America Polysilicon Sales Market Share by Type (2017-2022)
Figure 26. North America Polysilicon Sales Market Share by Application (2017-2022)
Figure 27. Asia-Pacific Polysilicon Revenue 2017-2028 (US$ Million)
Figure 28. Asia-Pacific Polysilicon Sales Market Share by Region (2017-2028)
Figure 29. Asia-Pacific Polysilicon Revenue Market Share by Region (2017-2028)
Figure 30. Asia-Pacific Polysilicon Sales Market Share by Type (2017-2022)
Figure 31. Asia-Pacific Polysilicon Sales Market Share by Application (2017-2022)
Figure 32. Europe Polysilicon Revenue Growth Rate 2017-2028 (US$ Million)
Figure 33. Europe Polysilicon Sales Market Share by Country (2017-2028)
Figure 34. Europe Polysilicon Revenue Market Share by Country (2017-2028)
Figure 35. Europe Polysilicon Sales Market Share by Type (2017-2022)
Figure 36. Europe Polysilicon Sales Market Share by Application (2017-2022)
Figure 37. Latin America Polysilicon Revenue Growth Rate 2017-2028 (US$ Million)
Figure 38. Latin America Polysilicon Sales Market Share by Country (2017-2028)
Figure 39. Latin America Polysilicon Revenue Market Share by Country (2017-2022)
Figure 40. Latin America Polysilicon Sales Market Share by Type (2017-2022)
Figure 41. Latin America Polysilicon Sales Market Share by Application (2017-2022)
Figure 42. Middle East and Africa Polysilicon Revenue Growth Rate 2017-2028 (US$ Million)
Figure 43. Middle East and Africa Polysilicon Sales Market Share by Country (2017-2028)
Figure 44. Middle East and Africa Polysilicon Revenue Market Share by Country (2017-2028)
Figure 45. Middle East and Africa Polysilicon Sales Market Share by Type (2017-2022)
Figure 46. Middle East and Africa Polysilicon Sales Market Share by Application (2017-2022)
Figure 47. Polysilicon Supply Chain (Upstream and Downstream Market)
Figure 48. Global Production Market Share of Polysilicon Raw Materials by Region in 2021
Figure 49. Polysilicon Distribution Channels
Figure 50. Global Polysilicon Percentage 2017-2028: Indirect Sales VS Direct Sales
Figure 51. Global Polysilicon Percentage 2017-2028: Online Sales VS Offline Sales
Figure 52. Bottom-up and Top-down Approaches for This Report
Figure 53. Data Triangulation
$5900
$11800
HAVE A QUERY?
OUR CUSTOMER
