1 Market Overview
1.1 RGB Color Photoresist Product Introduction
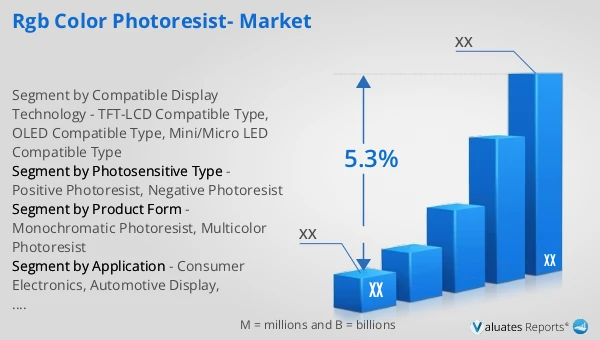
1.2 Global RGB Color Photoresist Market Size Forecast
1.2.1 Global RGB Color Photoresist Sales Value (2021–2032)
1.2.2 Global RGB Color Photoresist Sales Volume (2021–2032)
1.2.3 Global RGB Color Photoresist Sales Price (2021–2032)
1.3 RGB Color Photoresist Market Trends & Drivers
1.3.1 RGB Color Photoresist Industry Trends
1.3.2 RGB Color Photoresist Market Drivers & Opportunities
1.3.3 RGB Color Photoresist Market Challenges
1.3.4 RGB Color Photoresist Market Restraints
1.3.5 Impact of U.S. Tariffs
1.4 Assumptions and Limitations
1.5 Study Objectives
1.6 Years Considered
2 Competitive Analysis by Company
2.1 Global RGB Color Photoresist Players Revenue Ranking (2025)
2.2 Global RGB Color Photoresist Revenue by Company (2021–2026)
2.3 Global RGB Color Photoresist Sales Volume Ranking of Players (2025)
2.4 Global RGB Color Photoresist Sales Volume by Company (2021–2026)
2.5 Global RGB Color Photoresist Average Price by Company (2021–2026)
2.6 Key Manufacturers RGB Color Photoresist Manufacturing Base and Headquarters
2.7 Key Manufacturers RGB Color Photoresist Product Offerings
2.8 Key Manufacturers Start of Mass Production of RGB Color Photoresist
2.9 RGB Color Photoresist Market Competitive Analysis
2.9.1 RGB Color Photoresist Market Concentration Rate (2021–2026)
2.9.2 Global 5 and 10 Largest Manufacturers by RGB Color Photoresist Revenue in 2025
2.9.3 Global Companies by Tier (Tier 1, Tier 2, Tier 3), based on RGB Color Photoresist revenue, 2025
2.10 Mergers & Acquisitions and Expansion
3 Segmentation RGB Color Photoresist Market Classification
3.1 Introduction by Photosensitive Type
3.1.1 Positive Photoresist
3.1.2 Negative Photoresist
3.1.3 Global RGB Color Photoresist Sales Value by Photosensitive Type
3.1.3.1 Global RGB Color Photoresist Sales Value by Photosensitive Type (2021 vs 2025 vs 2032)
3.1.3.2 Global RGB Color Photoresist Sales Value, by Photosensitive Type (2021–2032)
3.1.3.3 Global RGB Color Photoresist Sales Value, by Photosensitive Type (%), 2021–2032
3.1.4 Global RGB Color Photoresist Sales Volume by Photosensitive Type
3.1.4.1 Global RGB Color Photoresist Sales Volume by Photosensitive Type (2021 vs 2025 vs 2032)
3.1.4.2 Global RGB Color Photoresist Sales Volume, by Photosensitive Type (2021–2032)
3.1.4.3 Global RGB Color Photoresist Sales Volume, by Photosensitive Type (%), 2021–2032
3.1.5 Global RGB Color Photoresist Average Price by Photosensitive Type (2021–2032)
3.2 Introduction by Product Form
3.2.1 Monochromatic Photoresist
3.2.2 Multicolor Photoresist
3.2.3 Global RGB Color Photoresist Sales Value by Product Form
3.2.3.1 Global RGB Color Photoresist Sales Value by Product Form (2021 vs 2025 vs 2032)
3.2.3.2 Global RGB Color Photoresist Sales Value, by Product Form (2021–2032)
3.2.3.3 Global RGB Color Photoresist Sales Value, by Product Form (%), 2021–2032
3.2.4 Global RGB Color Photoresist Sales Volume by Product Form
3.2.4.1 Global RGB Color Photoresist Sales Volume by Product Form (2021 vs 2025 vs 2032)
3.2.4.2 Global RGB Color Photoresist Sales Volume, by Product Form (2021–2032)
3.2.4.3 Global RGB Color Photoresist Sales Volume, by Product Form (%), 2021–2032
3.2.5 Global RGB Color Photoresist Average Price by Product Form (2021–2032)
3.3 Introduction by Compatible Display Technology
3.3.1 TFT-LCD Compatible Type
3.3.2 OLED Compatible Type
3.3.3 Mini/Micro LED Compatible Type
3.3.4 Global RGB Color Photoresist Sales Value by Compatible Display Technology
3.3.4.1 Global RGB Color Photoresist Sales Value by Compatible Display Technology (2021 vs 2025 vs 2032)
3.3.4.2 Global RGB Color Photoresist Sales Value, by Compatible Display Technology (2021–2032)
3.3.4.3 Global RGB Color Photoresist Sales Value, by Compatible Display Technology (%), 2021–2032
3.3.5 Global RGB Color Photoresist Sales Volume by Compatible Display Technology
3.3.5.1 Global RGB Color Photoresist Sales Volume by Compatible Display Technology (2021 vs 2025 vs 2032)
3.3.5.2 Global RGB Color Photoresist Sales Volume, by Compatible Display Technology (2021–2032)
3.3.5.3 Global RGB Color Photoresist Sales Volume, by Compatible Display Technology (%), 2021–2032
3.3.6 Global RGB Color Photoresist Average Price by Compatible Display Technology (2021–2032)
4 Segmentation by Application
4.1 Introduction by Application
4.1.1 Consumer Electronics
4.1.2 Automotive Display
4.1.3 Semiconductor Packaging
4.1.4 Optical Device Manufacturing
4.1.5 Others
4.2 Global RGB Color Photoresist Sales Value by Application
4.2.1 Global RGB Color Photoresist Sales Value by Application (2021 vs 2025 vs 2032)
4.2.2 Global RGB Color Photoresist Sales Value, by Application (2021–2032)
4.2.3 Global RGB Color Photoresist Sales Value, by Application (%), 2021–2032
4.3 Global RGB Color Photoresist Sales Volume by Application
4.3.1 Global RGB Color Photoresist Sales Volume by Application (2021 vs 2025 vs 2032)
4.3.2 Global RGB Color Photoresist Sales Volume, by Application (2021–2032)
4.3.3 Global RGB Color Photoresist Sales Volume, by Application (%), 2021–2032
4.4 Global RGB Color Photoresist Average Price by Application (2021–2032)
5 Segmentation by Region
5.1 Global RGB Color Photoresist Sales Value by Region
5.1.1 Global RGB Color Photoresist Sales Value by Region: 2021 vs 2025 vs 2032
5.1.2 Global RGB Color Photoresist Sales Value by Region (2021–2026)
5.1.3 Global RGB Color Photoresist Sales Value by Region (2027–2032)
5.1.4 Global RGB Color Photoresist Sales Value by Region (%), 2021–2032
5.2 Global RGB Color Photoresist Sales Volume by Region
5.2.1 Global RGB Color Photoresist Sales Volume by Region: 2021 vs 2025 vs 2032
5.2.2 Global RGB Color Photoresist Sales Volume by Region (2021–2026)
5.2.3 Global RGB Color Photoresist Sales Volume by Region (2027–2032)
5.2.4 Global RGB Color Photoresist Sales Volume by Region (%), 2021–2032
5.3 Global RGB Color Photoresist Average Price by Region (2021–2032)
5.4 North America
5.4.1 North America RGB Color Photoresist Sales Value, 2021–2032
5.4.2 North America RGB Color Photoresist Sales Value by Country (%), 2025 vs 2032
5.5 Europe
5.5.1 Europe RGB Color Photoresist Sales Value, 2021–2032
5.5.2 Europe RGB Color Photoresist Sales Value by Country (%), 2025 vs 2032
5.6 Asia Pacific
5.6.1 Asia Pacific RGB Color Photoresist Sales Value, 2021–2032
5.6.2 Asia Pacific RGB Color Photoresist Sales Value by Region (%), 2025 vs 2032
5.7 South America
5.7.1 South America RGB Color Photoresist Sales Value, 2021–2032
5.7.2 South America RGB Color Photoresist Sales Value by Country (%), 2025 vs 2032
5.8 Middle East & Africa
5.8.1 Middle East & Africa RGB Color Photoresist Sales Value, 2021–2032
5.8.2 Middle East & Africa RGB Color Photoresist Sales Value by Country (%), 2025 vs 2032
6 Segmentation by Key Countries/Regions
6.1 Key Countries/Regions RGB Color Photoresist Sales Value Growth Trends, 2021 vs 2025 vs 2032
6.2 Key Countries/Regions RGB Color Photoresist Sales Value and Sales Volume
6.2.1 Key Countries/Regions RGB Color Photoresist Sales Value, 2021–2032
6.2.2 Key Countries/Regions RGB Color Photoresist Sales Volume, 2021–2032
6.3 United States
6.3.1 United States RGB Color Photoresist Sales Value, 2021–2032
6.3.2 United States RGB Color Photoresist Sales Value by Photosensitive Type (%), 2025 vs 2032
6.3.3 United States RGB Color Photoresist Sales Value by Application, 2025 vs 2032
6.4 Europe
6.4.1 Europe RGB Color Photoresist Sales Value, 2021–2032
6.4.2 Europe RGB Color Photoresist Sales Value by Photosensitive Type (%), 2025 vs 2032
6.4.3 Europe RGB Color Photoresist Sales Value by Application, 2025 vs 2032
6.5 China
6.5.1 China RGB Color Photoresist Sales Value, 2021–2032
6.5.2 China RGB Color Photoresist Sales Value by Photosensitive Type (%), 2025 vs 2032
6.5.3 China RGB Color Photoresist Sales Value by Application, 2025 vs 2032
6.6 Japan
6.6.1 Japan RGB Color Photoresist Sales Value, 2021–2032
6.6.2 Japan RGB Color Photoresist Sales Value by Photosensitive Type (%), 2025 vs 2032
6.6.3 Japan RGB Color Photoresist Sales Value by Application, 2025 vs 2032
6.7 South Korea
6.7.1 South Korea RGB Color Photoresist Sales Value, 2021–2032
6.7.2 South Korea RGB Color Photoresist Sales Value by Photosensitive Type (%), 2025 vs 2032
6.7.3 South Korea RGB Color Photoresist Sales Value by Application, 2025 vs 2032
6.8 Southeast Asia
6.8.1 Southeast Asia RGB Color Photoresist Sales Value, 2021–2032
6.8.2 Southeast Asia RGB Color Photoresist Sales Value by Photosensitive Type (%), 2025 vs 2032
6.8.3 Southeast Asia RGB Color Photoresist Sales Value by Application, 2025 vs 2032
6.9 India
6.9.1 India RGB Color Photoresist Sales Value, 2021–2032
6.9.2 India RGB Color Photoresist Sales Value by Photosensitive Type (%), 2025 vs 2032
6.9.3 India RGB Color Photoresist Sales Value by Application, 2025 vs 2032
7 Company Profiles
7.1 artience group
7.1.1 artience group Company Information
7.1.2 artience group Introduction and Business Overview
7.1.3 artience group RGB Color Photoresist Sales, Revenue, Price and Gross Margin (2021–2026)
7.1.4 artience group RGB Color Photoresist Product Offerings
7.1.5 artience group Recent Developments
7.2 FujiFilm
7.2.1 FujiFilm Company Information
7.2.2 FujiFilm Introduction and Business Overview
7.2.3 FujiFilm RGB Color Photoresist Sales, Revenue, Price and Gross Margin (2021–2026)
7.2.4 FujiFilm RGB Color Photoresist Product Offerings
7.2.5 FujiFilm Recent Developments
7.3 JSR
7.3.1 JSR Company Information
7.3.2 JSR Introduction and Business Overview
7.3.3 JSR RGB Color Photoresist Sales, Revenue, Price and Gross Margin (2021–2026)
7.3.4 JSR RGB Color Photoresist Product Offerings
7.3.5 JSR Recent Developments
7.4 Jiangsu Yoke Technology
7.4.1 Jiangsu Yoke Technology Company Information
7.4.2 Jiangsu Yoke Technology Introduction and Business Overview
7.4.3 Jiangsu Yoke Technology RGB Color Photoresist Sales, Revenue, Price and Gross Margin (2021–2026)
7.4.4 Jiangsu Yoke Technology RGB Color Photoresist Product Offerings
7.4.5 Jiangsu Yoke Technology Recent Developments
7.5 LG Chem
7.5.1 LG Chem Company Information
7.5.2 LG Chem Introduction and Business Overview
7.5.3 LG Chem RGB Color Photoresist Sales, Revenue, Price and Gross Margin (2021–2026)
7.5.4 LG Chem RGB Color Photoresist Product Offerings
7.5.5 LG Chem Recent Developments
7.6 Sumitomo
7.6.1 Sumitomo Company Information
7.6.2 Sumitomo Introduction and Business Overview
7.6.3 Sumitomo RGB Color Photoresist Sales, Revenue, Price and Gross Margin (2021–2026)
7.6.4 Sumitomo RGB Color Photoresist Product Offerings
7.6.5 Sumitomo Recent Developments
7.7 Samsung SDI
7.7.1 Samsung SDI Company Information
7.7.2 Samsung SDI Introduction and Business Overview
7.7.3 Samsung SDI RGB Color Photoresist Sales, Revenue, Price and Gross Margin (2021–2026)
7.7.4 Samsung SDI RGB Color Photoresist Product Offerings
7.7.5 Samsung SDI Recent Developments
7.8 Toray
7.8.1 Toray Company Information
7.8.2 Toray Introduction and Business Overview
7.8.3 Toray RGB Color Photoresist Sales, Revenue, Price and Gross Margin (2021–2026)
7.8.4 Toray RGB Color Photoresist Product Offerings
7.8.5 Toray Recent Developments
7.9 Tokyo Ohka Kogyo
7.9.1 Tokyo Ohka Kogyo Company Information
7.9.2 Tokyo Ohka Kogyo Introduction and Business Overview
7.9.3 Tokyo Ohka Kogyo RGB Color Photoresist Sales, Revenue, Price and Gross Margin (2021–2026)
7.9.4 Tokyo Ohka Kogyo RGB Color Photoresist Product Offerings
7.9.5 Tokyo Ohka Kogyo Recent Developments
7.10 Merck Group
7.10.1 Merck Group Company Information
7.10.2 Merck Group Introduction and Business Overview
7.10.3 Merck Group RGB Color Photoresist Sales, Revenue, Price and Gross Margin (2021–2026)
7.10.4 Merck Group RGB Color Photoresist Product Offerings
7.10.5 Merck Group Recent Developments
7.11 DNP Fine Chemicals
7.11.1 DNP Fine Chemicals Company Information
7.11.2 DNP Fine Chemicals Introduction and Business Overview
7.11.3 DNP Fine Chemicals RGB Color Photoresist Sales, Revenue, Price and Gross Margin (2021–2026)
7.11.4 DNP Fine Chemicals RGB Color Photoresist Product Offerings
7.11.5 DNP Fine Chemicals Recent Developments
7.12 Shenzhen Rongda Photosensitive & Technology
7.12.1 Shenzhen Rongda Photosensitive & Technology Company Information
7.12.2 Shenzhen Rongda Photosensitive & Technology Introduction and Business Overview
7.12.3 Shenzhen Rongda Photosensitive & Technology RGB Color Photoresist Sales, Revenue, Price and Gross Margin (2021–2026)
7.12.4 Shenzhen Rongda Photosensitive & Technology RGB Color Photoresist Product Offerings
7.12.5 Shenzhen Rongda Photosensitive & Technology Recent Developments
7.13 Suzhou Research Semiconductor
7.13.1 Suzhou Research Semiconductor Company Information
7.13.2 Suzhou Research Semiconductor Introduction and Business Overview
7.13.3 Suzhou Research Semiconductor RGB Color Photoresist Sales, Revenue, Price and Gross Margin (2021–2026)
7.13.4 Suzhou Research Semiconductor RGB Color Photoresist Product Offerings
7.13.5 Suzhou Research Semiconductor Recent Developments
7.14 Jiangsu Brivan Electronics Technology
7.14.1 Jiangsu Brivan Electronics Technology Company Information
7.14.2 Jiangsu Brivan Electronics Technology Introduction and Business Overview
7.14.3 Jiangsu Brivan Electronics Technology RGB Color Photoresist Sales, Revenue, Price and Gross Margin (2021–2026)
7.14.4 Jiangsu Brivan Electronics Technology RGB Color Photoresist Product Offerings
7.14.5 Jiangsu Brivan Electronics Technology Recent Developments
8 Industry Chain Analysis
8.1 RGB Color Photoresist Industrial Chain
8.2 RGB Color Photoresist Upstream Analysis
8.2.1 Key Raw Materials
8.2.2 Key Suppliers of Raw Materials
8.2.3 Manufacturing Cost Structure
8.3 Midstream Analysis
8.4 Downstream Analysis (Customer Analysis)
8.5 Sales Model and Sales Channelss
8.5.1 RGB Color Photoresist Sales Model
8.5.2 Sales Channels
8.5.3 RGB Color Photoresist Distributors
9 Research Findings and Conclusion
10 Appendix
10.1 Research Methodology
10.1.1 Methodology/Research Approach
10.1.1.1 Research Programs/Design
10.1.1.2 Market Size Estimation
10.1.1.3 Market Breakdown and Data Triangulation
10.1.2 Data Source
10.1.2.1 Secondary Sources
10.1.2.2 Primary Sources
10.2 Author Details
10.3 Disclaimer