List of Tables
Table 1. Global Cosmetics Contract Manufacturing and Private Label Manufacturing Market Size Growth Rate by Type (US$ Million): 2020 VS 2024 VS 2031
Table 2. Key Players of Contract Manufacturing
Table 3. Key Players of Private Label
Table 4. Global Cosmetics Contract Manufacturing and Private Label Manufacturing Market Size Growth by Application (US$ Million): 2020 VS 2024 VS 2031
Table 5. Global Cosmetics Contract Manufacturing and Private Label Manufacturing Market Size by Region (US$ Million): 2020 VS 2024 VS 2031
Table 6. Global Cosmetics Contract Manufacturing and Private Label Manufacturing Market Size by Region (2020-2025) & (US$ Million)
Table 7. Global Cosmetics Contract Manufacturing and Private Label Manufacturing Market Share by Region (2020-2025)
Table 8. Global Cosmetics Contract Manufacturing and Private Label Manufacturing Forecasted Market Size by Region (2026-2031) & (US$ Million)
Table 9. Global Cosmetics Contract Manufacturing and Private Label Manufacturing Market Share by Region (2026-2031)
Table 10. Cosmetics Contract Manufacturing and Private Label Manufacturing Market Trends
Table 11. Cosmetics Contract Manufacturing and Private Label Manufacturing Market Drivers
Table 12. Cosmetics Contract Manufacturing and Private Label Manufacturing Market Challenges
Table 13. Cosmetics Contract Manufacturing and Private Label Manufacturing Market Restraints
Table 14. Global Cosmetics Contract Manufacturing and Private Label Manufacturing Revenue by Players (2020-2025) & (US$ Million)
Table 15. Global Cosmetics Contract Manufacturing and Private Label Manufacturing Market Share by Players (2020-2025)
Table 16. Global Top Cosmetics Contract Manufacturing and Private Label Manufacturing Players by Company Type (Tier 1, Tier 2, and Tier 3) & (based on the Revenue in Cosmetics Contract Manufacturing and Private Label Manufacturing as of 2024)
Table 17. Ranking of Global Top Cosmetics Contract Manufacturing and Private Label Manufacturing Companies by Revenue (US$ Million) in 2024
Table 18. Global 5 Largest Players Market Share by Cosmetics Contract Manufacturing and Private Label Manufacturing Revenue (CR5 and HHI) & (2020-2025)
Table 19. Global Key Players of Cosmetics Contract Manufacturing and Private Label Manufacturing, Headquarters and Area Served
Table 20. Global Key Players of Cosmetics Contract Manufacturing and Private Label Manufacturing, Product and Application
Table 21. Global Key Players of Cosmetics Contract Manufacturing and Private Label Manufacturing, Date of Enter into This Industry
Table 22. Mergers & Acquisitions, Expansion Plans
Table 23. Global Cosmetics Contract Manufacturing and Private Label Manufacturing Market Size by Type (2020-2025) & (US$ Million)
Table 24. Global Cosmetics Contract Manufacturing and Private Label Manufacturing Revenue Market Share by Type (2020-2025)
Table 25. Global Cosmetics Contract Manufacturing and Private Label Manufacturing Forecasted Market Size by Type (2026-2031) & (US$ Million)
Table 26. Global Cosmetics Contract Manufacturing and Private Label Manufacturing Revenue Market Share by Type (2026-2031)
Table 27. Global Cosmetics Contract Manufacturing and Private Label Manufacturing Market Size by Application (2020-2025) & (US$ Million)
Table 28. Global Cosmetics Contract Manufacturing and Private Label Manufacturing Revenue Market Share by Application (2020-2025)
Table 29. Global Cosmetics Contract Manufacturing and Private Label Manufacturing Forecasted Market Size by Application (2026-2031) & (US$ Million)
Table 30. Global Cosmetics Contract Manufacturing and Private Label Manufacturing Revenue Market Share by Application (2026-2031)
Table 31. North America Cosmetics Contract Manufacturing and Private Label Manufacturing Market Size Growth Rate by Country (US$ Million): 2020 VS 2024 VS 2031
Table 32. North America Cosmetics Contract Manufacturing and Private Label Manufacturing Market Size by Country (2020-2025) & (US$ Million)
Table 33. North America Cosmetics Contract Manufacturing and Private Label Manufacturing Market Size by Country (2026-2031) & (US$ Million)
Table 34. Europe Cosmetics Contract Manufacturing and Private Label Manufacturing Market Size Growth Rate by Country (US$ Million): 2020 VS 2024 VS 2031
Table 35. Europe Cosmetics Contract Manufacturing and Private Label Manufacturing Market Size by Country (2020-2025) & (US$ Million)
Table 36. Europe Cosmetics Contract Manufacturing and Private Label Manufacturing Market Size by Country (2026-2031) & (US$ Million)
Table 37. Asia-Pacific Cosmetics Contract Manufacturing and Private Label Manufacturing Market Size Growth Rate by Region (US$ Million): 2020 VS 2024 VS 2031
Table 38. Asia-Pacific Cosmetics Contract Manufacturing and Private Label Manufacturing Market Size by Region (2020-2025) & (US$ Million)
Table 39. Asia-Pacific Cosmetics Contract Manufacturing and Private Label Manufacturing Market Size by Region (2026-2031) & (US$ Million)
Table 40. Latin America Cosmetics Contract Manufacturing and Private Label Manufacturing Market Size Growth Rate by Country (US$ Million): 2020 VS 2024 VS 2031
Table 41. Latin America Cosmetics Contract Manufacturing and Private Label Manufacturing Market Size by Country (2020-2025) & (US$ Million)
Table 42. Latin America Cosmetics Contract Manufacturing and Private Label Manufacturing Market Size by Country (2026-2031) & (US$ Million)
Table 43. Middle East & Africa Cosmetics Contract Manufacturing and Private Label Manufacturing Market Size Growth Rate by Country (US$ Million): 2020 VS 2024 VS 2031
Table 44. Middle East & Africa Cosmetics Contract Manufacturing and Private Label Manufacturing Market Size by Country (2020-2025) & (US$ Million)
Table 45. Middle East & Africa Cosmetics Contract Manufacturing and Private Label Manufacturing Market Size by Country (2026-2031) & (US$ Million)
Table 46. COSMAX Company Details
Table 47. COSMAX Business Overview
Table 48. COSMAX Cosmetics Contract Manufacturing and Private Label Manufacturing Product
Table 49. COSMAX Revenue in Cosmetics Contract Manufacturing and Private Label Manufacturing Business (2020-2025) & (US$ Million)
Table 50. COSMAX Recent Development
Table 51. KDC/One Company Details
Table 52. KDC/One Business Overview
Table 53. KDC/One Cosmetics Contract Manufacturing and Private Label Manufacturing Product
Table 54. KDC/One Revenue in Cosmetics Contract Manufacturing and Private Label Manufacturing Business (2020-2025) & (US$ Million)
Table 55. KDC/One Recent Development
Table 56. Intercos Company Details
Table 57. Intercos Business Overview
Table 58. Intercos Cosmetics Contract Manufacturing and Private Label Manufacturing Product
Table 59. Intercos Revenue in Cosmetics Contract Manufacturing and Private Label Manufacturing Business (2020-2025) & (US$ Million)
Table 60. Intercos Recent Development
Table 61. Kolmar korea Company Details
Table 62. Kolmar korea Business Overview
Table 63. Kolmar korea Cosmetics Contract Manufacturing and Private Label Manufacturing Product
Table 64. Kolmar korea Revenue in Cosmetics Contract Manufacturing and Private Label Manufacturing Business (2020-2025) & (US$ Million)
Table 65. Kolmar korea Recent Development
Table 66. Nihon Kolmar Company Details
Table 67. Nihon Kolmar Business Overview
Table 68. Nihon Kolmar Cosmetics Contract Manufacturing and Private Label Manufacturing Product
Table 69. Nihon Kolmar Revenue in Cosmetics Contract Manufacturing and Private Label Manufacturing Business (2020-2025) & (US$ Million)
Table 70. Nihon Kolmar Recent Development
Table 71. Nox Bellow Cosmetics Company Details
Table 72. Nox Bellow Cosmetics Business Overview
Table 73. Nox Bellow Cosmetics Cosmetics Contract Manufacturing and Private Label Manufacturing Product
Table 74. Nox Bellow Cosmetics Revenue in Cosmetics Contract Manufacturing and Private Label Manufacturing Business (2020-2025) & (US$ Million)
Table 75. Nox Bellow Cosmetics Recent Development
Table 76. Cosmo Beauty Company Details
Table 77. Cosmo Beauty Business Overview
Table 78. Cosmo Beauty Cosmetics Contract Manufacturing and Private Label Manufacturing Product
Table 79. Cosmo Beauty Revenue in Cosmetics Contract Manufacturing and Private Label Manufacturing Business (2020-2025) & (US$ Million)
Table 80. Cosmo Beauty Recent Development
Table 81. Mana Products Company Details
Table 82. Mana Products Business Overview
Table 83. Mana Products Cosmetics Contract Manufacturing and Private Label Manufacturing Product
Table 84. Mana Products Revenue in Cosmetics Contract Manufacturing and Private Label Manufacturing Business (2020-2025) & (US$ Million)
Table 85. Mana Products Recent Development
Table 86. Cosmecca Company Details
Table 87. Cosmecca Business Overview
Table 88. Cosmecca Cosmetics Contract Manufacturing and Private Label Manufacturing Product
Table 89. Cosmecca Revenue in Cosmetics Contract Manufacturing and Private Label Manufacturing Business (2020-2025) & (US$ Million)
Table 90. Cosmecca Recent Development
Table 91. PICASO Cosmetic Company Details
Table 92. PICASO Cosmetic Business Overview
Table 93. PICASO Cosmetic Cosmetics Contract Manufacturing and Private Label Manufacturing Product
Table 94. PICASO Cosmetic Revenue in Cosmetics Contract Manufacturing and Private Label Manufacturing Business (2020-2025) & (US$ Million)
Table 95. PICASO Cosmetic Recent Development
Table 96. Toyo Beauty Company Details
Table 97. Toyo Beauty Business Overview
Table 98. Toyo Beauty Cosmetics Contract Manufacturing and Private Label Manufacturing Product
Table 99. Toyo Beauty Revenue in Cosmetics Contract Manufacturing and Private Label Manufacturing Business (2020-2025) & (US$ Million)
Table 100. Toyo Beauty Recent Development
Table 101. Chromavis Company Details
Table 102. Chromavis Business Overview
Table 103. Chromavis Cosmetics Contract Manufacturing and Private Label Manufacturing Product
Table 104. Chromavis Revenue in Cosmetics Contract Manufacturing and Private Label Manufacturing Business (2020-2025) & (US$ Million)
Table 105. Chromavis Recent Development
Table 106. Opal Cosmetics Company Details
Table 107. Opal Cosmetics Business Overview
Table 108. Opal Cosmetics Cosmetics Contract Manufacturing and Private Label Manufacturing Product
Table 109. Opal Cosmetics Revenue in Cosmetics Contract Manufacturing and Private Label Manufacturing Business (2020-2025) & (US$ Million)
Table 110. Opal Cosmetics Recent Development
Table 111. BioTruly Company Details
Table 112. BioTruly Business Overview
Table 113. BioTruly Cosmetics Contract Manufacturing and Private Label Manufacturing Product
Table 114. BioTruly Revenue in Cosmetics Contract Manufacturing and Private Label Manufacturing Business (2020-2025) & (US$ Million)
Table 115. BioTruly Recent Development
Table 116. Ancorotti Cosmetics Company Details
Table 117. Ancorotti Cosmetics Business Overview
Table 118. Ancorotti Cosmetics Cosmetics Contract Manufacturing and Private Label Manufacturing Product
Table 119. Ancorotti Cosmetics Revenue in Cosmetics Contract Manufacturing and Private Label Manufacturing Business (2020-2025) & (US$ Million)
Table 120. Ancorotti Cosmetics Recent Development
Table 121. A&H International Cosmetics Company Details
Table 122. A&H International Cosmetics Business Overview
Table 123. A&H International Cosmetics Cosmetics Contract Manufacturing and Private Label Manufacturing Product
Table 124. A&H International Cosmetics Revenue in Cosmetics Contract Manufacturing and Private Label Manufacturing Business (2020-2025) & (US$ Million)
Table 125. A&H International Cosmetics Recent Development
Table 126. Bawei Biotechnology Company Details
Table 127. Bawei Biotechnology Business Overview
Table 128. Bawei Biotechnology Cosmetics Contract Manufacturing and Private Label Manufacturing Product
Table 129. Bawei Biotechnology Revenue in Cosmetics Contract Manufacturing and Private Label Manufacturing Business (2020-2025) & (US$ Million)
Table 130. Bawei Biotechnology Recent Development
Table 131. B.Kolor Company Details
Table 132. B.Kolor Business Overview
Table 133. B.Kolor Cosmetics Contract Manufacturing and Private Label Manufacturing Product
Table 134. B.Kolor Revenue in Cosmetics Contract Manufacturing and Private Label Manufacturing Business (2020-2025) & (US$ Million)
Table 135. B.Kolor Recent Development
Table 136. ESTATE CHEMICAL Company Details
Table 137. ESTATE CHEMICAL Business Overview
Table 138. ESTATE CHEMICAL Cosmetics Contract Manufacturing and Private Label Manufacturing Product
Table 139. ESTATE CHEMICAL Revenue in Cosmetics Contract Manufacturing and Private Label Manufacturing Business (2020-2025) & (US$ Million)
Table 140. ESTATE CHEMICAL Recent Development
Table 141. Ridgepole Company Details
Table 142. Ridgepole Business Overview
Table 143. Ridgepole Cosmetics Contract Manufacturing and Private Label Manufacturing Product
Table 144. Ridgepole Revenue in Cosmetics Contract Manufacturing and Private Label Manufacturing Business (2020-2025) & (US$ Million)
Table 145. Ridgepole Recent Development
Table 146. Arizona Natural Resources Company Details
Table 147. Arizona Natural Resources Business Overview
Table 148. Arizona Natural Resources Cosmetics Contract Manufacturing and Private Label Manufacturing Product
Table 149. Arizona Natural Resources Revenue in Cosmetics Contract Manufacturing and Private Label Manufacturing Business (2020-2025) & (US$ Million)
Table 150. Arizona Natural Resources Recent Development
Table 151. BMSC Company Details
Table 152. BMSC Business Overview
Table 153. BMSC Cosmetics Contract Manufacturing and Private Label Manufacturing Product
Table 154. BMSC Revenue in Cosmetics Contract Manufacturing and Private Label Manufacturing Business (2020-2025) & (US$ Million)
Table 155. BMSC Recent Development
Table 156. Lady Burd Cosmetics Company Details
Table 157. Lady Burd Cosmetics Business Overview
Table 158. Lady Burd Cosmetics Cosmetics Contract Manufacturing and Private Label Manufacturing Product
Table 159. Lady Burd Cosmetics Revenue in Cosmetics Contract Manufacturing and Private Label Manufacturing Business (2020-2025) & (US$ Million)
Table 160. Lady Burd Cosmetics Recent Development
Table 161. RNA Corporation Company Details
Table 162. RNA Corporation Business Overview
Table 163. RNA Corporation Cosmetics Contract Manufacturing and Private Label Manufacturing Product
Table 164. RNA Corporation Revenue in Cosmetics Contract Manufacturing and Private Label Manufacturing Business (2020-2025) & (US$ Million)
Table 165. RNA Corporation Recent Development
Table 166. GAR Laboratories Company Details
Table 167. GAR Laboratories Business Overview
Table 168. GAR Laboratories Cosmetics Contract Manufacturing and Private Label Manufacturing Product
Table 169. GAR Laboratories Revenue in Cosmetics Contract Manufacturing and Private Label Manufacturing Business (2020-2025) & (US$ Million)
Table 170. GAR Laboratories Recent Development
Table 171. Nutrix International Company Details
Table 172. Nutrix International Business Overview
Table 173. Nutrix International Cosmetics Contract Manufacturing and Private Label Manufacturing Product
Table 174. Nutrix International Revenue in Cosmetics Contract Manufacturing and Private Label Manufacturing Business (2020-2025) & (US$ Million)
Table 175. Nutrix International Recent Development
Table 176. Chemco Corp Company Details
Table 177. Chemco Corp Business Overview
Table 178. Chemco Corp Cosmetics Contract Manufacturing and Private Label Manufacturing Product
Table 179. Chemco Corp Revenue in Cosmetics Contract Manufacturing and Private Label Manufacturing Business (2020-2025) & (US$ Million)
Table 180. Chemco Corp Recent Development
Table 181. RainShadow Labs Company Details
Table 182. RainShadow Labs Business Overview
Table 183. RainShadow Labs Cosmetics Contract Manufacturing and Private Label Manufacturing Product
Table 184. RainShadow Labs Revenue in Cosmetics Contract Manufacturing and Private Label Manufacturing Business (2020-2025) & (US$ Million)
Table 185. RainShadow Labs Recent Development
Table 186. Dynamic Blending Company Details
Table 187. Dynamic Blending Business Overview
Table 188. Dynamic Blending Cosmetics Contract Manufacturing and Private Label Manufacturing Product
Table 189. Dynamic Blending Revenue in Cosmetics Contract Manufacturing and Private Label Manufacturing Business (2020-2025) & (US$ Million)
Table 190. Dynamic Blending Recent Development
Table 191. Audrey Morris Cosmetics Company Details
Table 192. Audrey Morris Cosmetics Business Overview
Table 193. Audrey Morris Cosmetics Cosmetics Contract Manufacturing and Private Label Manufacturing Product
Table 194. Audrey Morris Cosmetics Revenue in Cosmetics Contract Manufacturing and Private Label Manufacturing Business (2020-2025) & (US$ Million)
Table 195. Audrey Morris Cosmetics Recent Development
Table 196. Research Programs/Design for This Report
Table 197. Key Data Information from Secondary Sources
Table 198. Key Data Information from Primary Sources
Table 199. Authors List of This Report
List of Figures
Figure 1. Cosmetics Contract Manufacturing and Private Label Manufacturing Picture
Figure 2. Global Cosmetics Contract Manufacturing and Private Label Manufacturing Market Size Comparison by Type (2020-2031) & (US$ Million)
Figure 3. Global Cosmetics Contract Manufacturing and Private Label Manufacturing Market Share by Type: 2024 VS 2031
Figure 4. Contract Manufacturing Features
Figure 5. Private Label Features
Figure 6. Global Cosmetics Contract Manufacturing and Private Label Manufacturing Market Size by Application (2020-2031) & (US$ Million)
Figure 7. Global Cosmetics Contract Manufacturing and Private Label Manufacturing Market Share by Application: 2024 VS 2031
Figure 8. Skincare Case Studies
Figure 9. Makeup Case Studies
Figure 10. Haircare Case Studies
Figure 11. Others Case Studies
Figure 12. Cosmetics Contract Manufacturing and Private Label Manufacturing Report Years Considered
Figure 13. Global Cosmetics Contract Manufacturing and Private Label Manufacturing Market Size (US$ Million), Year-over-Year: 2020-2031
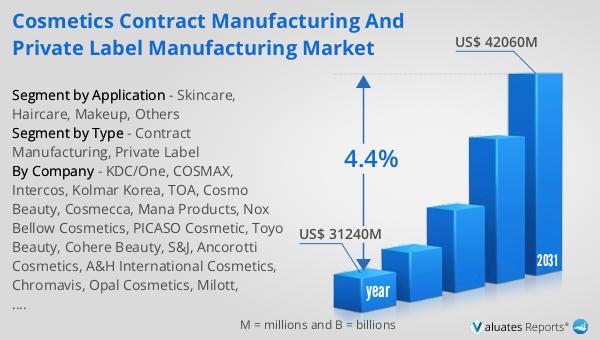
Figure 14. Global Cosmetics Contract Manufacturing and Private Label Manufacturing Market Size, (US$ Million), 2020 VS 2024 VS 2031
Figure 15. Global Cosmetics Contract Manufacturing and Private Label Manufacturing Market Share by Region: 2024 VS 2031
Figure 16. Global Cosmetics Contract Manufacturing and Private Label Manufacturing Market Share by Players in 2024
Figure 17. Global Top Cosmetics Contract Manufacturing and Private Label Manufacturing Players by Company Type (Tier 1, Tier 2, and Tier 3) & (based on the Revenue in Cosmetics Contract Manufacturing and Private Label Manufacturing as of 2024)
Figure 18. The Top 10 and 5 Players Market Share by Cosmetics Contract Manufacturing and Private Label Manufacturing Revenue in 2024
Figure 19. North America Cosmetics Contract Manufacturing and Private Label Manufacturing Market Size YoY Growth (2020-2031) & (US$ Million)
Figure 20. North America Cosmetics Contract Manufacturing and Private Label Manufacturing Market Share by Country (2020-2031)
Figure 21. United States Cosmetics Contract Manufacturing and Private Label Manufacturing Market Size YoY Growth (2020-2031) & (US$ Million)
Figure 22. Canada Cosmetics Contract Manufacturing and Private Label Manufacturing Market Size YoY Growth (2020-2031) & (US$ Million)
Figure 23. Europe Cosmetics Contract Manufacturing and Private Label Manufacturing Market Size YoY Growth (2020-2031) & (US$ Million)
Figure 24. Europe Cosmetics Contract Manufacturing and Private Label Manufacturing Market Share by Country (2020-2031)
Figure 25. Germany Cosmetics Contract Manufacturing and Private Label Manufacturing Market Size YoY Growth (2020-2031) & (US$ Million)
Figure 26. France Cosmetics Contract Manufacturing and Private Label Manufacturing Market Size YoY Growth (2020-2031) & (US$ Million)
Figure 27. U.K. Cosmetics Contract Manufacturing and Private Label Manufacturing Market Size YoY Growth (2020-2031) & (US$ Million)
Figure 28. Italy Cosmetics Contract Manufacturing and Private Label Manufacturing Market Size YoY Growth (2020-2031) & (US$ Million)
Figure 29. Russia Cosmetics Contract Manufacturing and Private Label Manufacturing Market Size YoY Growth (2020-2031) & (US$ Million)
Figure 30. Nordic Countries Cosmetics Contract Manufacturing and Private Label Manufacturing Market Size YoY Growth (2020-2031) & (US$ Million)
Figure 31. Asia-Pacific Cosmetics Contract Manufacturing and Private Label Manufacturing Market Size YoY Growth (2020-2031) & (US$ Million)
Figure 32. Asia-Pacific Cosmetics Contract Manufacturing and Private Label Manufacturing Market Share by Region (2020-2031)
Figure 33. China Cosmetics Contract Manufacturing and Private Label Manufacturing Market Size YoY Growth (2020-2031) & (US$ Million)
Figure 34. Japan Cosmetics Contract Manufacturing and Private Label Manufacturing Market Size YoY Growth (2020-2031) & (US$ Million)
Figure 35. South Korea Cosmetics Contract Manufacturing and Private Label Manufacturing Market Size YoY Growth (2020-2031) & (US$ Million)
Figure 36. Southeast Asia Cosmetics Contract Manufacturing and Private Label Manufacturing Market Size YoY Growth (2020-2031) & (US$ Million)
Figure 37. India Cosmetics Contract Manufacturing and Private Label Manufacturing Market Size YoY Growth (2020-2031) & (US$ Million)
Figure 38. Australia Cosmetics Contract Manufacturing and Private Label Manufacturing Market Size YoY Growth (2020-2031) & (US$ Million)
Figure 39. Latin America Cosmetics Contract Manufacturing and Private Label Manufacturing Market Size YoY Growth (2020-2031) & (US$ Million)
Figure 40. Latin America Cosmetics Contract Manufacturing and Private Label Manufacturing Market Share by Country (2020-2031)
Figure 41. Mexico Cosmetics Contract Manufacturing and Private Label Manufacturing Market Size YoY Growth (2020-2031) & (US$ Million)
Figure 42. Brazil Cosmetics Contract Manufacturing and Private Label Manufacturing Market Size YoY Growth (2020-2031) & (US$ Million)
Figure 43. Middle East & Africa Cosmetics Contract Manufacturing and Private Label Manufacturing Market Size YoY Growth (2020-2031) & (US$ Million)
Figure 44. Middle East & Africa Cosmetics Contract Manufacturing and Private Label Manufacturing Market Share by Country (2020-2031)
Figure 45. Turkey Cosmetics Contract Manufacturing and Private Label Manufacturing Market Size YoY Growth (2020-2031) & (US$ Million)
Figure 46. Saudi Arabia Cosmetics Contract Manufacturing and Private Label Manufacturing Market Size YoY Growth (2020-2031) & (US$ Million)
Figure 47. UAE Cosmetics Contract Manufacturing and Private Label Manufacturing Market Size YoY Growth (2020-2031) & (US$ Million)
Figure 48. COSMAX Revenue Growth Rate in Cosmetics Contract Manufacturing and Private Label Manufacturing Business (2020-2025)
Figure 49. KDC/One Revenue Growth Rate in Cosmetics Contract Manufacturing and Private Label Manufacturing Business (2020-2025)
Figure 50. Intercos Revenue Growth Rate in Cosmetics Contract Manufacturing and Private Label Manufacturing Business (2020-2025)
Figure 51. Kolmar korea Revenue Growth Rate in Cosmetics Contract Manufacturing and Private Label Manufacturing Business (2020-2025)
Figure 52. Nihon Kolmar Revenue Growth Rate in Cosmetics Contract Manufacturing and Private Label Manufacturing Business (2020-2025)
Figure 53. Nox Bellow Cosmetics Revenue Growth Rate in Cosmetics Contract Manufacturing and Private Label Manufacturing Business (2020-2025)
Figure 54. Cosmo Beauty Revenue Growth Rate in Cosmetics Contract Manufacturing and Private Label Manufacturing Business (2020-2025)
Figure 55. Mana Products Revenue Growth Rate in Cosmetics Contract Manufacturing and Private Label Manufacturing Business (2020-2025)
Figure 56. Cosmecca Revenue Growth Rate in Cosmetics Contract Manufacturing and Private Label Manufacturing Business (2020-2025)
Figure 57. PICASO Cosmetic Revenue Growth Rate in Cosmetics Contract Manufacturing and Private Label Manufacturing Business (2020-2025)
Figure 58. Toyo Beauty Revenue Growth Rate in Cosmetics Contract Manufacturing and Private Label Manufacturing Business (2020-2025)
Figure 59. Chromavis Revenue Growth Rate in Cosmetics Contract Manufacturing and Private Label Manufacturing Business (2020-2025)
Figure 60. Opal Cosmetics Revenue Growth Rate in Cosmetics Contract Manufacturing and Private Label Manufacturing Business (2020-2025)
Figure 61. BioTruly Revenue Growth Rate in Cosmetics Contract Manufacturing and Private Label Manufacturing Business (2020-2025)
Figure 62. Ancorotti Cosmetics Revenue Growth Rate in Cosmetics Contract Manufacturing and Private Label Manufacturing Business (2020-2025)
Figure 63. A&H International Cosmetics Revenue Growth Rate in Cosmetics Contract Manufacturing and Private Label Manufacturing Business (2020-2025)
Figure 64. Bawei Biotechnology Revenue Growth Rate in Cosmetics Contract Manufacturing and Private Label Manufacturing Business (2020-2025)
Figure 65. B.Kolor Revenue Growth Rate in Cosmetics Contract Manufacturing and Private Label Manufacturing Business (2020-2025)
Figure 66. ESTATE CHEMICAL Revenue Growth Rate in Cosmetics Contract Manufacturing and Private Label Manufacturing Business (2020-2025)
Figure 67. Ridgepole Revenue Growth Rate in Cosmetics Contract Manufacturing and Private Label Manufacturing Business (2020-2025)
Figure 68. Arizona Natural Resources Revenue Growth Rate in Cosmetics Contract Manufacturing and Private Label Manufacturing Business (2020-2025)
Figure 69. BMSC Revenue Growth Rate in Cosmetics Contract Manufacturing and Private Label Manufacturing Business (2020-2025)
Figure 70. Lady Burd Cosmetics Revenue Growth Rate in Cosmetics Contract Manufacturing and Private Label Manufacturing Business (2020-2025)
Figure 71. RNA Corporation Revenue Growth Rate in Cosmetics Contract Manufacturing and Private Label Manufacturing Business (2020-2025)
Figure 72. GAR Laboratories Revenue Growth Rate in Cosmetics Contract Manufacturing and Private Label Manufacturing Business (2020-2025)
Figure 73. Nutrix International Revenue Growth Rate in Cosmetics Contract Manufacturing and Private Label Manufacturing Business (2020-2025)
Figure 74. Chemco Corp Revenue Growth Rate in Cosmetics Contract Manufacturing and Private Label Manufacturing Business (2020-2025)
Figure 75. RainShadow Labs Revenue Growth Rate in Cosmetics Contract Manufacturing and Private Label Manufacturing Business (2020-2025)
Figure 76. Dynamic Blending Revenue Growth Rate in Cosmetics Contract Manufacturing and Private Label Manufacturing Business (2020-2025)
Figure 77. Audrey Morris Cosmetics Revenue Growth Rate in Cosmetics Contract Manufacturing and Private Label Manufacturing Business (2020-2025)
Figure 78. Bottom-up and Top-down Approaches for This Report
Figure 79. Data Triangulation
Figure 80. Key Executives Interviewed