List of Tables
Table 1. Global Restorative IV Therapy With NAD+ Injection Market Size Growth Rate by Type (US$ Million): 2021 vs 2025 vs 2032
Table 2. Key Players of NAD+ Vitamin Mix Injection
Table 3. Key Players of Pure NAD+ Injection
Table 4. Global Restorative IV Therapy With NAD+ Injection Market Size Growth Rate by Times (US$ Million): 2021 vs 2025 vs 2032
Table 5. Key Players of Single-use Injection Type
Table 6. Key Players of Recurring Injection Type
Table 7. Key Players of Other
Table 8. Global Restorative IV Therapy With NAD+ Injection Market Size Growth by Application (US$ Million): 2021 vs 2025 vs 2032
Table 9. Global Restorative IV Therapy With NAD+ Injection Market Size by Region (US$ Million): 2021 vs 2025 vs 2032
Table 10. Global Restorative IV Therapy With NAD+ Injection Market Size by Region (US$ Million), 2021–2026
Table 11. Global Restorative IV Therapy With NAD+ Injection Market Share by Region (2021–2026)
Table 12. Global Restorative IV Therapy With NAD+ Injection Forecasted Market Size by Region (US$ Million), 2027–2032
Table 13. Global Restorative IV Therapy With NAD+ Injection Market Share by Region (2027–2032)
Table 14. Restorative IV Therapy With NAD+ Injection Market Trends
Table 15. Restorative IV Therapy With NAD+ Injection Market Drivers
Table 16. Restorative IV Therapy With NAD+ Injection Market Challenges
Table 17. Restorative IV Therapy With NAD+ Injection Market Restraints
Table 18. Global Restorative IV Therapy With NAD+ Injection Revenue by Players (US$ Million), 2021–2026
Table 19. Global Restorative IV Therapy With NAD+ Injection Market Share by Players (2021–2026)
Table 20. Global Top Restorative IV Therapy With NAD+ Injection Players by Tier (Tier 1, Tier 2, and Tier 3), based on Restorative IV Therapy With NAD+ Injection Revenue, 2025
Table 21. Ranking of Global Top Restorative IV Therapy With NAD+ Injection Companies by Revenue (US$ Million) in 2025
Table 22. Global 5 Largest Players Market Share by Restorative IV Therapy With NAD+ Injection Revenue (CR5 and HHI), 2021–2026
Table 23. Global Key Players of Restorative IV Therapy With NAD+ Injection, Headquarters and Area Served
Table 24. Global Key Players of Restorative IV Therapy With NAD+ Injection, Products and Applications
Table 25. Global Key Players of Restorative IV Therapy With NAD+ Injection, Date of General Availability (GA)
Table 26. Mergers and Acquisitions, Expansion Plans
Table 27. Global Restorative IV Therapy With NAD+ Injection Market Size by Type (US$ Million), 2021–2026
Table 28. Global Restorative IV Therapy With NAD+ Injection Revenue Market Share by Type (2021–2026)
Table 29. Global Restorative IV Therapy With NAD+ Injection Forecasted Market Size by Type (US$ Million), 2027–2032
Table 30. Global Restorative IV Therapy With NAD+ Injection Revenue Market Share by Type (2027–2032)
Table 31. Global Restorative IV Therapy With NAD+ Injection Market Size by Application (US$ Million), 2021–2026
Table 32. Global Restorative IV Therapy With NAD+ Injection Revenue Market Share by Application (2021–2026)
Table 33. Global Restorative IV Therapy With NAD+ Injection Forecasted Market Size by Application (US$ Million), 2027–2032
Table 34. Global Restorative IV Therapy With NAD+ Injection Revenue Market Share by Application (2027–2032)
Table 35. North America Restorative IV Therapy With NAD+ Injection Market Size Growth Rate by Country (US$ Million): 2021 vs 2025 vs 2032
Table 36. North America Restorative IV Therapy With NAD+ Injection Market Size by Country (US$ Million), 2021–2026
Table 37. North America Restorative IV Therapy With NAD+ Injection Market Size by Country (US$ Million), 2027–2032
Table 38. Europe Restorative IV Therapy With NAD+ Injection Market Size Growth Rate by Country (US$ Million): 2021 vs 2025 vs 2032
Table 39. Europe Restorative IV Therapy With NAD+ Injection Market Size by Country (US$ Million), 2021–2026
Table 40. Europe Restorative IV Therapy With NAD+ Injection Market Size by Country (US$ Million), 2027–2032
Table 41. Asia-Pacific Restorative IV Therapy With NAD+ Injection Market Size Growth Rate by Region (US$ Million): 2021 vs 2025 vs 2032
Table 42. Asia-Pacific Restorative IV Therapy With NAD+ Injection Market Size by Region (US$ Million), 2021–2026
Table 43. Asia-Pacific Restorative IV Therapy With NAD+ Injection Market Size by Region (US$ Million), 2027–2032
Table 44. Latin America Restorative IV Therapy With NAD+ Injection Market Size Growth Rate by Country (US$ Million): 2021 vs 2025 vs 2032
Table 45. Latin America Restorative IV Therapy With NAD+ Injection Market Size by Country (US$ Million), 2021–2026
Table 46. Latin America Restorative IV Therapy With NAD+ Injection Market Size by Country (US$ Million), 2027–2032
Table 47. Middle East & Africa Restorative IV Therapy With NAD+ Injection Market Size Growth Rate by Country (US$ Million): 2021 vs 2025 vs 2032
Table 48. Middle East & Africa Restorative IV Therapy With NAD+ Injection Market Size by Country (US$ Million), 2021–2026
Table 49. Middle East & Africa Restorative IV Therapy With NAD+ Injection Market Size by Country (US$ Million), 2027–2032
Table 50. The Wellness Lab Company Details
Table 51. The Wellness Lab Business Overview
Table 52. The Wellness Lab Restorative IV Therapy With NAD+ Injection Product
Table 53. The Wellness Lab Revenue in Restorative IV Therapy With NAD+ Injection Business (US$ Million), 2021–2026
Table 54. The Wellness Lab Recent Development
Table 55. Conciergemdla Company Details
Table 56. Conciergemdla Business Overview
Table 57. Conciergemdla Restorative IV Therapy With NAD+ Injection Product
Table 58. Conciergemdla Revenue in Restorative IV Therapy With NAD+ Injection Business (US$ Million), 2021–2026
Table 59. Conciergemdla Recent Development
Table 60. Azivmedics Company Details
Table 61. Azivmedics Business Overview
Table 62. Azivmedics Restorative IV Therapy With NAD+ Injection Product
Table 63. Azivmedics Revenue in Restorative IV Therapy With NAD+ Injection Business (US$ Million), 2021–2026
Table 64. Azivmedics Recent Development
Table 65. Reset IV Company Details
Table 66. Reset IV Business Overview
Table 67. Reset IV Restorative IV Therapy With NAD+ Injection Product
Table 68. Reset IV Revenue in Restorative IV Therapy With NAD+ Injection Business (US$ Million), 2021–2026
Table 69. Reset IV Recent Development
Table 70. Thedripclub Company Details
Table 71. Thedripclub Business Overview
Table 72. Thedripclub Restorative IV Therapy With NAD+ Injection Product
Table 73. Thedripclub Revenue in Restorative IV Therapy With NAD+ Injection Business (US$ Million), 2021–2026
Table 74. Thedripclub Recent Development
Table 75. Toronto Functional Medicine Centre Company Details
Table 76. Toronto Functional Medicine Centre Business Overview
Table 77. Toronto Functional Medicine Centre Restorative IV Therapy With NAD+ Injection Product
Table 78. Toronto Functional Medicine Centre Revenue in Restorative IV Therapy With NAD+ Injection Business (US$ Million), 2021–2026
Table 79. Toronto Functional Medicine Centre Recent Development
Table 80. Mobileivmedics Company Details
Table 81. Mobileivmedics Business Overview
Table 82. Mobileivmedics Restorative IV Therapy With NAD+ Injection Product
Table 83. Mobileivmedics Revenue in Restorative IV Therapy With NAD+ Injection Business (US$ Million), 2021–2026
Table 84. Mobileivmedics Recent Development
Table 85. Rocky Mountain Ivmedics Company Details
Table 86. Rocky Mountain Ivmedics Business Overview
Table 87. Rocky Mountain Ivmedics Restorative IV Therapy With NAD+ Injection Product
Table 88. Rocky Mountain Ivmedics Revenue in Restorative IV Therapy With NAD+ Injection Business (US$ Million), 2021–2026
Table 89. Rocky Mountain Ivmedics Recent Development
Table 90. Seaside Skin Care Company Details
Table 91. Seaside Skin Care Business Overview
Table 92. Seaside Skin Care Restorative IV Therapy With NAD+ Injection Product
Table 93. Seaside Skin Care Revenue in Restorative IV Therapy With NAD+ Injection Business (US$ Million), 2021–2026
Table 94. Seaside Skin Care Recent Development
Table 95. Premiumhealth Company Details
Table 96. Premiumhealth Business Overview
Table 97. Premiumhealth Restorative IV Therapy With NAD+ Injection Product
Table 98. Premiumhealth Revenue in Restorative IV Therapy With NAD+ Injection Business (US$ Million), 2021–2026
Table 99. Premiumhealth Recent Development
Table 100. Effect Doctors Company Details
Table 101. Effect Doctors Business Overview
Table 102. Effect Doctors Restorative IV Therapy With NAD+ Injection Product
Table 103. Effect Doctors Revenue in Restorative IV Therapy With NAD+ Injection Business (US$ Million), 2021–2026
Table 104. Effect Doctors Recent Development
Table 105. Nadclinic Company Details
Table 106. Nadclinic Business Overview
Table 107. Nadclinic Restorative IV Therapy With NAD+ Injection Product
Table 108. Nadclinic Revenue in Restorative IV Therapy With NAD+ Injection Business (US$ Million), 2021–2026
Table 109. Nadclinic Recent Development
Table 110. Hydrate IV Bar Company Details
Table 111. Hydrate IV Bar Business Overview
Table 112. Hydrate IV Bar Restorative IV Therapy With NAD+ Injection Product
Table 113. Hydrate IV Bar Revenue in Restorative IV Therapy With NAD+ Injection Business (US$ Million), 2021–2026
Table 114. Hydrate IV Bar Recent Development
Table 115. LIVV Natural Company Details
Table 116. LIVV Natural Business Overview
Table 117. LIVV Natural Restorative IV Therapy With NAD+ Injection Product
Table 118. LIVV Natural Revenue in Restorative IV Therapy With NAD+ Injection Business (US$ Million), 2021–2026
Table 119. LIVV Natural Recent Development
Table 120. BioReset Medical Company Details
Table 121. BioReset Medical Business Overview
Table 122. BioReset Medical Restorative IV Therapy With NAD+ Injection Product
Table 123. BioReset Medical Revenue in Restorative IV Therapy With NAD+ Injection Business (US$ Million), 2021–2026
Table 124. BioReset Medical Recent Development
Table 125. IV Boost UK Company Details
Table 126. IV Boost UK Business Overview
Table 127. IV Boost UK Restorative IV Therapy With NAD+ Injection Product
Table 128. IV Boost UK Revenue in Restorative IV Therapy With NAD+ Injection Business (US$ Million), 2021–2026
Table 129. IV Boost UK Recent Development
Table 130. Research Programs/Design for This Report
Table 131. Key Data Information from Secondary Sources
Table 132. Key Data Information from Primary Sources
Table 133. Authors List of This Report
List of Figures
Figure 1. Restorative IV Therapy With NAD+ Injection Picture
Figure 2. Global Restorative IV Therapy With NAD+ Injection Market Size Comparison by Type (US$ Million), 2021–2032
Figure 3. Global Restorative IV Therapy With NAD+ Injection Market Share by Type: 2025 vs 2032
Figure 4. NAD+ Vitamin Mix Injection Features
Figure 5. Pure NAD+ Injection Features
Figure 6. Global Restorative IV Therapy With NAD+ Injection Market Size Comparison by Times (US$ Million), 2021–2032
Figure 7. Single-use Injection Type Features
Figure 8. Recurring Injection Type Features
Figure 9. Other Features
Figure 10. Global Restorative IV Therapy With NAD+ Injection Market Size by Application (US$ Million), 2021–2032
Figure 11. Global Restorative IV Therapy With NAD+ Injection Market Share by Application: 2025 vs 2032
Figure 12. Clinic Case Studies
Figure 13. Hospital Case Studies
Figure 14. Other Case Studies
Figure 15. Restorative IV Therapy With NAD+ Injection Report Years Considered
Figure 16. Global Restorative IV Therapy With NAD+ Injection Market Size (US$ Million), Year-over-Year: 2021–2032
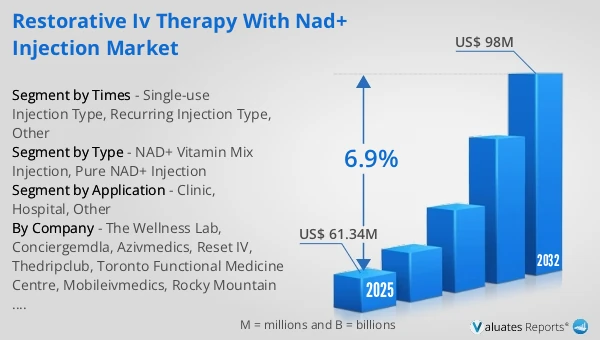
Figure 17. Global Restorative IV Therapy With NAD+ Injection Market Size, (US$ Million), 2021 vs 2025 vs 2032
Figure 18. Global Restorative IV Therapy With NAD+ Injection Market Share by Region: 2025 vs 2032
Figure 19. Global Restorative IV Therapy With NAD+ Injection Market Share by Players in 2025
Figure 20. Global Restorative IV Therapy With NAD+ Injection Market Share by Company Type (Tier 1, Tier 2, and Tier 3)
Figure 21. The Top 10 and 5 Players Market Share by Restorative IV Therapy With NAD+ Injection Revenue in 2025
Figure 22. North America Restorative IV Therapy With NAD+ Injection Market Size YoY Growth (US$ Million), 2021–2032
Figure 23. North America Restorative IV Therapy With NAD+ Injection Market Share by Country (2021–2032)
Figure 24. United States Restorative IV Therapy With NAD+ Injection Market Size YoY Growth (US$ Million), 2021–2032
Figure 25. Canada Restorative IV Therapy With NAD+ Injection Market Size YoY Growth (US$ Million), 2021–2032
Figure 26. Europe Restorative IV Therapy With NAD+ Injection Market Size YoY Growth (US$ Million), 2021–2032
Figure 27. Europe Restorative IV Therapy With NAD+ Injection Market Share by Country (2021–2032)
Figure 28. Germany Restorative IV Therapy With NAD+ Injection Market Size YoY Growth (US$ Million), 2021–2032
Figure 29. France Restorative IV Therapy With NAD+ Injection Market Size YoY Growth (US$ Million), 2021–2032
Figure 30. U.K. Restorative IV Therapy With NAD+ Injection Market Size YoY Growth (US$ Million), 2021–2032
Figure 31. Italy Restorative IV Therapy With NAD+ Injection Market Size YoY Growth (US$ Million), 2021–2032
Figure 32. Russia Restorative IV Therapy With NAD+ Injection Market Size YoY Growth (US$ Million), 2021–2032
Figure 33. Ireland Restorative IV Therapy With NAD+ Injection Market Size YoY Growth (US$ Million), 2021–2032
Figure 34. Asia-Pacific Restorative IV Therapy With NAD+ Injection Market Size YoY Growth (US$ Million), 2021–2032
Figure 35. Asia-Pacific Restorative IV Therapy With NAD+ Injection Market Share by Region (2021–2032)
Figure 36. China Restorative IV Therapy With NAD+ Injection Market Size YoY Growth (US$ Million), 2021–2032
Figure 37. Japan Restorative IV Therapy With NAD+ Injection Market Size YoY Growth (US$ Million), 2021–2032
Figure 38. South Korea Restorative IV Therapy With NAD+ Injection Market Size YoY Growth (US$ Million), 2021–2032
Figure 39. Southeast Asia Restorative IV Therapy With NAD+ Injection Market Size YoY Growth (US$ Million), 2021–2032
Figure 40. India Restorative IV Therapy With NAD+ Injection Market Size YoY Growth (US$ Million), 2021–2032
Figure 41. Australia & New Zealand Restorative IV Therapy With NAD+ Injection Market Size YoY Growth (US$ Million), 2021–2032
Figure 42. Latin America Restorative IV Therapy With NAD+ Injection Market Size YoY Growth (US$ Million), 2021–2032
Figure 43. Latin America Restorative IV Therapy With NAD+ Injection Market Share by Country (2021–2032)
Figure 44. Mexico Restorative IV Therapy With NAD+ Injection Market Size YoY Growth (US$ Million), 2021–2032
Figure 45. Brazil Restorative IV Therapy With NAD+ Injection Market Size YoY Growth (US$ Million), 2021–2032
Figure 46. Middle East & Africa Restorative IV Therapy With NAD+ Injection Market Size YoY Growth (US$ Million), 2021–2032
Figure 47. Middle East & Africa Restorative IV Therapy With NAD+ Injection Market Share by Country (2021–2032)
Figure 48. Israel Restorative IV Therapy With NAD+ Injection Market Size YoY Growth (US$ Million), 2021–2032
Figure 49. Saudi Arabia Restorative IV Therapy With NAD+ Injection Market Size YoY Growth (US$ Million), 2021–2032
Figure 50. UAE Restorative IV Therapy With NAD+ Injection Market Size YoY Growth (US$ Million), 2021–2032
Figure 51. The Wellness Lab Revenue Growth Rate in Restorative IV Therapy With NAD+ Injection Business (2021–2026)
Figure 52. Conciergemdla Revenue Growth Rate in Restorative IV Therapy With NAD+ Injection Business (2021–2026)
Figure 53. Azivmedics Revenue Growth Rate in Restorative IV Therapy With NAD+ Injection Business (2021–2026)
Figure 54. Reset IV Revenue Growth Rate in Restorative IV Therapy With NAD+ Injection Business (2021–2026)
Figure 55. Thedripclub Revenue Growth Rate in Restorative IV Therapy With NAD+ Injection Business (2021–2026)
Figure 56. Toronto Functional Medicine Centre Revenue Growth Rate in Restorative IV Therapy With NAD+ Injection Business (2021–2026)
Figure 57. Mobileivmedics Revenue Growth Rate in Restorative IV Therapy With NAD+ Injection Business (2021–2026)
Figure 58. Rocky Mountain Ivmedics Revenue Growth Rate in Restorative IV Therapy With NAD+ Injection Business (2021–2026)
Figure 59. Seaside Skin Care Revenue Growth Rate in Restorative IV Therapy With NAD+ Injection Business (2021–2026)
Figure 60. Premiumhealth Revenue Growth Rate in Restorative IV Therapy With NAD+ Injection Business (2021–2026)
Figure 61. Effect Doctors Revenue Growth Rate in Restorative IV Therapy With NAD+ Injection Business (2021–2026)
Figure 62. Nadclinic Revenue Growth Rate in Restorative IV Therapy With NAD+ Injection Business (2021–2026)
Figure 63. Hydrate IV Bar Revenue Growth Rate in Restorative IV Therapy With NAD+ Injection Business (2021–2026)
Figure 64. LIVV Natural Revenue Growth Rate in Restorative IV Therapy With NAD+ Injection Business (2021–2026)
Figure 65. BioReset Medical Revenue Growth Rate in Restorative IV Therapy With NAD+ Injection Business (2021–2026)
Figure 66. IV Boost UK Revenue Growth Rate in Restorative IV Therapy With NAD+ Injection Business (2021–2026)
Figure 67. Bottom-up and Top-down Approaches for This Report
Figure 68. Data Triangulation
Figure 69. Key Executives Interviewed