
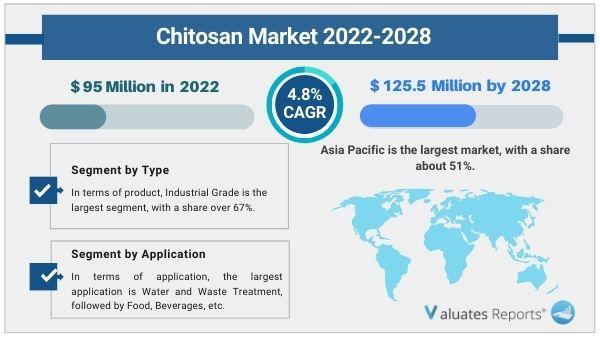
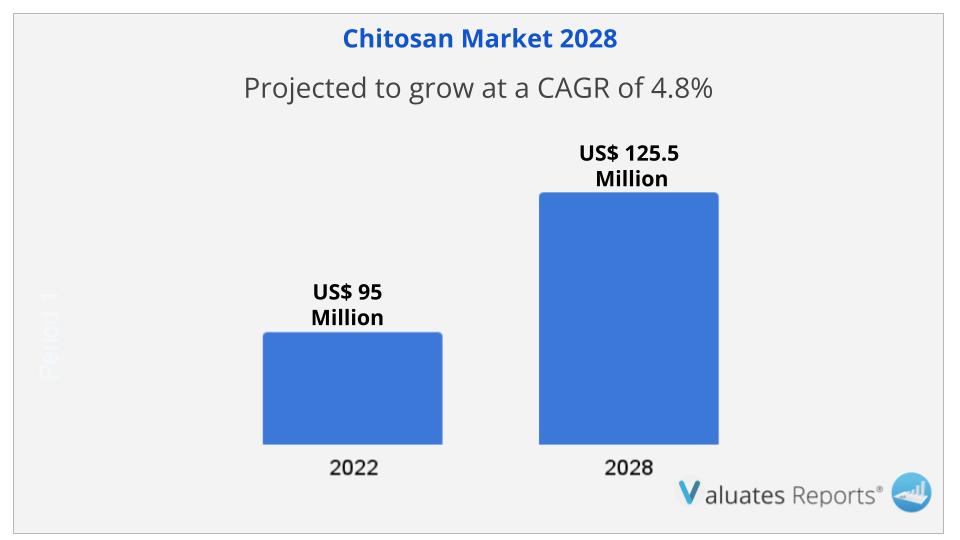
Due to the COVID-19 pandemic, the global Chitosan market size is estimated to be worth US$ 95 million in 2022 and is forecast to a readjusted size of US$ 125.5 million by 2028 with a CAGR of 4.8% during the review period. The market will expand as a result of rising demand for wastewater treatment products to remove contaminants including heavy minerals and phosphorus as well as rising use in the cosmetics, food & beverage, medical & pharmaceutical, and agrochemicals sectors. Chitosan is the primary component of hair care, skin care, and dental care products, which will stimulate the market for this product in the personal care sector.
Around the world, there is a serious issue with water contamination. Industry-generated wastewater contains pollutants like dyes and heavy metals that flow untreated into water bodies. Commercially available water treatment methods are either excessively expensive or harmful to the environment. Bio-based chitosan flocculents have good absorption properties, are less expensive, readily available, non-toxic, and are biocompatible. Injurious elements like fungi, bacteria, heavy metals, colors, salts, radionuclides, and fluoride are all successfully removed by them. During the anticipated period, the market for chitosan will expand due to its extensive use.
For dairy-based drinks, fruit juices, and alcoholic and non-alcoholic beverages, chitosan is utilized for clarifying, preservation, encapsulation, and as an innovative packaging solution. To make clarified fluids more turbid and homogeneous, it coagulates anionic suspended particles like pectin and proteins. Chitosan is a powerful anti-cholesterol ingredient as well. Therefore, the market for chitosan will expand in the upcoming years due to the expanding food and beverage sector.
In the coming years, the expanding pharmaceutical industry will drive growth in the worldwide chitosan market. The substance is utilized as a scaffold in tissue engineering, a medication carrier, a therapy for obesity, and for wound healing. Chitosan and its derivatives are being studied and researched more and more in the biological field.
Crop yield is increased with agrochemicals. However, overuse can result in the loss of ecological balance, and the deterioration of rivers and soil quality. Chitosan may promote plant growth while also protecting it from dangerous microbes. It is an effective fertilizer and has a good effect on the growth of the roots, shoots, and leaves of numerous crop plants. During the projected period, the usage of chitosan in controlled agrochemical release will enhance the agricultural industry, which will in turn fuel the expansion of the chitosan market.
The chitosan market will grow thanks to the cosmetics industry. The substance functions as an antibacterial agent, surfactant, moisturizer, sunscreen, and UV protection cream. Hair gels, shampoos, colorants, rinses, sprays, tonics, and lotions all make substantial use of it. Teeth, gums, plaque reduction, and oral hygiene are among other common uses.
Based on product type, During the projection period, the industrial-grade category is anticipated to hold a 67% market share of chitosan. It is a low-cost grade of chitosan that is frequently utilized in agrochemical and wastewater treatment applications.
Based on application, As chitosan has good biodegradability, biocompatibility, non-toxicity, and absorption properties, making it perfect for the treatment of wastewater, the water and wastewater segment will experience significant expansion.
Based on region, Due to the significant increase in demand from a variety of end-user industries in developing nations like China and India, Asia-Pacific will experience the highest growth in chitosan market share, with 51%. With a combined 42% of the market, Europe and North America are next.
The authors of this research report have explored the key segments: Type and Application. The report offers an in-depth breakdown of type and application segments and their sub-segments. The lucrativeness and growth potential have been looked into by the industry experts in this report. This section of the report also provides sales and revenue forecast data by type and application segments based on sales, price, and revenue for the period 2017-2028. The specialists, to broaden the understanding of the users, have done value chain and raw material analysis in this section.
The authors of this study have enlightened the readers on the rise and effect of the Covid-19 outbreak on the development. They have investigated the changes brought about in the demand/supply side, consumption, supply chain, and production/manufacturing. The readers will get familiar with the measures that have helped the key players to bring the Chitosan market back to the pre-covid levels.
In this segment of the report, the specialists have delved into the key growth opportunities that are likely to emerge. This will aid the key players to simplify complex issues related to business and framing future strategies to compete in this competitive environment. This section will certainly assist the players in boldly positioning their business.
In this section of the report, the researchers have done a comprehensive analysis of the prominent players operating and the strategies they are focusing on to combat the intense competition. Company profiles and share analysis of the prominent players are also provided in this section. They have also provided reliable sales and revenue data of the manufacturers for the period 2017-2022. With the assistance of this report, key players, stakeholders, and other participants will be able to stay abreast of the recent and upcoming developments in the business, further enabling them to make efficient choices.
|
Report Metric |
Details |
|
Report Name |
Chitosan Market |
|
The market size in 2022 |
USD 95 Million |
|
The revenue forecast in 2028 |
USD 125.5 Million |
|
Growth Rate |
Compound Annual Growth Rate (CAGR) of 4.8% from 2022 to 2028 |
|
Market size available for years |
2022-2028 |
|
Forecast units |
Value (USD) |
|
Segments covered |
By Type, Application, and Region |
|
Report coverage |
Revenue & volume forecast, company share, competitive landscape, growth factors, and trends |
|
Geographic regions covered |
North America, Europe, Asia Pacific, Latin America, Middle East & Africa |
Ans. The global Chitosan market size is estimated to be worth US$ 95 million in 2022 and is forecast to a readjusted size of US$ 125.5 million by 2028.
Ans. The global Chitosan market is expected to grow at a compound annual growth rate of 4.8% from 2022 to 2028.
Ans. Some of the major companies are Primex, Qingdao Yunzhou Biochemistry, Norwegian Chitosan AS, Ningbo Zhenhai Haixin, KitoZyme, BIO21, Vietnam Food, NovaMatrix, Golden-Shell Pharmaceutical, YSK, Weikang Group, Jiangsu Aoxin Biotechnology, KIMICA Corporation, Jiangsu Shuanglin, Mirae biotech, Jinan Haidebei Marine, Meron Group, Dainichiseika Color & Chemicals.
Table of Contents
1 Study Coverage
1.1 Chitosan Product Introduction
1.2 Market by Type
1.2.1 Global Chitosan Market Size by Type, 2017 VS 2021 VS 2028
1.2.2 Pharmaceutical Grade
1.2.3 Food Grade
1.2.4 Industrial Grade
1.3 Market by Application
1.3.1 Global Chitosan Market Size by Application, 2017 VS 2021 VS 2028
1.3.2 Water and Waste Treatment
1.3.3 Food and Beverages
1.3.4 Healthcare and Medical
1.3.5 Agriculture and Agrochemicals
1.3.6 Cosmetics and Toiletries
1.3.7 Others
1.4 Study Objectives
1.5 Years Considered
2 Global Chitosan Production
2.1 Global Chitosan Production Capacity (2017-2028)
2.2 Global Chitosan Production by Region: 2017 VS 2021 VS 2028
2.3 Global Chitosan Production by Region
2.3.1 Global Chitosan Historic Production by Region (2017-2022)
2.3.2 Global Chitosan Forecasted Production by Region (2023-2028)
2.4 North America
2.5 Europe
2.6 China
2.7 Japan
2.8 South Korea
2.9 India
2.10 Mid East & Africa
3 Global Chitosan Sales in Volume & Value Estimates and Forecasts
3.1 Global Chitosan Sales Estimates and Forecasts 2017-2028
3.2 Global Chitosan Revenue Estimates and Forecasts 2017-2028
3.3 Global Chitosan Revenue by Region: 2017 VS 2021 VS 2028
3.4 Global Chitosan Sales by Region
3.4.1 Global Chitosan Sales by Region (2017-2022)
3.4.2 Global Sales Chitosan by Region (2023-2028)
3.5 Global Chitosan Revenue by Region
3.5.1 Global Chitosan Revenue by Region (2017-2022)
3.5.2 Global Chitosan Revenue by Region (2023-2028)
3.6 North America
3.7 Europe
3.8 Asia-Pacific
3.9 Latin America
3.10 Middle East & Africa
4 Competition by Manufactures
4.1 Global Chitosan Production Capacity by Manufacturers
4.2 Global Chitosan Sales by Manufacturers
4.2.1 Global Chitosan Sales by Manufacturers (2017-2022)
4.2.2 Global Chitosan Sales Market Share by Manufacturers (2017-2022)
4.2.3 Global Top 10 and Top 5 Largest Manufacturers of Chitosan in 2021
4.3 Global Chitosan Revenue by Manufacturers
4.3.1 Global Chitosan Revenue by Manufacturers (2017-2022)
4.3.2 Global Chitosan Revenue Market Share by Manufacturers (2017-2022)
4.3.3 Global Top 10 and Top 5 Companies by Chitosan Revenue in 2021
4.4 Global Chitosan Sales Price by Manufacturers
4.5 Analysis of Competitive Landscape
4.5.1 Manufacturers Market Concentration Ratio (CR5 and HHI)
4.5.2 Global Chitosan Market Share by Company Type (Tier 1, Tier 2, and Tier 3)
4.5.3 Global Chitosan Manufacturers Geographical Distribution
4.6 Mergers & Acquisitions, Expansion Plans
5 Market Size by Type
5.1 Global Chitosan Sales by Type
5.1.1 Global Chitosan Historical Sales by Type (2017-2022)
5.1.2 Global Chitosan Forecasted Sales by Type (2023-2028)
5.1.3 Global Chitosan Sales Market Share by Type (2017-2028)
5.2 Global Chitosan Revenue by Type
5.2.1 Global Chitosan Historical Revenue by Type (2017-2022)
5.2.2 Global Chitosan Forecasted Revenue by Type (2023-2028)
5.2.3 Global Chitosan Revenue Market Share by Type (2017-2028)
5.3 Global Chitosan Price by Type
5.3.1 Global Chitosan Price by Type (2017-2022)
5.3.2 Global Chitosan Price Forecast by Type (2023-2028)
6 Market Size by Application
6.1 Global Chitosan Sales by Application
6.1.1 Global Chitosan Historical Sales by Application (2017-2022)
6.1.2 Global Chitosan Forecasted Sales by Application (2023-2028)
6.1.3 Global Chitosan Sales Market Share by Application (2017-2028)
6.2 Global Chitosan Revenue by Application
6.2.1 Global Chitosan Historical Revenue by Application (2017-2022)
6.2.2 Global Chitosan Forecasted Revenue by Application (2023-2028)
6.2.3 Global Chitosan Revenue Market Share by Application (2017-2028)
6.3 Global Chitosan Price by Application
6.3.1 Global Chitosan Price by Application (2017-2022)
6.3.2 Global Chitosan Price Forecast by Application (2023-2028)
7 North America
7.1 North America Chitosan Market Size by Type
7.1.1 North America Chitosan Sales by Type (2017-2028)
7.1.2 North America Chitosan Revenue by Type (2017-2028)
7.2 North America Chitosan Market Size by Application
7.2.1 North America Chitosan Sales by Application (2017-2028)
7.2.2 North America Chitosan Revenue by Application (2017-2028)
7.3 North America Chitosan Sales by Country
7.3.1 North America Chitosan Sales by Country (2017-2028)
7.3.2 North America Chitosan Revenue by Country (2017-2028)
7.3.3 U.S.
7.3.4 Canada
8 Europe
8.1 Europe Chitosan Market Size by Type
8.1.1 Europe Chitosan Sales by Type (2017-2028)
8.1.2 Europe Chitosan Revenue by Type (2017-2028)
8.2 Europe Chitosan Market Size by Application
8.2.1 Europe Chitosan Sales by Application (2017-2028)
8.2.2 Europe Chitosan Revenue by Application (2017-2028)
8.3 Europe Chitosan Sales by Country
8.3.1 Europe Chitosan Sales by Country (2017-2028)
8.3.2 Europe Chitosan Revenue by Country (2017-2028)
8.3.3 Germany
8.3.4 France
8.3.5 U.K.
8.3.6 Italy
8.3.7 Russia
9 Asia Pacific
9.1 Asia Pacific Chitosan Market Size by Type
9.1.1 Asia Pacific Chitosan Sales by Type (2017-2028)
9.1.2 Asia Pacific Chitosan Revenue by Type (2017-2028)
9.2 Asia Pacific Chitosan Market Size by Application
9.2.1 Asia Pacific Chitosan Sales by Application (2017-2028)
9.2.2 Asia Pacific Chitosan Revenue by Application (2017-2028)
9.3 Asia Pacific Chitosan Sales by Region
9.3.1 Asia Pacific Chitosan Sales by Region (2017-2028)
9.3.2 Asia Pacific Chitosan Revenue by Region (2017-2028)
9.3.3 China
9.3.4 Japan
9.3.5 South Korea
9.3.6 India
9.3.7 Australia
9.3.8 China Taiwan
9.3.9 Indonesia
9.3.10 Thailand
9.3.11 Malaysia
10 Latin America
10.1 Latin America Chitosan Market Size by Type
10.1.1 Latin America Chitosan Sales by Type (2017-2028)
10.1.2 Latin America Chitosan Revenue by Type (2017-2028)
10.2 Latin America Chitosan Market Size by Application
10.2.1 Latin America Chitosan Sales by Application (2017-2028)
10.2.2 Latin America Chitosan Revenue by Application (2017-2028)
10.3 Latin America Chitosan Sales by Country
10.3.1 Latin America Chitosan Sales by Country (2017-2028)
10.3.2 Latin America Chitosan Revenue by Country (2017-2028)
10.3.3 Mexico
10.3.4 Brazil
10.3.5 Argentina
11 Middle East and Africa
11.1 Middle East and Africa Chitosan Market Size by Type
11.1.1 Middle East and Africa Chitosan Sales by Type (2017-2028)
11.1.2 Middle East and Africa Chitosan Revenue by Type (2017-2028)
11.2 Middle East and Africa Chitosan Market Size by Application
11.2.1 Middle East and Africa Chitosan Sales by Application (2017-2028)
11.2.2 Middle East and Africa Chitosan Revenue by Application (2017-2028)
11.3 Middle East and Africa Chitosan Sales by Country
11.3.1 Middle East and Africa Chitosan Sales by Country (2017-2028)
11.3.2 Middle East and Africa Chitosan Revenue by Country (2017-2028)
11.3.3 Turkey
11.3.4 Saudi Arabia
11.3.5 UAE
12 Corporate Profiles
12.1 Primex
12.1.1 Primex Corporation Information
12.1.2 Primex Overview
12.1.3 Primex Chitosan Sales, Price, Revenue and Gross Margin (2017-2022)
12.1.4 Primex Chitosan Product Model Numbers, Pictures, Descriptions and Specifications
12.1.5 Primex Recent Developments
12.2 Qingdao Yunzhou Biochemistry
12.2.1 Qingdao Yunzhou Biochemistry Corporation Information
12.2.2 Qingdao Yunzhou Biochemistry Overview
12.2.3 Qingdao Yunzhou Biochemistry Chitosan Sales, Price, Revenue and Gross Margin (2017-2022)
12.2.4 Qingdao Yunzhou Biochemistry Chitosan Product Model Numbers, Pictures, Descriptions and Specifications
12.2.5 Qingdao Yunzhou Biochemistry Recent Developments
12.3 Norwegian Chitosan AS
12.3.1 Norwegian Chitosan AS Corporation Information
12.3.2 Norwegian Chitosan AS Overview
12.3.3 Norwegian Chitosan AS Chitosan Sales, Price, Revenue and Gross Margin (2017-2022)
12.3.4 Norwegian Chitosan AS Chitosan Product Model Numbers, Pictures, Descriptions and Specifications
12.3.5 Norwegian Chitosan AS Recent Developments
12.4 Ningbo Zhenhai Haixin
12.4.1 Ningbo Zhenhai Haixin Corporation Information
12.4.2 Ningbo Zhenhai Haixin Overview
12.4.3 Ningbo Zhenhai Haixin Chitosan Sales, Price, Revenue and Gross Margin (2017-2022)
12.4.4 Ningbo Zhenhai Haixin Chitosan Product Model Numbers, Pictures, Descriptions and Specifications
12.4.5 Ningbo Zhenhai Haixin Recent Developments
12.5 KitoZyme
12.5.1 KitoZyme Corporation Information
12.5.2 KitoZyme Overview
12.5.3 KitoZyme Chitosan Sales, Price, Revenue and Gross Margin (2017-2022)
12.5.4 KitoZyme Chitosan Product Model Numbers, Pictures, Descriptions and Specifications
12.5.5 KitoZyme Recent Developments
12.6 BIO21
12.6.1 BIO21 Corporation Information
12.6.2 BIO21 Overview
12.6.3 BIO21 Chitosan Sales, Price, Revenue and Gross Margin (2017-2022)
12.6.4 BIO21 Chitosan Product Model Numbers, Pictures, Descriptions and Specifications
12.6.5 BIO21 Recent Developments
12.7 Vietnam Food
12.7.1 Vietnam Food Corporation Information
12.7.2 Vietnam Food Overview
12.7.3 Vietnam Food Chitosan Sales, Price, Revenue and Gross Margin (2017-2022)
12.7.4 Vietnam Food Chitosan Product Model Numbers, Pictures, Descriptions and Specifications
12.7.5 Vietnam Food Recent Developments
12.8 NovaMatrix
12.8.1 NovaMatrix Corporation Information
12.8.2 NovaMatrix Overview
12.8.3 NovaMatrix Chitosan Sales, Price, Revenue and Gross Margin (2017-2022)
12.8.4 NovaMatrix Chitosan Product Model Numbers, Pictures, Descriptions and Specifications
12.8.5 NovaMatrix Recent Developments
12.9 Golden-Shell Pharmaceutical
12.9.1 Golden-Shell Pharmaceutical Corporation Information
12.9.2 Golden-Shell Pharmaceutical Overview
12.9.3 Golden-Shell Pharmaceutical Chitosan Sales, Price, Revenue and Gross Margin (2017-2022)
12.9.4 Golden-Shell Pharmaceutical Chitosan Product Model Numbers, Pictures, Descriptions and Specifications
12.9.5 Golden-Shell Pharmaceutical Recent Developments
12.10 YSK
12.10.1 YSK Corporation Information
12.10.2 YSK Overview
12.10.3 YSK Chitosan Sales, Price, Revenue and Gross Margin (2017-2022)
12.10.4 YSK Chitosan Product Model Numbers, Pictures, Descriptions and Specifications
12.10.5 YSK Recent Developments
12.11 Weikang Group
12.11.1 Weikang Group Corporation Information
12.11.2 Weikang Group Overview
12.11.3 Weikang Group Chitosan Sales, Price, Revenue and Gross Margin (2017-2022)
12.11.4 Weikang Group Chitosan Product Model Numbers, Pictures, Descriptions and Specifications
12.11.5 Weikang Group Recent Developments
12.12 Jiangsu Aoxin Biotechnology
12.12.1 Jiangsu Aoxin Biotechnology Corporation Information
12.12.2 Jiangsu Aoxin Biotechnology Overview
12.12.3 Jiangsu Aoxin Biotechnology Chitosan Sales, Price, Revenue and Gross Margin (2017-2022)
12.12.4 Jiangsu Aoxin Biotechnology Chitosan Product Model Numbers, Pictures, Descriptions and Specifications
12.12.5 Jiangsu Aoxin Biotechnology Recent Developments
12.13 KIMICA Corporation
12.13.1 KIMICA Corporation Corporation Information
12.13.2 KIMICA Corporation Overview
12.13.3 KIMICA Corporation Chitosan Sales, Price, Revenue and Gross Margin (2017-2022)
12.13.4 KIMICA Corporation Chitosan Product Model Numbers, Pictures, Descriptions and Specifications
12.13.5 KIMICA Corporation Recent Developments
12.14 Jiangsu Shuanglin
12.14.1 Jiangsu Shuanglin Corporation Information
12.14.2 Jiangsu Shuanglin Overview
12.14.3 Jiangsu Shuanglin Chitosan Sales, Price, Revenue and Gross Margin (2017-2022)
12.14.4 Jiangsu Shuanglin Chitosan Product Model Numbers, Pictures, Descriptions and Specifications
12.14.5 Jiangsu Shuanglin Recent Developments
12.15 Mirae biotech
12.15.1 Mirae biotech Corporation Information
12.15.2 Mirae biotech Overview
12.15.3 Mirae biotech Chitosan Sales, Price, Revenue and Gross Margin (2017-2022)
12.15.4 Mirae biotech Chitosan Product Model Numbers, Pictures, Descriptions and Specifications
12.15.5 Mirae biotech Recent Developments
12.16 Jinan Haidebei Marine
12.16.1 Jinan Haidebei Marine Corporation Information
12.16.2 Jinan Haidebei Marine Overview
12.16.3 Jinan Haidebei Marine Chitosan Sales, Price, Revenue and Gross Margin (2017-2022)
12.16.4 Jinan Haidebei Marine Chitosan Product Model Numbers, Pictures, Descriptions and Specifications
12.16.5 Jinan Haidebei Marine Recent Developments
12.17 Meron Group
12.17.1 Meron Group Corporation Information
12.17.2 Meron Group Overview
12.17.3 Meron Group Chitosan Sales, Price, Revenue and Gross Margin (2017-2022)
12.17.4 Meron Group Chitosan Product Model Numbers, Pictures, Descriptions and Specifications
12.17.5 Meron Group Recent Developments
12.18 Dainichiseika Color & Chemicals
12.18.1 Dainichiseika Color & Chemicals Corporation Information
12.18.2 Dainichiseika Color & Chemicals Overview
12.18.3 Dainichiseika Color & Chemicals Chitosan Sales, Price, Revenue and Gross Margin (2017-2022)
12.18.4 Dainichiseika Color & Chemicals Chitosan Product Model Numbers, Pictures, Descriptions and Specifications
12.18.5 Dainichiseika Color & Chemicals Recent Developments
13 Industry Chain and Sales Channels Analysis
13.1 Chitosan Industry Chain Analysis
13.2 Chitosan Key Raw Materials
13.2.1 Key Raw Materials
13.2.2 Raw Materials Key Suppliers
13.3 Chitosan Production Mode & Process
13.4 Chitosan Sales and Marketing
13.4.1 Chitosan Sales Channels
13.4.2 Chitosan Distributors
13.5 Chitosan Customers
14 Market Drivers, Opportunities, Challenges and Risks Factors Analysis
14.1 Chitosan Industry Trends
14.2 Chitosan Market Drivers
14.3 Chitosan Market Challenges
14.4 Chitosan Market Restraints
15 Key Finding in The Global Chitosan Study
16 Appendix
16.1 Research Methodology
16.1.1 Methodology/Research Approach
16.1.2 Data Source
16.2 Author Details
16.3 Disclaimer
List of Tables
Table 1. Global Chitosan Market Size Growth Rate by Type, 2017 VS 2021 VS 2028 (US$ Million)
Table 2. Major Manufacturers of Pharmaceutical Grade
Table 3. Major Manufacturers of Food Grade
Table 4. Major Manufacturers of Industrial Grade
Table 5. Global Chitosan Market Size Growth Rate by Application, 2017 VS 2021 2028 (US$ Million)
Table 6. Global Chitosan Production by Region: 2017 VS 2021 VS 2028 (MT)
Table 7. Global Chitosan Production by Region (2017-2022) & (MT)
Table 8. Global Chitosan Production Market Share by Region (2017-2022)
Table 9. Global Chitosan Production by Region (2023-2028) & (MT)
Table 10. Global Chitosan Production Market Share by Region (2023-2028)
Table 11. Global Chitosan Revenue by Region: 2017 VS 2021 VS 2028 (US$ Million)
Table 12. Global Chitosan Sales by Region (2017-2022) & (MT)
Table 13. Global Chitosan Sales Market Share by Region (2017-2022)
Table 14. Global Chitosan Sales by Region (2023-2028) & (MT)
Table 15. Global Chitosan Sales Market Share by Region (2023-2028)
Table 16. Global Chitosan Revenue by Region (2017-2022) & (US$ Million)
Table 17. Global Chitosan Revenue Market Share by Region (2017-2022)
Table 18. Global Chitosan Revenue by Region (2023-2028) & (US$ Million)
Table 19. Global Chitosan Revenue Market Share by Region (2023-2028)
Table 20. Global Chitosan Production Capacity by Manufacturers (2017-2022) & (MT)
Table 21. Global Chitosan Capacity Market Share by Manufacturers (2017-2022)
Table 22. Global Chitosan Sales by Manufacturers (2017-2022) & (MT)
Table 23. Global Chitosan Sales Market Share by Manufacturers (2017-2022)
Table 24. Global Chitosan Revenue by Manufacturers (2017-2022) & (US$ Million)
Table 25. Global Chitosan Revenue Share by Manufacturers (2017-2022)
Table 26. Chitosan Price by Manufacturers 2017-2022 (US$/MT)
Table 27. Global Chitosan Manufacturers Market Concentration Ratio (CR5 and HHI)
Table 28. Global Chitosan by Company Type (Tier 1, Tier 2, and Tier 3) & (based on the Revenue in Chitosan as of 2021)
Table 29. Chitosan Manufacturing Base Distribution and Headquarters
Table 30. Manufacturers Chitosan Product Offered
Table 31. Date of Manufacturers Enter into Chitosan Market
Table 32. Mergers & Acquisitions, Expansion Plans
Table 33. Global Chitosan Sales by Type (2017-2022) & (MT)
Table 34. Global Chitosan Sales by Type (2023-2028) & (MT)
Table 35. Global Chitosan Sales Share by Type (2017-2022)
Table 36. Global Chitosan Sales Share by Type (2023-2028)
Table 37. Global Chitosan Revenue by Type (2017-2022) & (US$ Million)
Table 38. Global Chitosan Revenue by Type (2023-2028) & (US$ Million)
Table 39. Global Chitosan Revenue Share by Type (2017-2022)
Table 40. Global Chitosan Revenue Share by Type (2023-2028)
Table 41. Chitosan Price by Type (2017-2022) & (US$/MT)
Table 42. Global Chitosan Price Forecast by Type (2023-2028) & (US$/MT)
Table 43. Global Chitosan Sales by Application (2017-2022) & (MT)
Table 44. Global Chitosan Sales by Application (2023-2028) & (MT)
Table 45. Global Chitosan Sales Share by Application (2017-2022)
Table 46. Global Chitosan Sales Share by Application (2023-2028)
Table 47. Global Chitosan Revenue by Application (2017-2022) & (US$ Million)
Table 48. Global Chitosan Revenue by Application (2023-2028) & (US$ Million)
Table 49. Global Chitosan Revenue Share by Application (2017-2022)
Table 50. Global Chitosan Revenue Share by Application (2023-2028)
Table 51. Chitosan Price by Application (2017-2022) & (US$/MT)
Table 52. Global Chitosan Price Forecast by Application (2023-2028) & (US$/MT)
Table 53. North America Chitosan Sales by Type (2017-2022) & (MT)
Table 54. North America Chitosan Sales by Type (2023-2028) & (MT)
Table 55. North America Chitosan Revenue by Type (2017-2022) & (US$ Million)
Table 56. North America Chitosan Revenue by Type (2023-2028) & (US$ Million)
Table 57. North America Chitosan Sales by Application (2017-2022) & (MT)
Table 58. North America Chitosan Sales by Application (2023-2028) & (MT)
Table 59. North America Chitosan Revenue by Application (2017-2022) & (US$ Million)
Table 60. North America Chitosan Revenue by Application (2023-2028) & (US$ Million)
Table 61. North America Chitosan Sales by Country (2017-2022) & (MT)
Table 62. North America Chitosan Sales by Country (2023-2028) & (MT)
Table 63. North America Chitosan Revenue by Country (2017-2022) & (US$ Million)
Table 64. North America Chitosan Revenue by Country (2023-2028) & (US$ Million)
Table 65. Europe Chitosan Sales by Type (2017-2022) & (MT)
Table 66. Europe Chitosan Sales by Type (2023-2028) & (MT)
Table 67. Europe Chitosan Revenue by Type (2017-2022) & (US$ Million)
Table 68. Europe Chitosan Revenue by Type (2023-2028) & (US$ Million)
Table 69. Europe Chitosan Sales by Application (2017-2022) & (MT)
Table 70. Europe Chitosan Sales by Application (2023-2028) & (MT)
Table 71. Europe Chitosan Revenue by Application (2017-2022) & (US$ Million)
Table 72. Europe Chitosan Revenue by Application (2023-2028) & (US$ Million)
Table 73. Europe Chitosan Sales by Country (2017-2022) & (MT)
Table 74. Europe Chitosan Sales by Country (2023-2028) & (MT)
Table 75. Europe Chitosan Revenue by Country (2017-2022) & (US$ Million)
Table 76. Europe Chitosan Revenue by Country (2023-2028) & (US$ Million)
Table 77. Asia Pacific Chitosan Sales by Type (2017-2022) & (MT)
Table 78. Asia Pacific Chitosan Sales by Type (2023-2028) & (MT)
Table 79. Asia Pacific Chitosan Revenue by Type (2017-2022) & (US$ Million)
Table 80. Asia Pacific Chitosan Revenue by Type (2023-2028) & (US$ Million)
Table 81. Asia Pacific Chitosan Sales by Application (2017-2022) & (MT)
Table 82. Asia Pacific Chitosan Sales by Application (2023-2028) & (MT)
Table 83. Asia Pacific Chitosan Revenue by Application (2017-2022) & (US$ Million)
Table 84. Asia Pacific Chitosan Revenue by Application (2023-2028) & (US$ Million)
Table 85. Asia Pacific Chitosan Sales by Region (2017-2022) & (MT)
Table 86. Asia Pacific Chitosan Sales by Region (2023-2028) & (MT)
Table 87. Asia Pacific Chitosan Revenue by Region (2017-2022) & (US$ Million)
Table 88. Asia Pacific Chitosan Revenue by Region (2023-2028) & (US$ Million)
Table 89. Latin America Chitosan Sales by Type (2017-2022) & (MT)
Table 90. Latin America Chitosan Sales by Type (2023-2028) & (MT)
Table 91. Latin America Chitosan Revenue by Type (2017-2022) & (US$ Million)
Table 92. Latin America Chitosan Revenue by Type (2023-2028) & (US$ Million)
Table 93. Latin America Chitosan Sales by Application (2017-2022) & (MT)
Table 94. Latin America Chitosan Sales by Application (2023-2028) & (MT)
Table 95. Latin America Chitosan Revenue by Application (2017-2022) & (US$ Million)
Table 96. Latin America Chitosan Revenue by Application (2023-2028) & (US$ Million)
Table 97. Latin America Chitosan Sales by Country (2017-2022) & (MT)
Table 98. Latin America Chitosan Sales by Country (2023-2028) & (MT)
Table 99. Latin America Chitosan Revenue by Country (2017-2022) & (US$ Million)
Table 100. Latin America Chitosan Revenue by Country (2023-2028) & (US$ Million)
Table 101. Middle East and Africa Chitosan Sales by Type (2017-2022) & (MT)
Table 102. Middle East and Africa Chitosan Sales by Type (2023-2028) & (MT)
Table 103. Middle East and Africa Chitosan Revenue by Type (2017-2022) & (US$ Million)
Table 104. Middle East and Africa Chitosan Revenue by Type (2023-2028) & (US$ Million)
Table 105. Middle East and Africa Chitosan Sales by Application (2017-2022) & (MT)
Table 106. Middle East and Africa Chitosan Sales by Application (2023-2028) & (MT)
Table 107. Middle East and Africa Chitosan Revenue by Application (2017-2022) & (US$ Million)
Table 108. Middle East and Africa Chitosan Revenue by Application (2023-2028) & (US$ Million)
Table 109. Middle East and Africa Chitosan Sales by Country (2017-2022) & (MT)
Table 110. Middle East and Africa Chitosan Sales by Country (2023-2028) & (MT)
Table 111. Middle East and Africa Chitosan Revenue by Country (2017-2022) & (US$ Million)
Table 112. Middle East and Africa Chitosan Revenue by Country (2023-2028) & (US$ Million)
Table 113. Primex Corporation Information
Table 114. Primex Description and Major Businesses
Table 115. Primex Chitosan Sales (MT), Revenue (US$ Million), Price (US$/MT) and Gross Margin (2017-2022)
Table 116. Primex Chitosan Product Model Numbers, Pictures, Descriptions and Specifications
Table 117. Primex Recent Development
Table 118. Qingdao Yunzhou Biochemistry Corporation Information
Table 119. Qingdao Yunzhou Biochemistry Description and Major Businesses
Table 120. Qingdao Yunzhou Biochemistry Chitosan Sales (MT), Revenue (US$ Million), Price (US$/MT) and Gross Margin (2017-2022)
Table 121. Qingdao Yunzhou Biochemistry Chitosan Product Model Numbers, Pictures, Descriptions and Specifications
Table 122. Qingdao Yunzhou Biochemistry Recent Development
Table 123. Norwegian Chitosan AS Corporation Information
Table 124. Norwegian Chitosan AS Description and Major Businesses
Table 125. Norwegian Chitosan AS Chitosan Sales (MT), Revenue (US$ Million), Price (US$/MT) and Gross Margin (2017-2022)
Table 126. Norwegian Chitosan AS Chitosan Product Model Numbers, Pictures, Descriptions and Specifications
Table 127. Norwegian Chitosan AS Recent Development
Table 128. Ningbo Zhenhai Haixin Corporation Information
Table 129. Ningbo Zhenhai Haixin Description and Major Businesses
Table 130. Ningbo Zhenhai Haixin Chitosan Sales (MT), Revenue (US$ Million), Price (US$/MT) and Gross Margin (2017-2022)
Table 131. Ningbo Zhenhai Haixin Chitosan Product Model Numbers, Pictures, Descriptions and Specifications
Table 132. Ningbo Zhenhai Haixin Recent Development
Table 133. KitoZyme Corporation Information
Table 134. KitoZyme Description and Major Businesses
Table 135. KitoZyme Chitosan Sales (MT), Revenue (US$ Million), Price (US$/MT) and Gross Margin (2017-2022)
Table 136. KitoZyme Chitosan Product Model Numbers, Pictures, Descriptions and Specifications
Table 137. KitoZyme Recent Development
Table 138. BIO21 Corporation Information
Table 139. BIO21 Description and Major Businesses
Table 140. BIO21 Chitosan Sales (MT), Revenue (US$ Million), Price (US$/MT) and Gross Margin (2017-2022)
Table 141. BIO21 Chitosan Product Model Numbers, Pictures, Descriptions and Specifications
Table 142. BIO21 Recent Development
Table 143. Vietnam Food Corporation Information
Table 144. Vietnam Food Description and Major Businesses
Table 145. Vietnam Food Chitosan Sales (MT), Revenue (US$ Million), Price (US$/MT) and Gross Margin (2017-2022)
Table 146. Vietnam Food Chitosan Product Model Numbers, Pictures, Descriptions and Specifications
Table 147. Vietnam Food Recent Development
Table 148. NovaMatrix Corporation Information
Table 149. NovaMatrix Description and Major Businesses
Table 150. NovaMatrix Chitosan Sales (MT), Revenue (US$ Million), Price (US$/MT) and Gross Margin (2017-2022)
Table 151. NovaMatrix Chitosan Product Model Numbers, Pictures, Descriptions and Specifications
Table 152. NovaMatrix Recent Development
Table 153. Golden-Shell Pharmaceutical Corporation Information
Table 154. Golden-Shell Pharmaceutical Description and Major Businesses
Table 155. Golden-Shell Pharmaceutical Chitosan Sales (MT), Revenue (US$ Million), Price (US$/MT) and Gross Margin (2017-2022)
Table 156. Golden-Shell Pharmaceutical Chitosan Product Model Numbers, Pictures, Descriptions and Specifications
Table 157. Golden-Shell Pharmaceutical Recent Development
Table 158. YSK Corporation Information
Table 159. YSK Description and Major Businesses
Table 160. YSK Chitosan Sales (MT), Revenue (US$ Million), Price (US$/MT) and Gross Margin (2017-2022)
Table 161. YSK Chitosan Product Model Numbers, Pictures, Descriptions and Specifications
Table 162. YSK Recent Development
Table 163. Weikang Group Corporation Information
Table 164. Weikang Group Description and Major Businesses
Table 165. Weikang Group Chitosan Sales (MT), Revenue (US$ Million), Price (US$/MT) and Gross Margin (2017-2022)
Table 166. Weikang Group Chitosan Product Model Numbers, Pictures, Descriptions and Specifications
Table 167. Weikang Group Recent Development
Table 168. Jiangsu Aoxin Biotechnology Corporation Information
Table 169. Jiangsu Aoxin Biotechnology Description and Major Businesses
Table 170. Jiangsu Aoxin Biotechnology Chitosan Sales (MT), Revenue (US$ Million), Price (US$/MT) and Gross Margin (2017-2022)
Table 171. Jiangsu Aoxin Biotechnology Chitosan Product Model Numbers, Pictures, Descriptions and Specifications
Table 172. Jiangsu Aoxin Biotechnology Recent Development
Table 173. KIMICA Corporation Corporation Information
Table 174. KIMICA Corporation Description and Major Businesses
Table 175. KIMICA Corporation Chitosan Sales (MT), Revenue (US$ Million), Price (US$/MT) and Gross Margin (2017-2022)
Table 176. KIMICA Corporation Chitosan Product Model Numbers, Pictures, Descriptions and Specifications
Table 177. KIMICA Corporation Recent Development
Table 178. Jiangsu Shuanglin Corporation Information
Table 179. Jiangsu Shuanglin Description and Major Businesses
Table 180. Jiangsu Shuanglin Chitosan Sales (MT), Revenue (US$ Million), Price (US$/MT) and Gross Margin (2017-2022)
Table 181. Jiangsu Shuanglin Chitosan Product Model Numbers, Pictures, Descriptions and Specifications
Table 182. Jiangsu Shuanglin Recent Development
Table 183. Mirae biotech Corporation Information
Table 184. Mirae biotech Description and Major Businesses
Table 185. Mirae biotech Chitosan Sales (MT), Revenue (US$ Million), Price (US$/MT) and Gross Margin (2017-2022)
Table 186. Mirae biotech Chitosan Product Model Numbers, Pictures, Descriptions and Specifications
Table 187. Mirae biotech Recent Development
Table 188. Jinan Haidebei Marine Corporation Information
Table 189. Jinan Haidebei Marine Description and Major Businesses
Table 190. Jinan Haidebei Marine Chitosan Sales (MT), Revenue (US$ Million), Price (US$/MT) and Gross Margin (2017-2022)
Table 191. Jinan Haidebei Marine Chitosan Product Model Numbers, Pictures, Descriptions and Specifications
Table 192. Jinan Haidebei Marine Recent Development
Table 193. Meron Group Corporation Information
Table 194. Meron Group Description and Major Businesses
Table 195. Meron Group Chitosan Sales (MT), Revenue (US$ Million), Price (US$/MT) and Gross Margin (2017-2022)
Table 196. Meron Group Chitosan Product Model Numbers, Pictures, Descriptions and Specifications
Table 197. Meron Group Recent Development
Table 198. Dainichiseika Color & Chemicals Corporation Information
Table 199. Dainichiseika Color & Chemicals Description and Major Businesses
Table 200. Dainichiseika Color & Chemicals Chitosan Sales (MT), Revenue (US$ Million), Price (US$/MT) and Gross Margin (2017-2022)
Table 201. Dainichiseika Color & Chemicals Chitosan Product Model Numbers, Pictures, Descriptions and Specifications
Table 202. Dainichiseika Color & Chemicals Recent Development
Table 203. Key Raw Materials Lists
Table 204. Raw Materials Key Suppliers Lists
Table 205. Chitosan Distributors List
Table 206. Chitosan Customers List
Table 207. Chitosan Market Trends
Table 208. Chitosan Market Drivers
Table 209. Chitosan Market Challenges
Table 210. Chitosan Market Restraints
Table 211. Research Programs/Design for This Report
Table 212. Key Data Information from Secondary Sources
Table 213. Key Data Information from Primary Sources
List of Figures
Figure 1. Chitosan Product Picture
Figure 2. Global Chitosan Market Share by Type in 2021 & 2028
Figure 3. Pharmaceutical Grade Product Picture
Figure 4. Food Grade Product Picture
Figure 5. Industrial Grade Product Picture
Figure 6. Global Chitosan Market Share by Application in 2021 & 2028
Figure 7. Water and Waste Treatment
Figure 8. Food and Beverages
Figure 9. Healthcare and Medical
Figure 10. Agriculture and Agrochemicals
Figure 11. Cosmetics and Toiletries
Figure 12. Others
Figure 13. Chitosan Report Years Considered
Figure 14. Global Chitosan Capacity, Production and Utilization (2017-2028) & (MT)
Figure 15. Global Chitosan Production Market Share by Region in Percentage: 2021 Versus 2028
Figure 16. Global Chitosan Production Market Share by Region (2017-2022)
Figure 17. Global Chitosan Production Market Share by Region (2023-2028)
Figure 18. Chitosan Production Growth Rate in North America (2017-2028) & (MT)
Figure 19. Chitosan Production Growth Rate in Europe (2017-2028) & (MT)
Figure 20. Chitosan Production Growth Rate in China (2017-2028) & (MT)
Figure 21. Chitosan Production Growth Rate in Japan (2017-2028) & (MT)
Figure 22. Chitosan Production Growth Rate in South Korea (2017-2028) & (MT)
Figure 23. Chitosan Production Growth Rate in India (2017-2028) & (MT)
Figure 24. Chitosan Production Growth Rate in Mid East & Africa (2017-2028) & (MT)
Figure 25. Global Chitosan Sales 2017-2028 (MT)
Figure 26. Global Chitosan Revenue, (US$ Million), 2017 VS 2021 VS 2028
Figure 27. Global Chitosan Revenue 2017-2028 (US$ Million)
Figure 28. Global Chitosan Revenue Market Share by Region in Percentage: 2021 Versus 2028
Figure 29. Global Chitosan Sales Market Share by Region (2017-2022)
Figure 30. Global Chitosan Sales Market Share by Region (2023-2028)
Figure 31. North America Chitosan Sales YoY (2017-2028) & (MT)
Figure 32. North America Chitosan Revenue YoY (2017-2028) & (US$ Million)
Figure 33. Europe Chitosan Sales YoY (2017-2028) & (MT)
Figure 34. Europe Chitosan Revenue YoY (2017-2028) & (US$ Million)
Figure 35. Asia-Pacific Chitosan Sales YoY (2017-2028) & (MT)
Figure 36. Asia-Pacific Chitosan Revenue YoY (2017-2028) & (US$ Million)
Figure 37. Latin America Chitosan Sales YoY (2017-2028) & (MT)
Figure 38. Latin America Chitosan Revenue YoY (2017-2028) & (US$ Million)
Figure 39. Middle East & Africa Chitosan Sales YoY (2017-2028) & (MT)
Figure 40. Middle East & Africa Chitosan Revenue YoY (2017-2028) & (US$ Million)
Figure 41. The Chitosan Market Share of Top 10 and Top 5 Largest Manufacturers Around the World in 2021
Figure 42. The Top 5 and 10 Largest Manufacturers of Chitosan in the World: Market Share by Chitosan Revenue in 2021
Figure 43. Chitosan Market Share by Company Type (Tier 1, Tier 2, and Tier 3): 2017 VS 2021
Figure 44. Global Chitosan Sales Market Share by Type (2017-2028)
Figure 45. Global Chitosan Revenue Market Share by Type (2017-2028)
Figure 46. Global Chitosan Sales Market Share by Application (2017-2028)
Figure 47. Global Chitosan Revenue Market Share by Application (2017-2028)
Figure 48. North America Chitosan Sales Market Share by Type (2017-2028)
Figure 49. North America Chitosan Revenue Market Share by Type (2017-2028)
Figure 50. North America Chitosan Sales Market Share by Application (2017-2028)
Figure 51. North America Chitosan Revenue Market Share by Application (2017-2028)
Figure 52. North America Chitosan Sales Share by Country (2017-2028)
Figure 53. North America Chitosan Revenue Share by Country (2017-2028)
Figure 54. U.S. Chitosan Revenue (2017-2028) & (US$ Million)
Figure 55. Canada Chitosan Revenue (2017-2028) & (US$ Million)
Figure 56. Europe Chitosan Sales Market Share by Type (2017-2028)
Figure 57. Europe Chitosan Revenue Market Share by Type (2017-2028)
Figure 58. Europe Chitosan Sales Market Share by Application (2017-2028)
Figure 59. Europe Chitosan Revenue Market Share by Application (2017-2028)
Figure 60. Europe Chitosan Sales Share by Country (2017-2028)
Figure 61. Europe Chitosan Revenue Share by Country (2017-2028)
Figure 62. Germany Chitosan Revenue (2017-2028) & (US$ Million)
Figure 63. France Chitosan Revenue (2017-2028) & (US$ Million)
Figure 64. U.K. Chitosan Revenue (2017-2028) & (US$ Million)
Figure 65. Italy Chitosan Revenue (2017-2028) & (US$ Million)
Figure 66. Russia Chitosan Revenue (2017-2028) & (US$ Million)
Figure 67. Asia Pacific Chitosan Sales Market Share by Type (2017-2028)
Figure 68. Asia Pacific Chitosan Revenue Market Share by Type (2017-2028)
Figure 69. Asia Pacific Chitosan Sales Market Share by Application (2017-2028)
Figure 70. Asia Pacific Chitosan Revenue Market Share by Application (2017-2028)
Figure 71. Asia Pacific Chitosan Sales Share by Region (2017-2028)
Figure 72. Asia Pacific Chitosan Revenue Share by Region (2017-2028)
Figure 73. China Chitosan Revenue (2017-2028) & (US$ Million)
Figure 74. Japan Chitosan Revenue (2017-2028) & (US$ Million)
Figure 75. South Korea Chitosan Revenue (2017-2028) & (US$ Million)
Figure 76. India Chitosan Revenue (2017-2028) & (US$ Million)
Figure 77. Australia Chitosan Revenue (2017-2028) & (US$ Million)
Figure 78. China Taiwan Chitosan Revenue (2017-2028) & (US$ Million)
Figure 79. Indonesia Chitosan Revenue (2017-2028) & (US$ Million)
Figure 80. Thailand Chitosan Revenue (2017-2028) & (US$ Million)
Figure 81. Malaysia Chitosan Revenue (2017-2028) & (US$ Million)
Figure 82. Latin America Chitosan Sales Market Share by Type (2017-2028)
Figure 83. Latin America Chitosan Revenue Market Share by Type (2017-2028)
Figure 84. Latin America Chitosan Sales Market Share by Application (2017-2028)
Figure 85. Latin America Chitosan Revenue Market Share by Application (2017-2028)
Figure 86. Latin America Chitosan Sales Share by Country (2017-2028)
Figure 87. Latin America Chitosan Revenue Share by Country (2017-2028)
Figure 88. Mexico Chitosan Revenue (2017-2028) & (US$ Million)
Figure 89. Brazil Chitosan Revenue (2017-2028) & (US$ Million)
Figure 90. Argentina Chitosan Revenue (2017-2028) & (US$ Million)
Figure 91. Middle East and Africa Chitosan Sales Market Share by Type (2017-2028)
Figure 92. Middle East and Africa Chitosan Revenue Market Share by Type (2017-2028)
Figure 93. Middle East and Africa Chitosan Sales Market Share by Application (2017-2028)
Figure 94. Middle East and Africa Chitosan Revenue Market Share by Application (2017-2028)
Figure 95. Middle East and Africa Chitosan Sales Share by Country (2017-2028)
Figure 96. Middle East and Africa Chitosan Revenue Share by Country (2017-2028)
Figure 97. Turkey Chitosan Revenue (2017-2028) & (US$ Million)
Figure 98. Saudi Arabia Chitosan Revenue (2017-2028) & (US$ Million)
Figure 99. UAE Chitosan Revenue (2017-2028) & (US$ Million)
Figure 100. Chitosan Value Chain
Figure 101. Chitosan Production Process
Figure 102. Channels of Distribution
Figure 103. Distributors Profiles
Figure 104. Bottom-up and Top-down Approaches for This Report
Figure 105. Data Triangulation
Figure 106. Key Executives Interviewed
$4900
$9800
HAVE A QUERY?
OUR CUSTOMER
