List of Tables
Table 1. Global Generative and Answer Engine Optimization Market Size Growth Rate by Type (US$ Million): 2020 VS 2024 VS 2031
Table 2. Key Players of Generative-AI AEO
Table 3. Key Players of AI-powered Voice AEO
Table 4. Global Generative and Answer Engine Optimization Market Size Growth Rate by Customer (US$ Million): 2020 VS 2024 VS 2031
Table 5. Key Players of B2B
Table 6. Key Players of B2C
Table 7. Global Generative and Answer Engine Optimization Market Size Growth Rate by Industry (US$ Million): 2020 VS 2024 VS 2031
Table 8. Key Players of E-commerce
Table 9. Key Players of Manufacturing
Table 10. Key Players of Media
Table 11. Key Players of Consulting
Table 12. Key Players of Travel
Table 13. Key Players of Financial Service
Table 14. Key Players of Others
Table 15. Global Generative and Answer Engine Optimization Market Size Growth by Application (US$ Million): 2020 VS 2024 VS 2031
Table 16. Global Generative and Answer Engine Optimization Market Size by Region (US$ Million): 2020 VS 2024 VS 2031
Table 17. Global Generative and Answer Engine Optimization Market Size by Region (2020-2025) & (US$ Million)
Table 18. Global Generative and Answer Engine Optimization Market Share by Region (2020-2025)
Table 19. Global Generative and Answer Engine Optimization Forecasted Market Size by Region (2026-2031) & (US$ Million)
Table 20. Global Generative and Answer Engine Optimization Market Share by Region (2026-2031)
Table 21. Generative and Answer Engine Optimization Market Trends
Table 22. Generative and Answer Engine Optimization Market Drivers
Table 23. Generative and Answer Engine Optimization Market Challenges
Table 24. Generative and Answer Engine Optimization Market Restraints
Table 25. Global Generative and Answer Engine Optimization Revenue by Players (2020-2025) & (US$ Million)
Table 26. Global Generative and Answer Engine Optimization Market Share by Players (2020-2025)
Table 27. Global Top Generative and Answer Engine Optimization Players by Company Type (Tier 1, Tier 2, and Tier 3) & (based on the Revenue in Generative and Answer Engine Optimization as of 2024)
Table 28. Ranking of Global Top Generative and Answer Engine Optimization Companies by Revenue (US$ Million) in 2024
Table 29. Global 5 Largest Players Market Share by Generative and Answer Engine Optimization Revenue (CR5 and HHI) & (2020-2025)
Table 30. Global Key Players of Generative and Answer Engine Optimization, Headquarters and Area Served
Table 31. Global Key Players of Generative and Answer Engine Optimization, Product and Application
Table 32. Global Key Players of Generative and Answer Engine Optimization, Date of Enter into This Industry
Table 33. Mergers & Acquisitions, Expansion Plans
Table 34. Global Generative and Answer Engine Optimization Market Size by Type (2020-2025) & (US$ Million)
Table 35. Global Generative and Answer Engine Optimization Revenue Market Share by Type (2020-2025)
Table 36. Global Generative and Answer Engine Optimization Forecasted Market Size by Type (2026-2031) & (US$ Million)
Table 37. Global Generative and Answer Engine Optimization Revenue Market Share by Type (2026-2031)
Table 38. Global Generative and Answer Engine Optimization Market Size by Application (2020-2025) & (US$ Million)
Table 39. Global Generative and Answer Engine Optimization Revenue Market Share by Application (2020-2025)
Table 40. Global Generative and Answer Engine Optimization Forecasted Market Size by Application (2026-2031) & (US$ Million)
Table 41. Global Generative and Answer Engine Optimization Revenue Market Share by Application (2026-2031)
Table 42. North America Generative and Answer Engine Optimization Market Size Growth Rate by Country (US$ Million): 2020 VS 2024 VS 2031
Table 43. North America Generative and Answer Engine Optimization Market Size by Country (2020-2025) & (US$ Million)
Table 44. North America Generative and Answer Engine Optimization Market Size by Country (2026-2031) & (US$ Million)
Table 45. Europe Generative and Answer Engine Optimization Market Size Growth Rate by Country (US$ Million): 2020 VS 2024 VS 2031
Table 46. Europe Generative and Answer Engine Optimization Market Size by Country (2020-2025) & (US$ Million)
Table 47. Europe Generative and Answer Engine Optimization Market Size by Country (2026-2031) & (US$ Million)
Table 48. Asia-Pacific Generative and Answer Engine Optimization Market Size Growth Rate by Region (US$ Million): 2020 VS 2024 VS 2031
Table 49. Asia-Pacific Generative and Answer Engine Optimization Market Size by Region (2020-2025) & (US$ Million)
Table 50. Asia-Pacific Generative and Answer Engine Optimization Market Size by Region (2026-2031) & (US$ Million)
Table 51. Latin America Generative and Answer Engine Optimization Market Size Growth Rate by Country (US$ Million): 2020 VS 2024 VS 2031
Table 52. Latin America Generative and Answer Engine Optimization Market Size by Country (2020-2025) & (US$ Million)
Table 53. Latin America Generative and Answer Engine Optimization Market Size by Country (2026-2031) & (US$ Million)
Table 54. Middle East & Africa Generative and Answer Engine Optimization Market Size Growth Rate by Country (US$ Million): 2020 VS 2024 VS 2031
Table 55. Middle East & Africa Generative and Answer Engine Optimization Market Size by Country (2020-2025) & (US$ Million)
Table 56. Middle East & Africa Generative and Answer Engine Optimization Market Size by Country (2026-2031) & (US$ Million)
Table 57. Semrush Company Details
Table 58. Semrush Business Overview
Table 59. Semrush Generative and Answer Engine Optimization Product
Table 60. Semrush Revenue in Generative and Answer Engine Optimization Business (2020-2025) & (US$ Million)
Table 61. Semrush Recent Development
Table 62. Brainlabs Company Details
Table 63. Brainlabs Business Overview
Table 64. Brainlabs Generative and Answer Engine Optimization Product
Table 65. Brainlabs Revenue in Generative and Answer Engine Optimization Business (2020-2025) & (US$ Million)
Table 66. Brainlabs Recent Development
Table 67. NP Digital Company Details
Table 68. NP Digital Business Overview
Table 69. NP Digital Generative and Answer Engine Optimization Product
Table 70. NP Digital Revenue in Generative and Answer Engine Optimization Business (2020-2025) & (US$ Million)
Table 71. NP Digital Recent Development
Table 72. Similarweb Company Details
Table 73. Similarweb Business Overview
Table 74. Similarweb Generative and Answer Engine Optimization Product
Table 75. Similarweb Revenue in Generative and Answer Engine Optimization Business (2020-2025) & (US$ Million)
Table 76. Similarweb Recent Development
Table 77. WebFX Company Details
Table 78. WebFX Business Overview
Table 79. WebFX Generative and Answer Engine Optimization Product
Table 80. WebFX Revenue in Generative and Answer Engine Optimization Business (2020-2025) & (US$ Million)
Table 81. WebFX Recent Development
Table 82. Profound Company Details
Table 83. Profound Business Overview
Table 84. Profound Generative and Answer Engine Optimization Product
Table 85. Profound Revenue in Generative and Answer Engine Optimization Business (2020-2025) & (US$ Million)
Table 86. Profound Recent Development
Table 87. Contently Company Details
Table 88. Contently Business Overview
Table 89. Contently Generative and Answer Engine Optimization Product
Table 90. Contently Revenue in Generative and Answer Engine Optimization Business (2020-2025) & (US$ Million)
Table 91. Contently Recent Development
Table 92. iQuanti Company Details
Table 93. iQuanti Business Overview
Table 94. iQuanti Generative and Answer Engine Optimization Product
Table 95. iQuanti Revenue in Generative and Answer Engine Optimization Business (2020-2025) & (US$ Million)
Table 96. iQuanti Recent Development
Table 97. Ignite Visibility Company Details
Table 98. Ignite Visibility Business Overview
Table 99. Ignite Visibility Generative and Answer Engine Optimization Product
Table 100. Ignite Visibility Revenue in Generative and Answer Engine Optimization Business (2020-2025) & (US$ Million)
Table 101. Ignite Visibility Recent Development
Table 102. First Page Sage Company Details
Table 103. First Page Sage Business Overview
Table 104. First Page Sage Generative and Answer Engine Optimization Product
Table 105. First Page Sage Revenue in Generative and Answer Engine Optimization Business (2020-2025) & (US$ Million)
Table 106. First Page Sage Recent Development
Table 107. Marcel Digital Company Details
Table 108. Marcel Digital Business Overview
Table 109. Marcel Digital Generative and Answer Engine Optimization Product
Table 110. Marcel Digital Revenue in Generative and Answer Engine Optimization Business (2020-2025) & (US$ Million)
Table 111. Marcel Digital Recent Development
Table 112. Thrive Internet Marketing Agency Company Details
Table 113. Thrive Internet Marketing Agency Business Overview
Table 114. Thrive Internet Marketing Agency Generative and Answer Engine Optimization Product
Table 115. Thrive Internet Marketing Agency Revenue in Generative and Answer Engine Optimization Business (2020-2025) & (US$ Million)
Table 116. Thrive Internet Marketing Agency Recent Development
Table 117. Zen Media Company Details
Table 118. Zen Media Business Overview
Table 119. Zen Media Generative and Answer Engine Optimization Product
Table 120. Zen Media Revenue in Generative and Answer Engine Optimization Business (2020-2025) & (US$ Million)
Table 121. Zen Media Recent Development
Table 122. Rise at Seven Company Details
Table 123. Rise at Seven Business Overview
Table 124. Rise at Seven Generative and Answer Engine Optimization Product
Table 125. Rise at Seven Revenue in Generative and Answer Engine Optimization Business (2020-2025) & (US$ Million)
Table 126. Rise at Seven Recent Development
Table 127. Growth Plays Company Details
Table 128. Growth Plays Business Overview
Table 129. Growth Plays Generative and Answer Engine Optimization Product
Table 130. Growth Plays Revenue in Generative and Answer Engine Optimization Business (2020-2025) & (US$ Million)
Table 131. Growth Plays Recent Development
Table 132. The Ad Firm Company Details
Table 133. The Ad Firm Business Overview
Table 134. The Ad Firm Generative and Answer Engine Optimization Product
Table 135. The Ad Firm Revenue in Generative and Answer Engine Optimization Business (2020-2025) & (US$ Million)
Table 136. The Ad Firm Recent Development
Table 137. NoGood (Berma) Company Details
Table 138. NoGood (Berma) Business Overview
Table 139. NoGood (Berma) Generative and Answer Engine Optimization Product
Table 140. NoGood (Berma) Revenue in Generative and Answer Engine Optimization Business (2020-2025) & (US$ Million)
Table 141. NoGood (Berma) Recent Development
Table 142. BlakSheep Creative Company Details
Table 143. BlakSheep Creative Business Overview
Table 144. BlakSheep Creative Generative and Answer Engine Optimization Product
Table 145. BlakSheep Creative Revenue in Generative and Answer Engine Optimization Business (2020-2025) & (US$ Million)
Table 146. BlakSheep Creative Recent Development
Table 147. iPullRank Company Details
Table 148. iPullRank Business Overview
Table 149. iPullRank Generative and Answer Engine Optimization Product
Table 150. iPullRank Revenue in Generative and Answer Engine Optimization Business (2020-2025) & (US$ Million)
Table 151. iPullRank Recent Development
Table 152. Siege Media Company Details
Table 153. Siege Media Business Overview
Table 154. Siege Media Generative and Answer Engine Optimization Product
Table 155. Siege Media Revenue in Generative and Answer Engine Optimization Business (2020-2025) & (US$ Million)
Table 156. Siege Media Recent Development
Table 157. Algomindz Company Details
Table 158. Algomindz Business Overview
Table 159. Algomindz Generative and Answer Engine Optimization Product
Table 160. Algomindz Revenue in Generative and Answer Engine Optimization Business (2020-2025) & (US$ Million)
Table 161. Algomindz Recent Development
Table 162. 51Blocks Company Details
Table 163. 51Blocks Business Overview
Table 164. 51Blocks Generative and Answer Engine Optimization Product
Table 165. 51Blocks Revenue in Generative and Answer Engine Optimization Business (2020-2025) & (US$ Million)
Table 166. 51Blocks Recent Development
Table 167. Found Company Details
Table 168. Found Business Overview
Table 169. Found Generative and Answer Engine Optimization Product
Table 170. Found Revenue in Generative and Answer Engine Optimization Business (2020-2025) & (US$ Million)
Table 171. Found Recent Development
Table 172. Passion Digital Company Details
Table 173. Passion Digital Business Overview
Table 174. Passion Digital Generative and Answer Engine Optimization Product
Table 175. Passion Digital Revenue in Generative and Answer Engine Optimization Business (2020-2025) & (US$ Million)
Table 176. Passion Digital Recent Development
Table 177. Single Grain Company Details
Table 178. Single Grain Business Overview
Table 179. Single Grain Generative and Answer Engine Optimization Product
Table 180. Single Grain Revenue in Generative and Answer Engine Optimization Business (2020-2025) & (US$ Million)
Table 181. Single Grain Recent Development
Table 182. RevenueZen Company Details
Table 183. RevenueZen Business Overview
Table 184. RevenueZen Generative and Answer Engine Optimization Product
Table 185. RevenueZen Revenue in Generative and Answer Engine Optimization Business (2020-2025) & (US$ Million)
Table 186. RevenueZen Recent Development
Table 187. Omniscient Digital Company Details
Table 188. Omniscient Digital Business Overview
Table 189. Omniscient Digital Generative and Answer Engine Optimization Product
Table 190. Omniscient Digital Revenue in Generative and Answer Engine Optimization Business (2020-2025) & (US$ Million)
Table 191. Omniscient Digital Recent Development
Table 192. Grow and Convert Company Details
Table 193. Grow and Convert Business Overview
Table 194. Grow and Convert Generative and Answer Engine Optimization Product
Table 195. Grow and Convert Revenue in Generative and Answer Engine Optimization Business (2020-2025) & (US$ Million)
Table 196. Grow and Convert Recent Development
Table 197. Focus Digital Company Details
Table 198. Focus Digital Business Overview
Table 199. Focus Digital Generative and Answer Engine Optimization Product
Table 200. Focus Digital Revenue in Generative and Answer Engine Optimization Business (2020-2025) & (US$ Million)
Table 201. Focus Digital Recent Development
Table 202. AI Hack Company Details
Table 203. AI Hack Business Overview
Table 204. AI Hack Generative and Answer Engine Optimization Product
Table 205. AI Hack Revenue in Generative and Answer Engine Optimization Business (2020-2025) & (US$ Million)
Table 206. AI Hack Recent Development
Table 207. Avenue Z Company Details
Table 208. Avenue Z Business Overview
Table 209. Avenue Z Generative and Answer Engine Optimization Product
Table 210. Avenue Z Revenue in Generative and Answer Engine Optimization Business (2020-2025) & (US$ Million)
Table 211. Avenue Z Recent Development
Table 212. AthenaHQ Company Details
Table 213. AthenaHQ Business Overview
Table 214. AthenaHQ Generative and Answer Engine Optimization Product
Table 215. AthenaHQ Revenue in Generative and Answer Engine Optimization Business (2020-2025) & (US$ Million)
Table 216. AthenaHQ Recent Development
Table 217. Web of Picasso Company Details
Table 218. Web of Picasso Business Overview
Table 219. Web of Picasso Generative and Answer Engine Optimization Product
Table 220. Web of Picasso Revenue in Generative and Answer Engine Optimization Business (2020-2025) & (US$ Million)
Table 221. Web of Picasso Recent Development
Table 222. LenGreo Company Details
Table 223. LenGreo Business Overview
Table 224. LenGreo Generative and Answer Engine Optimization Product
Table 225. LenGreo Revenue in Generative and Answer Engine Optimization Business (2020-2025) & (US$ Million)
Table 226. LenGreo Recent Development
Table 227. Yeehai Global Company Details
Table 228. Yeehai Global Business Overview
Table 229. Yeehai Global Generative and Answer Engine Optimization Product
Table 230. Yeehai Global Revenue in Generative and Answer Engine Optimization Business (2020-2025) & (US$ Million)
Table 231. Yeehai Global Recent Development
Table 232. Hangzhou Guokezhijian Company Details
Table 233. Hangzhou Guokezhijian Business Overview
Table 234. Hangzhou Guokezhijian Generative and Answer Engine Optimization Product
Table 235. Hangzhou Guokezhijian Revenue in Generative and Answer Engine Optimization Business (2020-2025) & (US$ Million)
Table 236. Hangzhou Guokezhijian Recent Development
Table 237. Research Programs/Design for This Report
Table 238. Key Data Information from Secondary Sources
Table 239. Key Data Information from Primary Sources
Table 240. Authors List of This Report
List of Figures
Figure 1. Generative and Answer Engine Optimization Picture
Figure 2. Global Generative and Answer Engine Optimization Market Size Comparison by Type (2020-2031) & (US$ Million)
Figure 3. Global Generative and Answer Engine Optimization Market Share by Type: 2024 VS 2031
Figure 4. Generative-AI AEO Features
Figure 5. AI-powered Voice AEO Features
Figure 6. Global Generative and Answer Engine Optimization Market Size Comparison by Customer (2020-2031) & (US$ Million)
Figure 7. B2B Features
Figure 8. B2C Features
Figure 9. Global Generative and Answer Engine Optimization Market Size Comparison by Industry (2020-2031) & (US$ Million)
Figure 10. E-commerce Features
Figure 11. Manufacturing Features
Figure 12. Media Features
Figure 13. Consulting Features
Figure 14. Travel Features
Figure 15. Financial Service Features
Figure 16. Others Features
Figure 17. Global Generative and Answer Engine Optimization Market Size by Application (2020-2031) & (US$ Million)
Figure 18. Global Generative and Answer Engine Optimization Market Share by Application: 2024 VS 2031
Figure 19. Large Enterprise Case Studies
Figure 20. SME Case Studies
Figure 21. Startups Case Studies
Figure 22. Generative and Answer Engine Optimization Report Years Considered
Figure 23. Global Generative and Answer Engine Optimization Market Size (US$ Million), Year-over-Year: 2020-2031
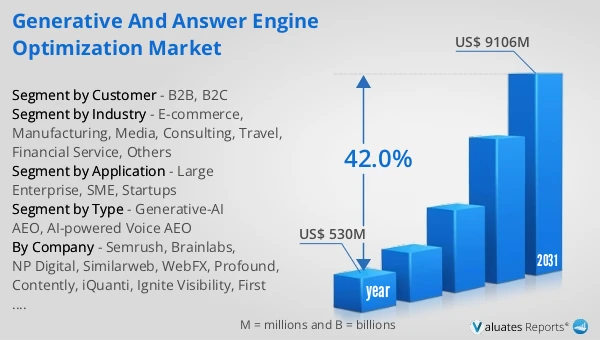
Figure 24. Global Generative and Answer Engine Optimization Market Size, (US$ Million), 2020 VS 2024 VS 2031
Figure 25. Global Generative and Answer Engine Optimization Market Share by Region: 2024 VS 2031
Figure 26. Global Generative and Answer Engine Optimization Market Share by Players in 2024
Figure 27. Global Generative and Answer Engine Optimization Market Share by Company Type (Tier 1, Tier 2, and Tier 3)
Figure 28. The Top 10 and 5 Players Market Share by Generative and Answer Engine Optimization Revenue in 2024
Figure 29. North America Generative and Answer Engine Optimization Market Size YoY Growth (2020-2031) & (US$ Million)
Figure 30. North America Generative and Answer Engine Optimization Market Share by Country (2020-2031)
Figure 31. United States Generative and Answer Engine Optimization Market Size YoY Growth (2020-2031) & (US$ Million)
Figure 32. Canada Generative and Answer Engine Optimization Market Size YoY Growth (2020-2031) & (US$ Million)
Figure 33. Europe Generative and Answer Engine Optimization Market Size YoY Growth (2020-2031) & (US$ Million)
Figure 34. Europe Generative and Answer Engine Optimization Market Share by Country (2020-2031)
Figure 35. Germany Generative and Answer Engine Optimization Market Size YoY Growth (2020-2031) & (US$ Million)
Figure 36. France Generative and Answer Engine Optimization Market Size YoY Growth (2020-2031) & (US$ Million)
Figure 37. U.K. Generative and Answer Engine Optimization Market Size YoY Growth (2020-2031) & (US$ Million)
Figure 38. Italy Generative and Answer Engine Optimization Market Size YoY Growth (2020-2031) & (US$ Million)
Figure 39. Russia Generative and Answer Engine Optimization Market Size YoY Growth (2020-2031) & (US$ Million)
Figure 40. Ireland Generative and Answer Engine Optimization Market Size YoY Growth (2020-2031) & (US$ Million)
Figure 41. Asia-Pacific Generative and Answer Engine Optimization Market Size YoY Growth (2020-2031) & (US$ Million)
Figure 42. Asia-Pacific Generative and Answer Engine Optimization Market Share by Region (2020-2031)
Figure 43. China Generative and Answer Engine Optimization Market Size YoY Growth (2020-2031) & (US$ Million)
Figure 44. Japan Generative and Answer Engine Optimization Market Size YoY Growth (2020-2031) & (US$ Million)
Figure 45. South Korea Generative and Answer Engine Optimization Market Size YoY Growth (2020-2031) & (US$ Million)
Figure 46. Southeast Asia Generative and Answer Engine Optimization Market Size YoY Growth (2020-2031) & (US$ Million)
Figure 47. India Generative and Answer Engine Optimization Market Size YoY Growth (2020-2031) & (US$ Million)
Figure 48. Australia & New Zealand Generative and Answer Engine Optimization Market Size YoY Growth (2020-2031) & (US$ Million)
Figure 49. Latin America Generative and Answer Engine Optimization Market Size YoY Growth (2020-2031) & (US$ Million)
Figure 50. Latin America Generative and Answer Engine Optimization Market Share by Country (2020-2031)
Figure 51. Mexico Generative and Answer Engine Optimization Market Size YoY Growth (2020-2031) & (US$ Million)
Figure 52. Brazil Generative and Answer Engine Optimization Market Size YoY Growth (2020-2031) & (US$ Million)
Figure 53. Middle East & Africa Generative and Answer Engine Optimization Market Size YoY Growth (2020-2031) & (US$ Million)
Figure 54. Middle East & Africa Generative and Answer Engine Optimization Market Share by Country (2020-2031)
Figure 55. Israel Generative and Answer Engine Optimization Market Size YoY Growth (2020-2031) & (US$ Million)
Figure 56. Saudi Arabia Generative and Answer Engine Optimization Market Size YoY Growth (2020-2031) & (US$ Million)
Figure 57. UAE Generative and Answer Engine Optimization Market Size YoY Growth (2020-2031) & (US$ Million)
Figure 58. Semrush Revenue Growth Rate in Generative and Answer Engine Optimization Business (2020-2025)
Figure 59. Brainlabs Revenue Growth Rate in Generative and Answer Engine Optimization Business (2020-2025)
Figure 60. NP Digital Revenue Growth Rate in Generative and Answer Engine Optimization Business (2020-2025)
Figure 61. Similarweb Revenue Growth Rate in Generative and Answer Engine Optimization Business (2020-2025)
Figure 62. WebFX Revenue Growth Rate in Generative and Answer Engine Optimization Business (2020-2025)
Figure 63. Profound Revenue Growth Rate in Generative and Answer Engine Optimization Business (2020-2025)
Figure 64. Contently Revenue Growth Rate in Generative and Answer Engine Optimization Business (2020-2025)
Figure 65. iQuanti Revenue Growth Rate in Generative and Answer Engine Optimization Business (2020-2025)
Figure 66. Ignite Visibility Revenue Growth Rate in Generative and Answer Engine Optimization Business (2020-2025)
Figure 67. First Page Sage Revenue Growth Rate in Generative and Answer Engine Optimization Business (2020-2025)
Figure 68. Marcel Digital Revenue Growth Rate in Generative and Answer Engine Optimization Business (2020-2025)
Figure 69. Thrive Internet Marketing Agency Revenue Growth Rate in Generative and Answer Engine Optimization Business (2020-2025)
Figure 70. Zen Media Revenue Growth Rate in Generative and Answer Engine Optimization Business (2020-2025)
Figure 71. Rise at Seven Revenue Growth Rate in Generative and Answer Engine Optimization Business (2020-2025)
Figure 72. Growth Plays Revenue Growth Rate in Generative and Answer Engine Optimization Business (2020-2025)
Figure 73. The Ad Firm Revenue Growth Rate in Generative and Answer Engine Optimization Business (2020-2025)
Figure 74. NoGood (Berma) Revenue Growth Rate in Generative and Answer Engine Optimization Business (2020-2025)
Figure 75. BlakSheep Creative Revenue Growth Rate in Generative and Answer Engine Optimization Business (2020-2025)
Figure 76. iPullRank Revenue Growth Rate in Generative and Answer Engine Optimization Business (2020-2025)
Figure 77. Siege Media Revenue Growth Rate in Generative and Answer Engine Optimization Business (2020-2025)
Figure 78. Algomindz Revenue Growth Rate in Generative and Answer Engine Optimization Business (2020-2025)
Figure 79. 51Blocks Revenue Growth Rate in Generative and Answer Engine Optimization Business (2020-2025)
Figure 80. Found Revenue Growth Rate in Generative and Answer Engine Optimization Business (2020-2025)
Figure 81. Passion Digital Revenue Growth Rate in Generative and Answer Engine Optimization Business (2020-2025)
Figure 82. Single Grain Revenue Growth Rate in Generative and Answer Engine Optimization Business (2020-2025)
Figure 83. RevenueZen Revenue Growth Rate in Generative and Answer Engine Optimization Business (2020-2025)
Figure 84. Omniscient Digital Revenue Growth Rate in Generative and Answer Engine Optimization Business (2020-2025)
Figure 85. Grow and Convert Revenue Growth Rate in Generative and Answer Engine Optimization Business (2020-2025)
Figure 86. Focus Digital Revenue Growth Rate in Generative and Answer Engine Optimization Business (2020-2025)
Figure 87. AI Hack Revenue Growth Rate in Generative and Answer Engine Optimization Business (2020-2025)
Figure 88. Avenue Z Revenue Growth Rate in Generative and Answer Engine Optimization Business (2020-2025)
Figure 89. AthenaHQ Revenue Growth Rate in Generative and Answer Engine Optimization Business (2020-2025)
Figure 90. Web of Picasso Revenue Growth Rate in Generative and Answer Engine Optimization Business (2020-2025)
Figure 91. LenGreo Revenue Growth Rate in Generative and Answer Engine Optimization Business (2020-2025)
Figure 92. Yeehai Global Revenue Growth Rate in Generative and Answer Engine Optimization Business (2020-2025)
Figure 93. Hangzhou Guokezhijian Revenue Growth Rate in Generative and Answer Engine Optimization Business (2020-2025)
Figure 94. Bottom-up and Top-down Approaches for This Report
Figure 95. Data Triangulation
Figure 96. Key Executives Interviewed