0
U.S. (TOLL FREE)
+1 (315) 215-3225
Automative

0
U.S. (TOLL FREE)
+1 (315) 215-3225
Vehicle Chassis Dynamometer System - Global Market Share and Ranking, Overall Sales and Demand Forecast 2026-2032
Published Date: 2026-01-13
|
Report Code: QYRE-Auto-35X4843
Home | Market Reports
Global Vehicle Chassis Dynamometer System Market Insights Forecast to 2028
BUY CHAPTERS

Vehicle Chassis Dynamometer System - Global Market Share and Ranking, Overall Sales and Demand Forecast 2026-2032

Code: QYRE-Auto-35X4843
Report
2026-01-13
Pages:118
QYResearch
Buy Now with 15% Discount
DESCRIPTION
TABLE OF CONTENT
TABLES & FIGURES

Vehicle Chassis Dynamometer System - Market Size

The global market for Vehicle Chassis Dynamometer System was estimated to be worth US$ 181 million in 2025 and is projected to reach US$ 226 million, growing at a CAGR of 3.5% from 2026 to 2032.

Vehicle Chassis Dynamometer System - Market

Vehicle Chassis Dynamometer System - Market

In 2025, global Vehicle Chassis Dynamometer System production reached approximately 192 units, with an average price of 943 K USD per unit.
Vehicle Chassis Dynamometer System is a specialized testing system used to measure the power output, torque, emissions, fuel efficiency, and overall performance of a vehicle’s powertrain by simulating road conditions. This system is used extensively by automotive manufacturers, research and development labs, and regulatory agencies to test vehicles under controlled conditions. The system typically consists of rollers that the vehicle’s wheels rest upon while being driven, and sensors that record performance metrics.
The raw materials used in the manufacturing of chassis dynamometer systems include high-strength steel for the frame, rollers, and structural components, precision electronic sensors for measuring power and torque, and advanced control systems for data acquisition and analysis. The production process involves several stages including raw material procurement, machining of rollers and components, integration of sensors and control systems, assembly of the dynamometer system, and final testing and calibration to ensure accurate results. The downstream applications include automotive manufacturers, research organizations, third-party testing labs, and government regulators. Industry gross margins for chassis dynamometer systems typically range from 20% to 40%, influenced by system complexity, precision requirements, and market demand.
The Vehicle Chassis Dynamometer System market is driven by the increasing demand for vehicle testing across various industries, especially with the growing emphasis on regulatory compliance, vehicle performance testing, and environmental standards. The automotive industry, which includes manufacturers of passenger cars, commercial vehicles, and electric vehicles, remains the largest consumer of chassis dynamometer systems. With stricter fuel efficiency and emissions regulations globally, the demand for these systems has expanded to ensure vehicles meet performance and regulatory benchmarks.
The Asia-Pacific region, particularly China and India, is witnessing rapid growth in the chassis dynamometer market due to the burgeoning automotive manufacturing industry and increasing vehicle production volumes. North America and Europe remain strong markets, driven by stringent emission testing regulations and the presence of major automotive manufacturers. The growth of electric vehicles (EVs) has also spurred demand for new dynamometer systems capable of testing alternative powertrains. Over the next few years, the market is expected to grow steadily as governments continue to tighten regulations on fuel efficiency and emissions, while automotive manufacturers push for more advanced and precise testing systems to support the development of new technologies.
This report provides a comprehensive view of the global market for Vehicle Chassis Dynamometer System, covering total sales revenue, the market share and ranking of key companies, along with analyses by region & country, by Type, and by Application.
The Vehicle Chassis Dynamometer System market size, estimations, and forecasts are presented in terms of sales revenue ($ millions), with 2025 as the base year and historical and forecast data from 2021 to 2032. The report combines quantitative and qualitative analysis to help readers develop growth strategies, assess the competitive landscape, evaluate their position in the current marketplace, and make informed business decisions regarding Vehicle Chassis Dynamometer System.
Market Segmentation

Scope of Vehicle Chassis Dynamometer System - Market Report

Report Metric Details
Report Name Vehicle Chassis Dynamometer System - Market
CAGR 3.5%
Segment by Type
  • Two-axis Four-roller
  • Three-axis Six-roller
  • Others
Segment by Drive
  • Two-Wheel Drive
  • All-Wheel Drive (AWD)
  • Four-Wheel Drive (4WD)
Segment by Vehicle
  • Passenger Cars
  • Commercial Vehicles
Segment by Application
  • Automotive Original Equipment Manufacturers
  • Third-Party Service Providers
By Region
  • North America (United States, Canada)
  • Europe (Germany, France, UK, Italy, Russia) Rest of Europe
  • Nordic Countries
  • Asia-Pacific (China, Japan, South Korea)
  • Southeast Asia (India, Australia)
  • Rest of Asia
  • Latin America (Mexico, Brazil)
  • Rest of Latin America
  • Middle East & Africa (Turkey, Saudi Arabia, UAE, Rest of MEA)
Consumption by Region
  • North America (United States, Canada)
  • Europe (Germany, France, UK, Italy, Russia)
  • Asia-Pacific (China, Japan, South Korea, Taiwan)
  • Southeast Asia (India)
  • Latin America (Mexico, Brazil)
By Company AIP, AVL List GmbH, Ascential Technologies, HORIBA Group, MEIDENSHA, Power Test, Ono Sokki, Chongqing CAERI Test Equipment Co., Ltd, Rototest International AB, Sierra CP Engineering, Shanghai AngQin Control System Co., Ltd.
Forecast units USD million in value
Report coverage Revenue and volume forecast, company share, competitive landscape, growth factors and trends

Chapter Outline

  • Chapter 1: Introduces the scope of the report and the global market size (value). It also summarizes market dynamics and recent developments; identifies key drivers and restraints; outlines challenges and risks for players; reviews relevant industry policies.
  • Chapter 2: Provides a detailed analysis of the Vehicle Chassis Dynamometer System companies' competitive landscape—including revenue shares, recent development plans, and mergers and acquisitions (M&A).
  • Chapter 3: Analyzes market segmentation by Type, presenting the size and growth potential of each segment to help readers identify blue-ocean opportunities.
  • Chapter 4: Analyzes market segmentation by Application, presenting the size and growth potential of each downstream segment to help readers identify blue-ocean opportunities.
  • Chapter 5: Presents Vehicle Chassis Dynamometer System revenue at the regional level. It offers a quantitative assessment of market size and growth potential by region and summarizes market development, future prospects, addressable space, and country-level market size worldwide.
  • Chapter 6: Presents Vehicle Chassis Dynamometer System revenue at the country level. It provides segmented data by Type and by Application for each country/region.
  • Chapter 7: Profiles key players, detailing the main companies' product revenue, gross margin, product portfolios, recent developments, etc.
  • Chapter 8: Analysis of Value Chain, including the upstream and downstream of the industry.
  • Chapter 9: Conclusion.

FAQ for this report

Who are the main players in the Vehicle Chassis Dynamometer System - Market report?

Ans: The main players in the Vehicle Chassis Dynamometer System - Market are AIP, AVL List GmbH, Ascential Technologies, HORIBA Group, MEIDENSHA, Power Test, Ono Sokki, Chongqing CAERI Test Equipment Co., Ltd, Rototest International AB, Sierra CP Engineering, Shanghai AngQin Control System Co., Ltd.

What are the Application segmentation covered in the Vehicle Chassis Dynamometer System - Market report?

Ans: The Applications covered in the Vehicle Chassis Dynamometer System - Market report are Automotive Original Equipment Manufacturers, Third-Party Service Providers

What are the Type segmentation covered in the Vehicle Chassis Dynamometer System - Market report?

Ans: The Types covered in the Vehicle Chassis Dynamometer System - Market report are Two-axis Four-roller, Three-axis Six-roller, Others

1 Market Overview
1.1 Vehicle Chassis Dynamometer System Product Introduction
1.2 Global Vehicle Chassis Dynamometer System Market Size Forecast (2021–2032)
1.3 Vehicle Chassis Dynamometer System Market Trends & Drivers
1.3.1 Vehicle Chassis Dynamometer System Industry Trends
1.3.2 Vehicle Chassis Dynamometer System Market Drivers & Opportunities
1.3.3 Vehicle Chassis Dynamometer System Market Challenges
1.3.4 Vehicle Chassis Dynamometer System Market Restraints
1.4 Assumptions and Limitations
1.5 Study Objectives
1.6 Years Considered
2 Competitive Analysis by Company
2.1 Global Vehicle Chassis Dynamometer System Players Revenue Ranking (2025)
2.2 Global Vehicle Chassis Dynamometer System Revenue by Company (2021–2026)
2.3 Key Companies’ R&D and Operations Footprint and Headquarters
2.4 Key Companies Vehicle Chassis Dynamometer System Product Offerings
2.5 Key Companies General Availability (GA) Timeline for Vehicle Chassis Dynamometer System
2.6 Vehicle Chassis Dynamometer System Market Competitive Analysis
2.6.1 Vehicle Chassis Dynamometer System Market Concentration Rate (2021–2026)
2.6.2 Top 5 and Top 10 Global Companies by Vehicle Chassis Dynamometer System Revenue in 2025
2.6.3 Global Companies by Tier (Tier 1, Tier 2, Tier 3), based on Vehicle Chassis Dynamometer System revenue, 2025
2.7 Mergers & Acquisitions and Expansion
3 Segmentation Vehicle Chassis Dynamometer System Market Classification
3.1 Introduction by Type
3.1.1 Two-axis Four-roller
3.1.2 Three-axis Six-roller
3.1.3 Others
3.1.4 Global Vehicle Chassis Dynamometer System Sales Value by Type
3.1.4.1 Global Vehicle Chassis Dynamometer System Sales Value by Type (2021 vs 2025 vs 2032)
3.1.4.2 Global Vehicle Chassis Dynamometer System Sales Value, by Type (2021–2032)
3.1.4.3 Global Vehicle Chassis Dynamometer System Sales Value, by Type (%), 2021–2032
3.2 Introduction by Drive
3.2.1 Two-Wheel Drive
3.2.2 All-Wheel Drive (AWD)
3.2.3 Four-Wheel Drive (4WD)
3.2.4 Global Vehicle Chassis Dynamometer System Sales Value by Drive
3.2.4.1 Global Vehicle Chassis Dynamometer System Sales Value by Drive (2021 vs 2025 vs 2032)
3.2.4.2 Global Vehicle Chassis Dynamometer System Sales Value, by Drive (2021–2032)
3.2.4.3 Global Vehicle Chassis Dynamometer System Sales Value, by Drive (%), 2021–2032
3.3 Introduction by Vehicle
3.3.1 Passenger Cars
3.3.2 Commercial Vehicles
3.3.3 Global Vehicle Chassis Dynamometer System Sales Value by Vehicle
3.3.3.1 Global Vehicle Chassis Dynamometer System Sales Value by Vehicle (2021 vs 2025 vs 2032)
3.3.3.2 Global Vehicle Chassis Dynamometer System Sales Value, by Vehicle (2021–2032)
3.3.3.3 Global Vehicle Chassis Dynamometer System Sales Value, by Vehicle (%), 2021–2032
4 Segmentation by Application
4.1 Introduction by Application
4.1.1 Automotive Original Equipment Manufacturers
4.1.2 Third-Party Service Providers
4.2 Global Vehicle Chassis Dynamometer System Sales Value by Application
4.2.1 Global Vehicle Chassis Dynamometer System Sales Value by Application (2021 vs 2025 vs 2032)
4.2.2 Global Vehicle Chassis Dynamometer System Sales Value by Application (2021–2032)
4.2.3 Global Vehicle Chassis Dynamometer System Sales Value by Application (%), 2021–2032
5 Segmentation by Region
5.1 Global Vehicle Chassis Dynamometer System Sales Value by Region
5.1.1 Global Vehicle Chassis Dynamometer System Sales Value by Region: 2021 vs 2025 vs 2032
5.1.2 Global Vehicle Chassis Dynamometer System Sales Value by Region (2021–2026)
5.1.3 Global Vehicle Chassis Dynamometer System Sales Value by Region (2027–2032)
5.1.4 Global Vehicle Chassis Dynamometer System Sales Value by Region (%), 2021–2032
5.2 North America
5.2.1 North America Vehicle Chassis Dynamometer System Sales Value, 2021–2032
5.2.2 North America Vehicle Chassis Dynamometer System Sales Value by Country (%), 2025 vs 2032
5.3 Europe
5.3.1 Europe Vehicle Chassis Dynamometer System Sales Value, 2021–2032
5.3.2 Europe Vehicle Chassis Dynamometer System Sales Value by Country (%), 2025 vs 2032
5.4 Asia Pacific
5.4.1 Asia Pacific Vehicle Chassis Dynamometer System Sales Value, 2021–2032
5.4.2 Asia Pacific Vehicle Chassis Dynamometer System Sales Value by Subregion (%), 2025 vs 2032
5.5 South America
5.5.1 South America Vehicle Chassis Dynamometer System Sales Value, 2021–2032
5.5.2 South America Vehicle Chassis Dynamometer System Sales Value by Country (%), 2025 vs 2032
5.6 Middle East & Africa
5.6.1 Middle East & Africa Vehicle Chassis Dynamometer System Sales Value, 2021–2032
5.6.2 Middle East & Africa Vehicle Chassis Dynamometer System Sales Value by Country (%), 2025 vs 2032
6 Segmentation by Key Countries/Regions
6.1 Key Countries/Regions Vehicle Chassis Dynamometer System Sales Value Growth Trends, 2021 vs 2025 vs 2032
6.2 Key Countries/Regions Vehicle Chassis Dynamometer System Sales Value, 2021–2032
6.3 United States
6.3.1 United States Vehicle Chassis Dynamometer System Sales Value, 2021–2032
6.3.2 United States Vehicle Chassis Dynamometer System Sales Value by Type (%), 2025 vs 2032
6.3.3 United States Vehicle Chassis Dynamometer System Sales Value by Application, 2025 vs 2032
6.4 Europe
6.4.1 Europe Vehicle Chassis Dynamometer System Sales Value, 2021–2032
6.4.2 Europe Vehicle Chassis Dynamometer System Sales Value by Type (%), 2025 vs 2032
6.4.3 Europe Vehicle Chassis Dynamometer System Sales Value by Application, 2025 vs 2032
6.5 China
6.5.1 China Vehicle Chassis Dynamometer System Sales Value, 2021–2032
6.5.2 China Vehicle Chassis Dynamometer System Sales Value by Type (%), 2025 vs 2032
6.5.3 China Vehicle Chassis Dynamometer System Sales Value by Application, 2025 vs 2032
6.6 Japan
6.6.1 Japan Vehicle Chassis Dynamometer System Sales Value, 2021–2032
6.6.2 Japan Vehicle Chassis Dynamometer System Sales Value by Type (%), 2025 vs 2032
6.6.3 Japan Vehicle Chassis Dynamometer System Sales Value by Application, 2025 vs 2032
6.7 South Korea
6.7.1 South Korea Vehicle Chassis Dynamometer System Sales Value, 2021–2032
6.7.2 South Korea Vehicle Chassis Dynamometer System Sales Value by Type (%), 2025 vs 2032
6.7.3 South Korea Vehicle Chassis Dynamometer System Sales Value by Application, 2025 vs 2032
6.8 Southeast Asia
6.8.1 Southeast Asia Vehicle Chassis Dynamometer System Sales Value, 2021–2032
6.8.2 Southeast Asia Vehicle Chassis Dynamometer System Sales Value by Type (%), 2025 vs 2032
6.8.3 Southeast Asia Vehicle Chassis Dynamometer System Sales Value by Application, 2025 vs 2032
6.9 India
6.9.1 India Vehicle Chassis Dynamometer System Sales Value, 2021–2032
6.9.2 India Vehicle Chassis Dynamometer System Sales Value by Type (%), 2025 vs 2032
6.9.3 India Vehicle Chassis Dynamometer System Sales Value by Application, 2025 vs 2032
7 Company Profiles
7.1 AIP
7.1.1 AIP Profile
7.1.2 AIP Main Business
7.1.3 AIP Vehicle Chassis Dynamometer System Products, Services, and Solutions
7.1.4 AIP Vehicle Chassis Dynamometer System Revenue (US$ Million), 2021–2026
7.1.5 AIP Recent Developments
7.2 AVL List GmbH
7.2.1 AVL List GmbH Profile
7.2.2 AVL List GmbH Main Business
7.2.3 AVL List GmbH Vehicle Chassis Dynamometer System Products, Services, and Solutions
7.2.4 AVL List GmbH Vehicle Chassis Dynamometer System Revenue (US$ Million), 2021–2026
7.2.5 AVL List GmbH Recent Developments
7.3 Ascential Technologies
7.3.1 Ascential Technologies Profile
7.3.2 Ascential Technologies Main Business
7.3.3 Ascential Technologies Vehicle Chassis Dynamometer System Products, Services, and Solutions
7.3.4 Ascential Technologies Vehicle Chassis Dynamometer System Revenue (US$ Million), 2021–2026
7.3.5 Ascential Technologies Recent Developments
7.4 HORIBA Group
7.4.1 HORIBA Group Profile
7.4.2 HORIBA Group Main Business
7.4.3 HORIBA Group Vehicle Chassis Dynamometer System Products, Services, and Solutions
7.4.4 HORIBA Group Vehicle Chassis Dynamometer System Revenue (US$ Million), 2021–2026
7.4.5 HORIBA Group Recent Developments
7.5 MEIDENSHA
7.5.1 MEIDENSHA Profile
7.5.2 MEIDENSHA Main Business
7.5.3 MEIDENSHA Vehicle Chassis Dynamometer System Products, Services, and Solutions
7.5.4 MEIDENSHA Vehicle Chassis Dynamometer System Revenue (US$ Million), 2021–2026
7.5.5 MEIDENSHA Recent Developments
7.6 Power Test
7.6.1 Power Test Profile
7.6.2 Power Test Main Business
7.6.3 Power Test Vehicle Chassis Dynamometer System Products, Services, and Solutions
7.6.4 Power Test Vehicle Chassis Dynamometer System Revenue (US$ Million), 2021–2026
7.6.5 Power Test Recent Developments
7.7 Ono Sokki
7.7.1 Ono Sokki Profile
7.7.2 Ono Sokki Main Business
7.7.3 Ono Sokki Vehicle Chassis Dynamometer System Products, Services, and Solutions
7.7.4 Ono Sokki Vehicle Chassis Dynamometer System Revenue (US$ Million), 2021–2026
7.7.5 Ono Sokki Recent Developments
7.8 Chongqing CAERI Test Equipment Co., Ltd
7.8.1 Chongqing CAERI Test Equipment Co., Ltd Profile
7.8.2 Chongqing CAERI Test Equipment Co., Ltd Main Business
7.8.3 Chongqing CAERI Test Equipment Co., Ltd Vehicle Chassis Dynamometer System Products, Services, and Solutions
7.8.4 Chongqing CAERI Test Equipment Co., Ltd Vehicle Chassis Dynamometer System Revenue (US$ Million), 2021–2026
7.8.5 Chongqing CAERI Test Equipment Co., Ltd Recent Developments
7.9 Rototest International AB
7.9.1 Rototest International AB Profile
7.9.2 Rototest International AB Main Business
7.9.3 Rototest International AB Vehicle Chassis Dynamometer System Products, Services, and Solutions
7.9.4 Rototest International AB Vehicle Chassis Dynamometer System Revenue (US$ Million), 2021–2026
7.9.5 Rototest International AB Recent Developments
7.10 Sierra CP Engineering
7.10.1 Sierra CP Engineering Profile
7.10.2 Sierra CP Engineering Main Business
7.10.3 Sierra CP Engineering Vehicle Chassis Dynamometer System Products, Services, and Solutions
7.10.4 Sierra CP Engineering Vehicle Chassis Dynamometer System Revenue (US$ Million), 2021–2026
7.10.5 Sierra CP Engineering Recent Developments
7.11 Shanghai AngQin Control System Co., Ltd.
7.11.1 Shanghai AngQin Control System Co., Ltd. Profile
7.11.2 Shanghai AngQin Control System Co., Ltd. Main Business
7.11.3 Shanghai AngQin Control System Co., Ltd. Vehicle Chassis Dynamometer System Products, Services, and Solutions
7.11.4 Shanghai AngQin Control System Co., Ltd. Vehicle Chassis Dynamometer System Revenue (US$ Million), 2021–2026
7.11.5 Shanghai AngQin Control System Co., Ltd. Recent Developments
8 Industry Chain Analysis
8.1 Vehicle Chassis Dynamometer System Value Chain
8.2 Vehicle Chassis Dynamometer System Upstream Analysis
8.2.1 Key Raw Materials
8.2.2 Key Suppliers of Raw Materials
8.2.3 Cost Structure
8.3 Midstream Analysis
8.4 Downstream (Customer) Analysis
8.5 Sales Model and Sales Channelss
8.5.1 Vehicle Chassis Dynamometer System Sales Model
8.5.2 Sales Channels
8.5.3 Vehicle Chassis Dynamometer System Distributors
9 Research Findings and Conclusion
10 Appendix
10.1 Research Methodology
10.1.1 Methodology/Research Approach
10.1.1.1 Research Programs/Design
10.1.1.2 Market Size Estimation
10.1.1.3 Market Breakdown and Data Triangulation
10.1.2 Data Source
10.1.2.1 Secondary Sources
10.1.2.2 Primary Sources
10.2 Author Details
10.3 Disclaimer
List of Tables
 Table 1. Vehicle Chassis Dynamometer System Market Trends
 Table 2. Vehicle Chassis Dynamometer System Market Drivers & Opportunities
 Table 3. Vehicle Chassis Dynamometer System Market Challenges
 Table 4. Vehicle Chassis Dynamometer System Market Restraints
 Table 5. Global Vehicle Chassis Dynamometer System Revenue by Company (US$ Million), 2021–2026
 Table 6. Global Vehicle Chassis Dynamometer System Revenue Market Share by Company (2021–2026)
 Table 7. Key Companies’ R&D and Operations Footprint and Headquarters
 Table 8. Key Companies Vehicle Chassis Dynamometer System Product Type
 Table 9. Key Companies General Availability (GA) Timeline for Vehicle Chassis Dynamometer System
 Table 10. Global Vehicle Chassis Dynamometer System Companies Market Concentration Ratio (CR5 and HHI)
 Table 11. Global Companies by Tier (Tier 1, Tier 2, Tier 3), based on Vehicle Chassis Dynamometer System revenue, 2025
 Table 12. Mergers & Acquisitions and Expansion Plans
 Table 13. Global Vehicle Chassis Dynamometer System Sales Value by Type: 2021 vs 2025 vs 2032 (US$ Million)
 Table 14. Global Vehicle Chassis Dynamometer System Sales Value by Type (US$ Million), 2021–2026
 Table 15. Global Vehicle Chassis Dynamometer System Sales Value by Type (US$ Million), 2027–2032
 Table 16. Global Vehicle Chassis Dynamometer System Sales Market Share in Value by Type (2021–2026)
 Table 17. Global Vehicle Chassis Dynamometer System Sales Market Share in Value by Type (2027–2032)
 Table 18. Global Vehicle Chassis Dynamometer System Sales Value by Drive: 2021 vs 2025 vs 2032 (US$ Million)
 Table 19. Global Vehicle Chassis Dynamometer System Sales Value by Drive (US$ Million), 2021–2026
 Table 20. Global Vehicle Chassis Dynamometer System Sales Value by Drive (US$ Million), 2027–2032
 Table 21. Global Vehicle Chassis Dynamometer System Sales Market Share in Value by Drive (2021–2026)
 Table 22. Global Vehicle Chassis Dynamometer System Sales Market Share in Value by Drive (2027–2032)
 Table 23. Global Vehicle Chassis Dynamometer System Sales Value by Vehicle: 2021 vs 2025 vs 2032 (US$ Million)
 Table 24. Global Vehicle Chassis Dynamometer System Sales Value by Vehicle (US$ Million), 2021–2026
 Table 25. Global Vehicle Chassis Dynamometer System Sales Value by Vehicle (US$ Million), 2027–2032
 Table 26. Global Vehicle Chassis Dynamometer System Sales Market Share in Value by Vehicle (2021–2026)
 Table 27. Global Vehicle Chassis Dynamometer System Sales Market Share in Value by Vehicle (2027–2032)
 Table 28. Global Vehicle Chassis Dynamometer System Sales Value by Application: 2021 vs 2025 vs 2032 (US$ Million)
 Table 29. Global Vehicle Chassis Dynamometer System Sales Value by Application (US$ Million), 2021–2026
 Table 30. Global Vehicle Chassis Dynamometer System Sales Value by Application (US$ Million), 2027–2032
 Table 31. Global Vehicle Chassis Dynamometer System Sales Market Share in Value by Application (2021–2026)
 Table 32. Global Vehicle Chassis Dynamometer System Sales Market Share in Value by Application (2027–2032)
 Table 33. Global Vehicle Chassis Dynamometer System Sales Value by Region, (US$ Million), 2021 vs 2025 vs 2032
 Table 34. Global Vehicle Chassis Dynamometer System Sales Value by Region (US$ Million), 2021–2026
 Table 35. Global Vehicle Chassis Dynamometer System Sales Value by Region (US$ Million), 2027–2032
 Table 36. Global Vehicle Chassis Dynamometer System Sales Value by Region (%), 2021–2026
 Table 37. Global Vehicle Chassis Dynamometer System Sales Value by Region (%), 2027–2032
 Table 38. Key Countries/Regions Vehicle Chassis Dynamometer System Sales Value Growth Trends, (US$ Million): 2021 vs 2025 vs 2032
 Table 39. Key Countries/Regions Vehicle Chassis Dynamometer System Sales Value, (US$ Million), 2021–2026
 Table 40. Key Countries/Regions Vehicle Chassis Dynamometer System Sales Value, (US$ Million), 2027–2032
 Table 41. AIP Basic Information List
 Table 42. AIP Description and Business Overview
 Table 43. AIP Vehicle Chassis Dynamometer System Products, Services, and Solutions
 Table 44. Revenue (US$ Million) in Vehicle Chassis Dynamometer System Business of AIP (2021–2026)
 Table 45. AIP Recent Developments
 Table 46. AVL List GmbH Basic Information List
 Table 47. AVL List GmbH Description and Business Overview
 Table 48. AVL List GmbH Vehicle Chassis Dynamometer System Products, Services, and Solutions
 Table 49. Revenue (US$ Million) in Vehicle Chassis Dynamometer System Business of AVL List GmbH (2021–2026)
 Table 50. AVL List GmbH Recent Developments
 Table 51. Ascential Technologies Basic Information List
 Table 52. Ascential Technologies Description and Business Overview
 Table 53. Ascential Technologies Vehicle Chassis Dynamometer System Products, Services, and Solutions
 Table 54. Revenue (US$ Million) in Vehicle Chassis Dynamometer System Business of Ascential Technologies (2021–2026)
 Table 55. Ascential Technologies Recent Developments
 Table 56. HORIBA Group Basic Information List
 Table 57. HORIBA Group Description and Business Overview
 Table 58. HORIBA Group Vehicle Chassis Dynamometer System Products, Services, and Solutions
 Table 59. Revenue (US$ Million) in Vehicle Chassis Dynamometer System Business of HORIBA Group (2021–2026)
 Table 60. HORIBA Group Recent Developments
 Table 61. MEIDENSHA Basic Information List
 Table 62. MEIDENSHA Description and Business Overview
 Table 63. MEIDENSHA Vehicle Chassis Dynamometer System Products, Services, and Solutions
 Table 64. Revenue (US$ Million) in Vehicle Chassis Dynamometer System Business of MEIDENSHA (2021–2026)
 Table 65. MEIDENSHA Recent Developments
 Table 66. Power Test Basic Information List
 Table 67. Power Test Description and Business Overview
 Table 68. Power Test Vehicle Chassis Dynamometer System Products, Services, and Solutions
 Table 69. Revenue (US$ Million) in Vehicle Chassis Dynamometer System Business of Power Test (2021–2026)
 Table 70. Power Test Recent Developments
 Table 71. Ono Sokki Basic Information List
 Table 72. Ono Sokki Description and Business Overview
 Table 73. Ono Sokki Vehicle Chassis Dynamometer System Products, Services, and Solutions
 Table 74. Revenue (US$ Million) in Vehicle Chassis Dynamometer System Business of Ono Sokki (2021–2026)
 Table 75. Ono Sokki Recent Developments
 Table 76. Chongqing CAERI Test Equipment Co., Ltd Basic Information List
 Table 77. Chongqing CAERI Test Equipment Co., Ltd Description and Business Overview
 Table 78. Chongqing CAERI Test Equipment Co., Ltd Vehicle Chassis Dynamometer System Products, Services, and Solutions
 Table 79. Revenue (US$ Million) in Vehicle Chassis Dynamometer System Business of Chongqing CAERI Test Equipment Co., Ltd (2021–2026)
 Table 80. Chongqing CAERI Test Equipment Co., Ltd Recent Developments
 Table 81. Rototest International AB Basic Information List
 Table 82. Rototest International AB Description and Business Overview
 Table 83. Rototest International AB Vehicle Chassis Dynamometer System Products, Services, and Solutions
 Table 84. Revenue (US$ Million) in Vehicle Chassis Dynamometer System Business of Rototest International AB (2021–2026)
 Table 85. Rototest International AB Recent Developments
 Table 86. Sierra CP Engineering Basic Information List
 Table 87. Sierra CP Engineering Description and Business Overview
 Table 88. Sierra CP Engineering Vehicle Chassis Dynamometer System Products, Services, and Solutions
 Table 89. Revenue (US$ Million) in Vehicle Chassis Dynamometer System Business of Sierra CP Engineering (2021–2026)
 Table 90. Sierra CP Engineering Recent Developments
 Table 91. Shanghai AngQin Control System Co., Ltd. Basic Information List
 Table 92. Shanghai AngQin Control System Co., Ltd. Description and Business Overview
 Table 93. Shanghai AngQin Control System Co., Ltd. Vehicle Chassis Dynamometer System Products, Services, and Solutions
 Table 94. Revenue (US$ Million) in Vehicle Chassis Dynamometer System Business of Shanghai AngQin Control System Co., Ltd. (2021–2026)
 Table 95. Shanghai AngQin Control System Co., Ltd. Recent Developments
 Table 96. Revenue (US$ Million) in Vehicle Chassis Dynamometer System Business of Company 40 (2021–2026)
 Table 97. Company 40 Recent Developments
 Table 98. Key Raw Materials Lists
 Table 99. Key Suppliers of Raw Materials Lists
 Table 100. Vehicle Chassis Dynamometer System Downstream Customers
 Table 101. Vehicle Chassis Dynamometer System Distributors List
 Table 102. Research Programs/Design for This Report
 Table 103. Key Data Information from Secondary Sources
 Table 104. Key Data Information from Primary Sources


List of Figures
 Figure 1. Vehicle Chassis Dynamometer System Product Picture
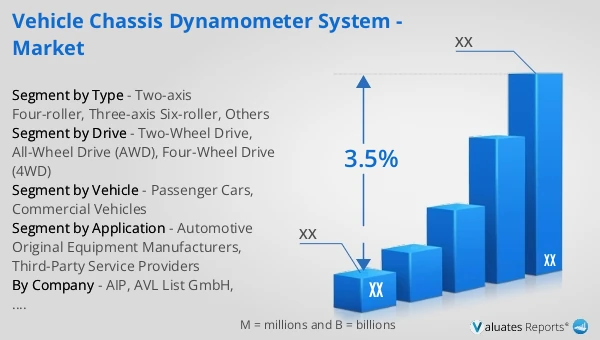
 Figure 2. Global Vehicle Chassis Dynamometer System Sales Value, 2021 vs 2025 vs 2032 (US$ Million)
 Figure 3. Global Vehicle Chassis Dynamometer System Sales Value (US$ Million), 2021–2032
 Figure 4. Vehicle Chassis Dynamometer System Report Years Considered
 Figure 5. Global Vehicle Chassis Dynamometer System Players Revenue Ranking (US$ Million), 2025
 Figure 6. The 5 and 10 Largest Companies in the World: Market Share by Vehicle Chassis Dynamometer System Revenue in 2025
 Figure 7. Vehicle Chassis Dynamometer System Market Share by Company Type (Tier 1, Tier 2, and Tier 3): 2021 vs 2025
 Figure 8. Two-axis Four-roller Picture
 Figure 9. Three-axis Six-roller Picture
 Figure 10. Others Picture
 Figure 11. Global Vehicle Chassis Dynamometer System Sales Value by Type (US$ Million), 2021 vs 2025 vs 2032
 Figure 12. Global Vehicle Chassis Dynamometer System Sales Value Market Share by Type, 2025 & 2032
 Figure 13. Two-Wheel Drive Picture
 Figure 14. All-Wheel Drive (AWD) Picture
 Figure 15. Four-Wheel Drive (4WD) Picture
 Figure 16. Global Vehicle Chassis Dynamometer System Sales Value by Drive (US$ Million), 2021 vs 2025 vs 2032
 Figure 17. Global Vehicle Chassis Dynamometer System Sales Value Market Share by Drive, 2025 & 2032
 Figure 18. Passenger Cars Picture
 Figure 19. Commercial Vehicles Picture
 Figure 20. Global Vehicle Chassis Dynamometer System Sales Value by Vehicle (US$ Million), 2021 vs 2025 vs 2032
 Figure 21. Global Vehicle Chassis Dynamometer System Sales Value Market Share by Vehicle, 2025 & 2032
 Figure 22. Product Picture of Automotive Original Equipment Manufacturers
 Figure 23. Product Picture of Third-Party Service Providers
 Figure 24. Global Vehicle Chassis Dynamometer System Sales Value by Application (US$ Million), 2021 vs 2025 vs 2032
 Figure 25. Global Vehicle Chassis Dynamometer System Sales Value Market Share by Application, 2025 & 2032
 Figure 26. North America Vehicle Chassis Dynamometer System Sales Value (US$ Million), 2021–2032
 Figure 27. North America Vehicle Chassis Dynamometer System Sales Value by Country (%), 2025 vs 2032
 Figure 28. Europe Vehicle Chassis Dynamometer System Sales Value (US$ Million), 2021–2032
 Figure 29. Europe Vehicle Chassis Dynamometer System Sales Value by Country (%), 2025 vs 2032
 Figure 30. Asia Pacific Vehicle Chassis Dynamometer System Sales Value (US$ Million), 2021–2032
 Figure 31. Asia Pacific Vehicle Chassis Dynamometer System Sales Value by Subregion (%), 2025 vs 2032
 Figure 32. South America Vehicle Chassis Dynamometer System Sales Value (US$ Million), 2021–2032
 Figure 33. South America Vehicle Chassis Dynamometer System Sales Value by Country (%), 2025 vs 2032
 Figure 34. Middle East & Africa Vehicle Chassis Dynamometer System Sales Value (US$ Million), 2021–2032
 Figure 35. Middle East & Africa Vehicle Chassis Dynamometer System Sales Value by Country (%), 2025 vs 2032
 Figure 36. Key Countries/Regions Vehicle Chassis Dynamometer System Sales Value (%), 2021–2032
 Figure 37. United States Vehicle Chassis Dynamometer System Sales Value (US$ Million), 2021–2032
 Figure 38. United States Vehicle Chassis Dynamometer System Sales Value by Type (%), 2025 vs 2032
 Figure 39. United States Vehicle Chassis Dynamometer System Sales Value by Application (%), 2025 vs 2032
 Figure 40. Europe Vehicle Chassis Dynamometer System Sales Value (US$ Million), 2021–2032
 Figure 41. Europe Vehicle Chassis Dynamometer System Sales Value by Type (%), 2025 vs 2032
 Figure 42. Europe Vehicle Chassis Dynamometer System Sales Value by Application (%), 2025 vs 2032
 Figure 43. China Vehicle Chassis Dynamometer System Sales Value (US$ Million), 2021–2032
 Figure 44. China Vehicle Chassis Dynamometer System Sales Value by Type (%), 2025 vs 2032
 Figure 45. China Vehicle Chassis Dynamometer System Sales Value by Application (%), 2025 vs 2032
 Figure 46. Japan Vehicle Chassis Dynamometer System Sales Value (US$ Million), 2021–2032
 Figure 47. Japan Vehicle Chassis Dynamometer System Sales Value by Type (%), 2025 vs 2032
 Figure 48. Japan Vehicle Chassis Dynamometer System Sales Value by Application (%), 2025 vs 2032
 Figure 49. South Korea Vehicle Chassis Dynamometer System Sales Value (US$ Million), 2021–2032
 Figure 50. South Korea Vehicle Chassis Dynamometer System Sales Value by Type (%), 2025 vs 2032
 Figure 51. South Korea Vehicle Chassis Dynamometer System Sales Value by Application (%), 2025 vs 2032
 Figure 52. Southeast Asia Vehicle Chassis Dynamometer System Sales Value (US$ Million), 2021–2032
 Figure 53. Southeast Asia Vehicle Chassis Dynamometer System Sales Value by Type (%), 2025 vs 2032
 Figure 54. Southeast Asia Vehicle Chassis Dynamometer System Sales Value by Application (%), 2025 vs 2032
 Figure 55. India Vehicle Chassis Dynamometer System Sales Value (US$ Million), 2021–2032
 Figure 56. India Vehicle Chassis Dynamometer System Sales Value by Type (%), 2025 vs 2032
 Figure 57. India Vehicle Chassis Dynamometer System Sales Value by Application (%), 2025 vs 2032
 Figure 58. Vehicle Chassis Dynamometer System Value Chain
 Figure 59. Vehicle Chassis Dynamometer System Cost Structure
 Figure 60. Channels of Distribution (Direct Sales, and Distribution)
 Figure 61. Bottom-up and Top-down Approaches for This Report
 Figure 62. Data Triangulation
 Figure 63. Key Executives Interviewed
SELECT A FORMAT
Added to Cart
Electronic

$3950

Single User License
Electronic

$5925

Multi User License
Electronic

$7900

Enterprise License
Add to Cart
Buy Now (15% Discount)

OUR CUSTOMER

Seventh Sense AI

SIMILAR REPORTS