List of Tables
Table 1. Global Goat Cheese Market Value by Type (US$ Million), 2025 vs 2032
Table 2. Global Goat Cheese Market Value by Aging Level (US$ Million), 2025 vs 2032
Table 3. Global Goat Cheese Market Value by Physical Form (US$ Million), 2025 vs 2032
Table 4. Global Goat Cheese Market Value by Production Origin (US$ Million), 2025 vs 2032
Table 5. Global Goat Cheese Market Value by Application (US$ Million), 2025 vs 2032
Table 6. Global Goat Cheese Market Competitive Situation by Manufacturers in 2025
Table 7. Global Goat Cheese Sales (MT) of Key Manufacturers (2021–2026)
Table 8. Global Goat Cheese Sales Market Share by Manufacturers (2021–2026)
Table 9. Global Goat Cheese Revenue (US$ Million) by Manufacturers (2021–2026)
Table 10. Global Goat Cheese Revenue Share by Manufacturers (2021–2026)
Table 11. Global Market Goat Cheese Average Price (USD/MT) of Key Manufacturers (2021–2026)
Table 12. Global Key Players of Goat Cheese, Industry Ranking, 2023 vs 2024 vs 2025
Table 13. Global Key Manufacturers of Goat Cheese, Manufacturing Sites and Headquarters
Table 14. Global Key Manufacturers of Goat Cheese, Product Types and Applications
Table 15. Global Key Manufacturers of Goat Cheese, Date of Entry into the Industry
Table 16. Global Manufacturers Market Concentration Ratio (CR5 and HHI)
Table 17. Global Goat Cheese Companies by Tier (Tier 1, Tier 2, Tier 3), based on Goat Cheese Revenue, 2025
Table 18. Manufacturers Mergers & Acquisitions, Expansion Plans
Table 19. Global Goat Cheese Market Size by Region (US$ Million): 2021 vs 2025 vs 2032
Table 20. Global Goat Cheese Sales by Region (MT), 2021–2026
Table 21. Global Goat Cheese Sales Market Share by Region (2021–2026)
Table 22. Global Goat Cheese Sales by Region (MT), 2027–2032
Table 23. Global Goat Cheese Sales Market Share by Region (2027–2032)
Table 24. Global Goat Cheese Revenue by Region (US$ Million), 2021–2026
Table 25. Global Goat Cheese Revenue Market Share by Region (2021–2026)
Table 26. Global Goat Cheese Revenue by Region (US$ Million), 2027–2032
Table 27. Global Goat Cheese Revenue Market Share by Region (2027–2032)
Table 28. North America Goat Cheese Revenue by Country: 2021 vs 2025 vs 2032 (US$ Million)
Table 29. North America Goat Cheese Sales by Country (MT), 2021–2026
Table 30. North America Goat Cheese Sales by Country (MT), 2027–2032
Table 31. North America Goat Cheese Revenue by Country (US$ Million), 2021–2026
Table 32. North America Goat Cheese Revenue by Country (US$ Million), 2027–2032
Table 33. Europe Goat Cheese Revenue by Country: 2021 vs 2025 vs 2032 (US$ Million)
Table 34. Europe Goat Cheese Sales by Country (MT), 2021–2026
Table 35. Europe Goat Cheese Sales by Country (MT), 2027–2032
Table 36. Europe Goat Cheese Revenue by Country (US$ Million), 2021–2026
Table 37. Europe Goat Cheese Revenue by Country (US$ Million), 2027–2032
Table 38. Asia Pacific Goat Cheese Revenue by Region: 2021 vs 2025 vs 2032 (US$ Million)
Table 39. Asia Pacific Goat Cheese Sales by Region (MT), 2021–2026
Table 40. Asia Pacific Goat Cheese Sales by Region (MT), 2027–2032
Table 41. Asia Pacific Goat Cheese Revenue by Region (US$ Million), 2021–2026
Table 42. Asia Pacific Goat Cheese Revenue by Region (US$ Million), 2027–2032
Table 43. Latin America Goat Cheese Revenue by Country: 2021 vs 2025 vs 2032 (US$ Million)
Table 44. Latin America Goat Cheese Sales by Country (MT), 2021–2026
Table 45. Latin America Goat Cheese Sales by Country (MT), 2027–2032
Table 46. Latin America Goat Cheese Revenue by Country (US$ Million), 2021–2026
Table 47. Latin America Goat Cheese Revenue by Country (US$ Million), 2027–2032
Table 48. Middle East and Africa Goat Cheese Revenue by Country: 2021 vs 2025 vs 2032 (US$ Million)
Table 49. Middle East and Africa Goat Cheese Sales by Country (MT), 2021–2026
Table 50. Middle East and Africa Goat Cheese Sales by Country (MT), 2027–2032
Table 51. Middle East and Africa Goat Cheese Revenue by Country (US$ Million), 2021–2026
Table 52. Middle East and Africa Goat Cheese Revenue by Country (US$ Million), 2027–2032
Table 53. Global Goat Cheese Sales (MT) by Type (2021–2026)
Table 54. Global Goat Cheese Sales (MT) by Type (2027–2032)
Table 55. Global Goat Cheese Sales Market Share by Type (2021–2026)
Table 56. Global Goat Cheese Sales Market Share by Type (2027–2032)
Table 57. Global Goat Cheese Revenue (US$ Million) by Type (2021–2026)
Table 58. Global Goat Cheese Revenue (US$ Million) by Type (2027–2032)
Table 59. Global Goat Cheese Revenue Market Share by Type (2021–2026)
Table 60. Global Goat Cheese Revenue Market Share by Type (2027–2032)
Table 61. Global Goat Cheese Price (USD/MT) by Type (2021–2026)
Table 62. Global Goat Cheese Price (USD/MT) by Type (2027–2032)
Table 63. Global Goat Cheese Sales (MT) by Application (2021–2026)
Table 64. Global Goat Cheese Sales (MT) by Application (2027–2032)
Table 65. Global Goat Cheese Sales Market Share by Application (2021–2026)
Table 66. Global Goat Cheese Sales Market Share by Application (2027–2032)
Table 67. Global Goat Cheese Revenue (US$ Million) by Application (2021–2026)
Table 68. Global Goat Cheese Revenue (US$ Million) by Application (2027–2032)
Table 69. Global Goat Cheese Revenue Market Share by Application (2021–2026)
Table 70. Global Goat Cheese Revenue Market Share by Application (2027–2032)
Table 71. Global Goat Cheese Price (USD/MT) by Application (2021–2026)
Table 72. Global Goat Cheese Price (USD/MT) by Application (2027–2032)
Table 73. Eurial Soignon Company Information
Table 74. Eurial Soignon Description and Business Overview
Table 75. Eurial Soignon Goat Cheese Sales (MT), Revenue (US$ Million), Price (USD/MT), and Gross Margin (2021–2026)
Table 76. Eurial Soignon Goat Cheese Product
Table 77. Eurial Soignon Recent Developments/Updates
Table 78. Lactalis Group Company Information
Table 79. Lactalis Group Description and Business Overview
Table 80. Lactalis Group Goat Cheese Sales (MT), Revenue (US$ Million), Price (USD/MT), and Gross Margin (2021–2026)
Table 81. Lactalis Group Goat Cheese Product
Table 82. Lactalis Group Recent Developments/Updates
Table 83. Savencia Fromage & Dairy Company Information
Table 84. Savencia Fromage & Dairy Description and Business Overview
Table 85. Savencia Fromage & Dairy Goat Cheese Sales (MT), Revenue (US$ Million), Price (USD/MT), and Gross Margin (2021–2026)
Table 86. Savencia Fromage & Dairy Goat Cheese Product
Table 87. Savencia Fromage & Dairy Recent Developments/Updates
Table 88. Emmi Group Company Information
Table 89. Emmi Group Description and Business Overview
Table 90. Emmi Group Goat Cheese Sales (MT), Revenue (US$ Million), Price (USD/MT), and Gross Margin (2021–2026)
Table 91. Emmi Group Goat Cheese Product
Table 92. Emmi Group Recent Developments/Updates
Table 93. Saputo Inc Company Information
Table 94. Saputo Inc Description and Business Overview
Table 95. Saputo Inc Goat Cheese Sales (MT), Revenue (US$ Million), Price (USD/MT), and Gross Margin (2021–2026)
Table 96. Saputo Inc Goat Cheese Product
Table 97. Saputo Inc Recent Developments/Updates
Table 98. Vermont Creamery Company Information
Table 99. Vermont Creamery Description and Business Overview
Table 100. Vermont Creamery Goat Cheese Sales (MT), Revenue (US$ Million), Price (USD/MT), and Gross Margin (2021–2026)
Table 101. Vermont Creamery Goat Cheese Product
Table 102. Vermont Creamery Recent Developments/Updates
Table 103. Cypress Grove Company Information
Table 104. Cypress Grove Description and Business Overview
Table 105. Cypress Grove Goat Cheese Sales (MT), Revenue (US$ Million), Price (USD/MT), and Gross Margin (2021–2026)
Table 106. Cypress Grove Goat Cheese Product
Table 107. Cypress Grove Recent Developments/Updates
Table 108. Delamere Dairy Company Information
Table 109. Delamere Dairy Description and Business Overview
Table 110. Delamere Dairy Goat Cheese Sales (MT), Revenue (US$ Million), Price (USD/MT), and Gross Margin (2021–2026)
Table 111. Delamere Dairy Goat Cheese Product
Table 112. Delamere Dairy Recent Developments/Updates
Table 113. Abergavenny Fine Foods Company Information
Table 114. Abergavenny Fine Foods Description and Business Overview
Table 115. Abergavenny Fine Foods Goat Cheese Sales (MT), Revenue (US$ Million), Price (USD/MT), and Gross Margin (2021–2026)
Table 116. Abergavenny Fine Foods Goat Cheese Product
Table 117. Abergavenny Fine Foods Recent Developments/Updates
Table 118. Henri Willig Company Information
Table 119. Henri Willig Description and Business Overview
Table 120. Henri Willig Goat Cheese Sales (MT), Revenue (US$ Million), Price (USD/MT), and Gross Margin (2021–2026)
Table 121. Henri Willig Goat Cheese Product
Table 122. Henri Willig Recent Developments/Updates
Table 123. Bettinehoeve Company Information
Table 124. Bettinehoeve Description and Business Overview
Table 125. Bettinehoeve Goat Cheese Sales (MT), Revenue (US$ Million), Price (USD/MT), and Gross Margin (2021–2026)
Table 126. Bettinehoeve Goat Cheese Product
Table 127. Bettinehoeve Recent Developments/Updates
Table 128. Laura Chenel Company Information
Table 129. Laura Chenel Description and Business Overview
Table 130. Laura Chenel Goat Cheese Sales (MT), Revenue (US$ Million), Price (USD/MT), and Gross Margin (2021–2026)
Table 131. Laura Chenel Goat Cheese Product
Table 132. Laura Chenel Recent Developments/Updates
Table 133. Triballat Noyal Rians Company Information
Table 134. Triballat Noyal Rians Description and Business Overview
Table 135. Triballat Noyal Rians Goat Cheese Sales (MT), Revenue (US$ Million), Price (USD/MT), and Gross Margin (2021–2026)
Table 136. Triballat Noyal Rians Goat Cheese Product
Table 137. Triballat Noyal Rians Recent Developments/Updates
Table 138. LaClare Family Creamery Company Information
Table 139. LaClare Family Creamery Description and Business Overview
Table 140. LaClare Family Creamery Goat Cheese Sales (MT), Revenue (US$ Million), Price (USD/MT), and Gross Margin (2021–2026)
Table 141. LaClare Family Creamery Goat Cheese Product
Table 142. LaClare Family Creamery Recent Developments/Updates
Table 143. Murciana de Quesos Company Information
Table 144. Murciana de Quesos Description and Business Overview
Table 145. Murciana de Quesos Goat Cheese Sales (MT), Revenue (US$ Million), Price (USD/MT), and Gross Margin (2021–2026)
Table 146. Murciana de Quesos Goat Cheese Product
Table 147. Murciana de Quesos Recent Developments/Updates
Table 148. Quesos El Pastor Company Information
Table 149. Quesos El Pastor Description and Business Overview
Table 150. Quesos El Pastor Goat Cheese Sales (MT), Revenue (US$ Million), Price (USD/MT), and Gross Margin (2021–2026)
Table 151. Quesos El Pastor Goat Cheese Product
Table 152. Quesos El Pastor Recent Developments/Updates
Table 153. Alouette Cheese Company Information
Table 154. Alouette Cheese Description and Business Overview
Table 155. Alouette Cheese Goat Cheese Sales (MT), Revenue (US$ Million), Price (USD/MT), and Gross Margin (2021–2026)
Table 156. Alouette Cheese Goat Cheese Product
Table 157. Alouette Cheese Recent Developments/Updates
Table 158. Woolwich Dairy Company Information
Table 159. Woolwich Dairy Description and Business Overview
Table 160. Woolwich Dairy Goat Cheese Sales (MT), Revenue (US$ Million), Price (USD/MT), and Gross Margin (2021–2026)
Table 161. Woolwich Dairy Goat Cheese Product
Table 162. Woolwich Dairy Recent Developments/Updates
Table 163. Président Cheese Company Information
Table 164. Président Cheese Description and Business Overview
Table 165. Président Cheese Goat Cheese Sales (MT), Revenue (US$ Million), Price (USD/MT), and Gross Margin (2021–2026)
Table 166. Président Cheese Goat Cheese Product
Table 167. Président Cheese Recent Developments/Updates
Table 168. Montchevre Company Information
Table 169. Montchevre Description and Business Overview
Table 170. Montchevre Goat Cheese Sales (MT), Revenue (US$ Million), Price (USD/MT), and Gross Margin (2021–2026)
Table 171. Montchevre Goat Cheese Product
Table 172. Montchevre Recent Developments/Updates
Table 173. Key Raw Materials Lists
Table 174. Raw Materials Key Suppliers Lists
Table 175. Goat Cheese Distributors List
Table 176. Goat Cheese Customers List
Table 177. Goat Cheese Market Trends
Table 178. Goat Cheese Market Drivers
Table 179. Goat Cheese Market Challenges
Table 180. Goat Cheese Market Restraints
Table 181. Research Programs/Design for This Report
Table 182. Key Data Information from Secondary Sources
Table 183. Key Data Information from Primary Sources
Table 184. Authors List of This Report
List of Figures
Figure 1. Product Picture of Goat Cheese
Figure 2. Global Goat Cheese Market Value by Type (US$ Million), 2021–2032
Figure 3. Global Goat Cheese Market Share by Type: 2025 & 2032
Figure 4. Fresh Chevre Product Picture
Figure 5. Ripened Log and Crottin Product Picture
Figure 6. Semi hard Goat Cheese Product Picture
Figure 7. Hard and Aged Goat Cheese Product Picture
Figure 8. Specialty Flavored Goat Cheese Product Picture
Figure 9. Global Goat Cheese Market Value by Aging Level (US$ Million), 2021–2032
Figure 10. Global Goat Cheese Market Share by Aging Level: 2025 vs 2032
Figure 11. Fresh Under Two Weeks Product Picture
Figure 12. Young to Medium Product Picture
Figure 13. Aged Long Maturation Product Picture
Figure 14. Global Goat Cheese Market Value by Physical Form (US$ Million), 2021–2032
Figure 15. Global Goat Cheese Market Share by Physical Form: 2025 vs 2032
Figure 16. Log Product Picture
Figure 17. Crumbles Product Picture
Figure 18. Wheel or Block Product Picture
Figure 19. Spreadable Product Picture
Figure 20. Slices and Medallions Product Picture
Figure 21. Global Goat Cheese Market Value by Production Origin (US$ Million), 2021–2032
Figure 22. Global Goat Cheese Market Share by Production Origin: 2025 vs 2032
Figure 23. Farmstead On Farm Product Picture
Figure 24. Creamery Industrial Product Picture
Figure 25. Organic Certified Product Picture
Figure 26. Global Goat Cheese Market Value by Application (US$ Million), 2021–2032
Figure 27. Global Goat Cheese Market Share by Application: 2025 & 2032
Figure 28. Retail
Figure 29. Foodservice
Figure 30. Food Manufacturing
Figure 31. Specialty and Gift
Figure 32. Others
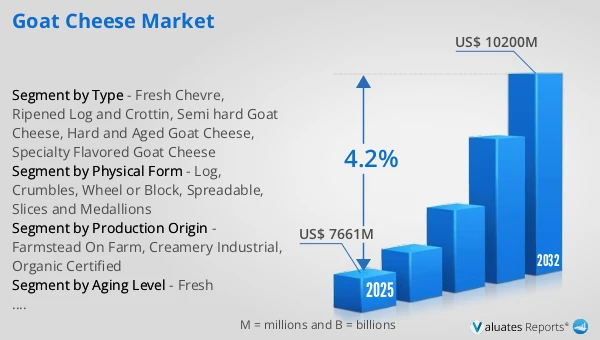
Figure 33. Global Goat Cheese Revenue, (US$ Million), 2021 vs 2025 vs 2032
Figure 34. Global Goat Cheese Market Size (US$ Million), 2021–2032
Figure 35. Global Goat Cheese Sales (MT), 2021–2032
Figure 36. Global Goat Cheese Average Price (USD/MT), 2021–2032
Figure 37. Goat Cheese Report Years Considered
Figure 38. Goat Cheese Sales Share by Manufacturers in 2025
Figure 39. Global Goat Cheese Revenue Share by Manufacturers in 2025
Figure 40. Top 5 and Top 10 Global Goat Cheese Players: Market Share by Revenue in Goat Cheese in 2025
Figure 41. Goat Cheese Market Share by Company Type (Tier 1, Tier 2, and Tier 3): 2021 vs 2025
Figure 42. Global Goat Cheese Market Size by Region (US$ Million): 2021 vs 2025 vs 2032
Figure 43. North America Goat Cheese Sales Market Share by Country (2021–2032)
Figure 44. North America Goat Cheese Revenue Market Share by Country (2021–2032)
Figure 45. U.S. Goat Cheese Revenue Growth Rate (US$ Million), 2021–2032
Figure 46. Canada Goat Cheese Revenue Growth Rate (US$ Million), 2021–2032
Figure 47. Europe Goat Cheese Sales Market Share by Country (2021–2032)
Figure 48. Europe Goat Cheese Revenue Market Share by Country (2021–2032)
Figure 49. Germany Goat Cheese Revenue Growth Rate (US$ Million), 2021–2032
Figure 50. France Goat Cheese Revenue Growth Rate (US$ Million), 2021–2032
Figure 51. U.K. Goat Cheese Revenue Growth Rate (US$ Million), 2021–2032
Figure 52. Italy Goat Cheese Revenue Growth Rate (US$ Million), 2021–2032
Figure 53. Russia Goat Cheese Revenue Growth Rate (US$ Million), 2021–2032
Figure 54. Asia Pacific Goat Cheese Sales Market Share by Region (2021–2032)
Figure 55. Asia Pacific Goat Cheese Revenue Market Share by Region (2021–2032)
Figure 56. China Goat Cheese Revenue Growth Rate (US$ Million), 2021–2032
Figure 57. Japan Goat Cheese Revenue Growth Rate (US$ Million), 2021–2032
Figure 58. South Korea Goat Cheese Revenue Growth Rate (US$ Million), 2021–2032
Figure 59. India Goat Cheese Revenue Growth Rate (US$ Million), 2021–2032
Figure 60. Australia Goat Cheese Revenue Growth Rate (US$ Million), 2021–2032
Figure 61. China Taiwan Goat Cheese Revenue Growth Rate (US$ Million), 2021–2032
Figure 62. Indonesia Goat Cheese Revenue Growth Rate (US$ Million), 2021–2032
Figure 63. Thailand Goat Cheese Revenue Growth Rate (US$ Million), 2021–2032
Figure 64. Malaysia Goat Cheese Revenue Growth Rate (US$ Million), 2021–2032
Figure 65. Philippines Goat Cheese Revenue Growth Rate (US$ Million), 2021–2032
Figure 66. Latin America Goat Cheese Sales Market Share by Country (2021–2032)
Figure 67. Latin America Goat Cheese Revenue Market Share by Country (2021–2032)
Figure 68. Mexico Goat Cheese Revenue Growth Rate (US$ Million), 2021–2032
Figure 69. Brazil Goat Cheese Revenue Growth Rate (US$ Million), 2021–2032
Figure 70. Argentina Goat Cheese Revenue Growth Rate (US$ Million), 2021–2032
Figure 71. Middle East and Africa Goat Cheese Sales Market Share by Country (2021–2032)
Figure 72. Middle East and Africa Goat Cheese Revenue Market Share by Country (2021–2032)
Figure 73. Turkey Goat Cheese Revenue Growth Rate (US$ Million), 2021–2032
Figure 74. Saudi Arabia Goat Cheese Revenue Growth Rate (US$ Million), 2021–2032
Figure 75. U.A.E Goat Cheese Revenue Growth Rate (US$ Million), 2021–2032
Figure 76. Global Sales Market Share of Goat Cheese by Type (2021–2032)
Figure 77. Global Revenue Market Share of Goat Cheese by Type (2021–2032)
Figure 78. Global Goat Cheese Price (USD/MT) by Type (2021–2032)
Figure 79. Global Sales Market Share of Goat Cheese by Application (2021–2032)
Figure 80. Global Revenue Market Share of Goat Cheese by Application (2021–2032)
Figure 81. Global Goat Cheese Price (USD/MT) by Application (2021–2032)
Figure 82. Goat Cheese Value Chain
Figure 83. Channels of Distribution (Direct Vs Distribution)
Figure 84. Bottom-up and Top-down Approaches for This Report
Figure 85. Data Triangulation
Figure 86. Key Executives Interviewed