List of Tables
Table 1. Global Textile Coating Services Market Size Growth Rate by Type (US$ Million): 2020 VS 2024 VS 2031
Table 2. Key Players of Waterproof and Breathable Coating
Table 3. Key Players of Flame Retardant Coating
Table 4. Key Players of UV Resistant Coating
Table 5. Key Players of Antibacterial and Anti-mite Coating
Table 6. Global Textile Coating Services Market Size Growth Rate by Material Formulation (US$ Million): 2020 VS 2024 VS 2031
Table 7. Key Players of Silicone Coating
Table 8. Key Players of Fluorocarbon Coating
Table 9. Key Players of Bio-based Coating
Table 10. Global Textile Coating Services Market Size Growth Rate by Environmentally Friendly (US$ Million): 2020 VS 2024 VS 2031
Table 11. Key Players of Solvent-free Coating
Table 12. Key Players of Recyclable Coating
Table 13. Key Players of Peelable Coating
Table 14. Global Textile Coating Services Market Size Growth by Application (US$ Million): 2020 VS 2024 VS 2031
Table 15. Global Textile Coating Services Market Size by Region (US$ Million): 2020 VS 2024 VS 2031
Table 16. Global Textile Coating Services Market Size by Region (2020-2025) & (US$ Million)
Table 17. Global Textile Coating Services Market Share by Region (2020-2025)
Table 18. Global Textile Coating Services Forecasted Market Size by Region (2026-2031) & (US$ Million)
Table 19. Global Textile Coating Services Market Share by Region (2026-2031)
Table 20. Textile Coating Services Market Trends
Table 21. Textile Coating Services Market Drivers
Table 22. Textile Coating Services Market Challenges
Table 23. Textile Coating Services Market Restraints
Table 24. Global Textile Coating Services Revenue by Players (2020-2025) & (US$ Million)
Table 25. Global Textile Coating Services Market Share by Players (2020-2025)
Table 26. Global Top Textile Coating Services Players by Company Type (Tier 1, Tier 2, and Tier 3) & (based on the Revenue in Textile Coating Services as of 2024)
Table 27. Ranking of Global Top Textile Coating Services Companies by Revenue (US$ Million) in 2024
Table 28. Global 5 Largest Players Market Share by Textile Coating Services Revenue (CR5 and HHI) & (2020-2025)
Table 29. Global Key Players of Textile Coating Services, Headquarters and Area Served
Table 30. Global Key Players of Textile Coating Services, Product and Application
Table 31. Global Key Players of Textile Coating Services, Date of Enter into This Industry
Table 32. Mergers & Acquisitions, Expansion Plans
Table 33. Global Textile Coating Services Market Size by Type (2020-2025) & (US$ Million)
Table 34. Global Textile Coating Services Revenue Market Share by Type (2020-2025)
Table 35. Global Textile Coating Services Forecasted Market Size by Type (2026-2031) & (US$ Million)
Table 36. Global Textile Coating Services Revenue Market Share by Type (2026-2031)
Table 37. Global Textile Coating Services Market Size by Application (2020-2025) & (US$ Million)
Table 38. Global Textile Coating Services Revenue Market Share by Application (2020-2025)
Table 39. Global Textile Coating Services Forecasted Market Size by Application (2026-2031) & (US$ Million)
Table 40. Global Textile Coating Services Revenue Market Share by Application (2026-2031)
Table 41. North America Textile Coating Services Market Size Growth Rate by Country (US$ Million): 2020 VS 2024 VS 2031
Table 42. North America Textile Coating Services Market Size by Country (2020-2025) & (US$ Million)
Table 43. North America Textile Coating Services Market Size by Country (2026-2031) & (US$ Million)
Table 44. Europe Textile Coating Services Market Size Growth Rate by Country (US$ Million): 2020 VS 2024 VS 2031
Table 45. Europe Textile Coating Services Market Size by Country (2020-2025) & (US$ Million)
Table 46. Europe Textile Coating Services Market Size by Country (2026-2031) & (US$ Million)
Table 47. Asia-Pacific Textile Coating Services Market Size Growth Rate by Region (US$ Million): 2020 VS 2024 VS 2031
Table 48. Asia-Pacific Textile Coating Services Market Size by Region (2020-2025) & (US$ Million)
Table 49. Asia-Pacific Textile Coating Services Market Size by Region (2026-2031) & (US$ Million)
Table 50. Latin America Textile Coating Services Market Size Growth Rate by Country (US$ Million): 2020 VS 2024 VS 2031
Table 51. Latin America Textile Coating Services Market Size by Country (2020-2025) & (US$ Million)
Table 52. Latin America Textile Coating Services Market Size by Country (2026-2031) & (US$ Million)
Table 53. Middle East & Africa Textile Coating Services Market Size Growth Rate by Country (US$ Million): 2020 VS 2024 VS 2031
Table 54. Middle East & Africa Textile Coating Services Market Size by Country (2020-2025) & (US$ Million)
Table 55. Middle East & Africa Textile Coating Services Market Size by Country (2026-2031) & (US$ Million)
Table 56. Voss Merino Works Company Details
Table 57. Voss Merino Works Business Overview
Table 58. Voss Merino Works Textile Coating Services Product
Table 59. Voss Merino Works Revenue in Textile Coating Services Business (2020-2025) & (US$ Million)
Table 60. Voss Merino Works Recent Development
Table 61. Silqura Silk Labs Company Details
Table 62. Silqura Silk Labs Business Overview
Table 63. Silqura Silk Labs Textile Coating Services Product
Table 64. Silqura Silk Labs Revenue in Textile Coating Services Business (2020-2025) & (US$ Million)
Table 65. Silqura Silk Labs Recent Development
Table 66. Bramley Cotton Company Details
Table 67. Bramley Cotton Business Overview
Table 68. Bramley Cotton Textile Coating Services Product
Table 69. Bramley Cotton Revenue in Textile Coating Services Business (2020-2025) & (US$ Million)
Table 70. Bramley Cotton Recent Development
Table 71. Sateri Group Company Details
Table 72. Sateri Group Business Overview
Table 73. Sateri Group Textile Coating Services Product
Table 74. Sateri Group Revenue in Textile Coating Services Business (2020-2025) & (US$ Million)
Table 75. Sateri Group Recent Development
Table 76. Dongguan Yida Machinery Technology Company Details
Table 77. Dongguan Yida Machinery Technology Business Overview
Table 78. Dongguan Yida Machinery Technology Textile Coating Services Product
Table 79. Dongguan Yida Machinery Technology Revenue in Textile Coating Services Business (2020-2025) & (US$ Million)
Table 80. Dongguan Yida Machinery Technology Recent Development
Table 81. Suihan Textile Company Details
Table 82. Suihan Textile Business Overview
Table 83. Suihan Textile Textile Coating Services Product
Table 84. Suihan Textile Revenue in Textile Coating Services Business (2020-2025) & (US$ Million)
Table 85. Suihan Textile Recent Development
Table 86. Kexiya Silk Weaving Company Details
Table 87. Kexiya Silk Weaving Business Overview
Table 88. Kexiya Silk Weaving Textile Coating Services Product
Table 89. Kexiya Silk Weaving Revenue in Textile Coating Services Business (2020-2025) & (US$ Million)
Table 90. Kexiya Silk Weaving Recent Development
Table 91. Luna Cashmere Mills Company Details
Table 92. Luna Cashmere Mills Business Overview
Table 93. Luna Cashmere Mills Textile Coating Services Product
Table 94. Luna Cashmere Mills Revenue in Textile Coating Services Business (2020-2025) & (US$ Million)
Table 95. Luna Cashmere Mills Recent Development
Table 96. Lutai Cotton Textile Technology Company Details
Table 97. Lutai Cotton Textile Technology Business Overview
Table 98. Lutai Cotton Textile Technology Textile Coating Services Product
Table 99. Lutai Cotton Textile Technology Revenue in Textile Coating Services Business (2020-2025) & (US$ Million)
Table 100. Lutai Cotton Textile Technology Recent Development
Table 101. TechShield Textiles Company Details
Table 102. TechShield Textiles Business Overview
Table 103. TechShield Textiles Textile Coating Services Product
Table 104. TechShield Textiles Revenue in Textile Coating Services Business (2020-2025) & (US$ Million)
Table 105. TechShield Textiles Recent Development
Table 106. EcoLoom Fabrics Company Details
Table 107. EcoLoom Fabrics Business Overview
Table 108. EcoLoom Fabrics Textile Coating Services Product
Table 109. EcoLoom Fabrics Revenue in Textile Coating Services Business (2020-2025) & (US$ Million)
Table 110. EcoLoom Fabrics Recent Development
Table 111. Leilino Protective Weaving Company Details
Table 112. Leilino Protective Weaving Business Overview
Table 113. Leilino Protective Weaving Textile Coating Services Product
Table 114. Leilino Protective Weaving Revenue in Textile Coating Services Business (2020-2025) & (US$ Million)
Table 115. Leilino Protective Weaving Recent Development
Table 116. NICCA Company Details
Table 117. NICCA Business Overview
Table 118. NICCA Textile Coating Services Product
Table 119. NICCA Revenue in Textile Coating Services Business (2020-2025) & (US$ Million)
Table 120. NICCA Recent Development
Table 121. Dymatic Chemicals Company Details
Table 122. Dymatic Chemicals Business Overview
Table 123. Dymatic Chemicals Textile Coating Services Product
Table 124. Dymatic Chemicals Revenue in Textile Coating Services Business (2020-2025) & (US$ Million)
Table 125. Dymatic Chemicals Recent Development
Table 126. Transfar Chemicals Company Details
Table 127. Transfar Chemicals Business Overview
Table 128. Transfar Chemicals Textile Coating Services Product
Table 129. Transfar Chemicals Revenue in Textile Coating Services Business (2020-2025) & (US$ Million)
Table 130. Transfar Chemicals Recent Development
Table 131. Bozzetto Group Company Details
Table 132. Bozzetto Group Business Overview
Table 133. Bozzetto Group Textile Coating Services Product
Table 134. Bozzetto Group Revenue in Textile Coating Services Business (2020-2025) & (US$ Million)
Table 135. Bozzetto Group Recent Development
Table 136. Akkim Kimya Company Details
Table 137. Akkim Kimya Business Overview
Table 138. Akkim Kimya Textile Coating Services Product
Table 139. Akkim Kimya Revenue in Textile Coating Services Business (2020-2025) & (US$ Million)
Table 140. Akkim Kimya Recent Development
Table 141. Rudolf GmbH Company Details
Table 142. Rudolf GmbH Business Overview
Table 143. Rudolf GmbH Textile Coating Services Product
Table 144. Rudolf GmbH Revenue in Textile Coating Services Business (2020-2025) & (US$ Million)
Table 145. Rudolf GmbH Recent Development
Table 146. Pulcra-Chemicals Company Details
Table 147. Pulcra-Chemicals Business Overview
Table 148. Pulcra-Chemicals Textile Coating Services Product
Table 149. Pulcra-Chemicals Revenue in Textile Coating Services Business (2020-2025) & (US$ Million)
Table 150. Pulcra-Chemicals Recent Development
Table 151. Archroma Company Details
Table 152. Archroma Business Overview
Table 153. Archroma Textile Coating Services Product
Table 154. Archroma Revenue in Textile Coating Services Business (2020-2025) & (US$ Million)
Table 155. Archroma Recent Development
Table 156. Zschimmer & Schwarz Company Details
Table 157. Zschimmer & Schwarz Business Overview
Table 158. Zschimmer & Schwarz Textile Coating Services Product
Table 159. Zschimmer & Schwarz Revenue in Textile Coating Services Business (2020-2025) & (US$ Million)
Table 160. Zschimmer & Schwarz Recent Development
Table 161. Research Programs/Design for This Report
Table 162. Key Data Information from Secondary Sources
Table 163. Key Data Information from Primary Sources
Table 164. Authors List of This Report
List of Figures
Figure 1. Textile Coating Services Picture
Figure 2. Global Textile Coating Services Market Size Comparison by Type (2020-2031) & (US$ Million)
Figure 3. Global Textile Coating Services Market Share by Type: 2024 VS 2031
Figure 4. Waterproof and Breathable Coating Features
Figure 5. Flame Retardant Coating Features
Figure 6. UV Resistant Coating Features
Figure 7. Antibacterial and Anti-mite Coating Features
Figure 8. Global Textile Coating Services Market Size Comparison by Material Formulation (2020-2031) & (US$ Million)
Figure 9. Silicone Coating Features
Figure 10. Fluorocarbon Coating Features
Figure 11. Bio-based Coating Features
Figure 12. Global Textile Coating Services Market Size Comparison by Environmentally Friendly (2020-2031) & (US$ Million)
Figure 13. Solvent-free Coating Features
Figure 14. Recyclable Coating Features
Figure 15. Peelable Coating Features
Figure 16. Global Textile Coating Services Market Size by Application (2020-2031) & (US$ Million)
Figure 17. Global Textile Coating Services Market Share by Application: 2024 VS 2031
Figure 18. Outdoor Sports Case Studies
Figure 19. Medical Protection Case Studies
Figure 20. Automotive Interiors Case Studies
Figure 21. Architectural Decoration Case Studies
Figure 22. Other Case Studies
Figure 23. Textile Coating Services Report Years Considered
Figure 24. Global Textile Coating Services Market Size (US$ Million), Year-over-Year: 2020-2031
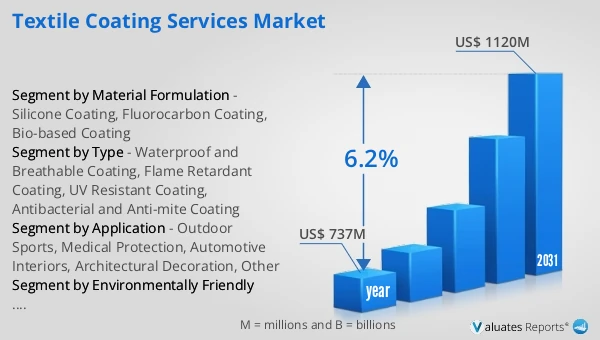
Figure 25. Global Textile Coating Services Market Size, (US$ Million), 2020 VS 2024 VS 2031
Figure 26. Global Textile Coating Services Market Share by Region: 2024 VS 2031
Figure 27. Global Textile Coating Services Market Share by Players in 2024
Figure 28. Global Textile Coating Services Market Share by Company Type (Tier 1, Tier 2, and Tier 3)
Figure 29. The Top 10 and 5 Players Market Share by Textile Coating Services Revenue in 2024
Figure 30. North America Textile Coating Services Market Size YoY Growth (2020-2031) & (US$ Million)
Figure 31. North America Textile Coating Services Market Share by Country (2020-2031)
Figure 32. United States Textile Coating Services Market Size YoY Growth (2020-2031) & (US$ Million)
Figure 33. Canada Textile Coating Services Market Size YoY Growth (2020-2031) & (US$ Million)
Figure 34. Europe Textile Coating Services Market Size YoY Growth (2020-2031) & (US$ Million)
Figure 35. Europe Textile Coating Services Market Share by Country (2020-2031)
Figure 36. Germany Textile Coating Services Market Size YoY Growth (2020-2031) & (US$ Million)
Figure 37. France Textile Coating Services Market Size YoY Growth (2020-2031) & (US$ Million)
Figure 38. U.K. Textile Coating Services Market Size YoY Growth (2020-2031) & (US$ Million)
Figure 39. Italy Textile Coating Services Market Size YoY Growth (2020-2031) & (US$ Million)
Figure 40. Russia Textile Coating Services Market Size YoY Growth (2020-2031) & (US$ Million)
Figure 41. Ireland Textile Coating Services Market Size YoY Growth (2020-2031) & (US$ Million)
Figure 42. Asia-Pacific Textile Coating Services Market Size YoY Growth (2020-2031) & (US$ Million)
Figure 43. Asia-Pacific Textile Coating Services Market Share by Region (2020-2031)
Figure 44. China Textile Coating Services Market Size YoY Growth (2020-2031) & (US$ Million)
Figure 45. Japan Textile Coating Services Market Size YoY Growth (2020-2031) & (US$ Million)
Figure 46. South Korea Textile Coating Services Market Size YoY Growth (2020-2031) & (US$ Million)
Figure 47. Southeast Asia Textile Coating Services Market Size YoY Growth (2020-2031) & (US$ Million)
Figure 48. India Textile Coating Services Market Size YoY Growth (2020-2031) & (US$ Million)
Figure 49. Australia & New Zealand Textile Coating Services Market Size YoY Growth (2020-2031) & (US$ Million)
Figure 50. Latin America Textile Coating Services Market Size YoY Growth (2020-2031) & (US$ Million)
Figure 51. Latin America Textile Coating Services Market Share by Country (2020-2031)
Figure 52. Mexico Textile Coating Services Market Size YoY Growth (2020-2031) & (US$ Million)
Figure 53. Brazil Textile Coating Services Market Size YoY Growth (2020-2031) & (US$ Million)
Figure 54. Middle East & Africa Textile Coating Services Market Size YoY Growth (2020-2031) & (US$ Million)
Figure 55. Middle East & Africa Textile Coating Services Market Share by Country (2020-2031)
Figure 56. Israel Textile Coating Services Market Size YoY Growth (2020-2031) & (US$ Million)
Figure 57. Saudi Arabia Textile Coating Services Market Size YoY Growth (2020-2031) & (US$ Million)
Figure 58. UAE Textile Coating Services Market Size YoY Growth (2020-2031) & (US$ Million)
Figure 59. Voss Merino Works Revenue Growth Rate in Textile Coating Services Business (2020-2025)
Figure 60. Silqura Silk Labs Revenue Growth Rate in Textile Coating Services Business (2020-2025)
Figure 61. Bramley Cotton Revenue Growth Rate in Textile Coating Services Business (2020-2025)
Figure 62. Sateri Group Revenue Growth Rate in Textile Coating Services Business (2020-2025)
Figure 63. Dongguan Yida Machinery Technology Revenue Growth Rate in Textile Coating Services Business (2020-2025)
Figure 64. Suihan Textile Revenue Growth Rate in Textile Coating Services Business (2020-2025)
Figure 65. Kexiya Silk Weaving Revenue Growth Rate in Textile Coating Services Business (2020-2025)
Figure 66. Luna Cashmere Mills Revenue Growth Rate in Textile Coating Services Business (2020-2025)
Figure 67. Lutai Cotton Textile Technology Revenue Growth Rate in Textile Coating Services Business (2020-2025)
Figure 68. TechShield Textiles Revenue Growth Rate in Textile Coating Services Business (2020-2025)
Figure 69. EcoLoom Fabrics Revenue Growth Rate in Textile Coating Services Business (2020-2025)
Figure 70. Leilino Protective Weaving Revenue Growth Rate in Textile Coating Services Business (2020-2025)
Figure 71. NICCA Revenue Growth Rate in Textile Coating Services Business (2020-2025)
Figure 72. Dymatic Chemicals Revenue Growth Rate in Textile Coating Services Business (2020-2025)
Figure 73. Transfar Chemicals Revenue Growth Rate in Textile Coating Services Business (2020-2025)
Figure 74. Bozzetto Group Revenue Growth Rate in Textile Coating Services Business (2020-2025)
Figure 75. Akkim Kimya Revenue Growth Rate in Textile Coating Services Business (2020-2025)
Figure 76. Rudolf GmbH Revenue Growth Rate in Textile Coating Services Business (2020-2025)
Figure 77. Pulcra-Chemicals Revenue Growth Rate in Textile Coating Services Business (2020-2025)
Figure 78. Archroma Revenue Growth Rate in Textile Coating Services Business (2020-2025)
Figure 79. Zschimmer & Schwarz Revenue Growth Rate in Textile Coating Services Business (2020-2025)
Figure 80. Bottom-up and Top-down Approaches for This Report
Figure 81. Data Triangulation
Figure 82. Key Executives Interviewed