0
U.S. (TOLL FREE)
+1 (315) 215-3225
Automative

0
U.S. (TOLL FREE)
+1 (315) 215-3225
Global Patent Valuation Market Research Report 2025
Published Date: January 2025
|
Report Code: QYRE-Auto-36B14302
Home | Market Reports | Law & Government| Legal
Global Patent Valuation Market Research Report 2023
BUY CHAPTERS

Global Patent Valuation Market Research Report 2025

Code: QYRE-Auto-36B14302
Report
January 2025
Pages:136
QYResearch
Buy Now with 15% Discount
DESCRIPTION
TABLE OF CONTENT
TABLES & FIGURES

Patent Valuation Market Size

The global market for Patent Valuation was valued at US$ 1262 million in the year 2024 and is projected to reach a revised size of US$ 2710 million by 2031, growing at a CAGR of 11.7% during the forecast period.

Patent Valuation Market

Patent Valuation Market

The patent valuation market is experiencing significant growth due to the increasing importance of intellectual property rights and the need for companies to protect their inventions and innovations. The market is expected to witness a steady growth rate in the coming years.The patent valuation market is primarily concentrated in developed regions such as North America and Europe. These regions have a high concentration of technology companies and a strong focus on intellectual property protection. However, emerging economies in Asia-Pacific, such as China and India, are also witnessing a significant increase in patent valuation activities due to their growing innovation capabilities.The patent valuation market is highly concentrated, with a few major players dominating the industry. These players have established themselves as leaders in providing patent valuation services and have a strong presence in key markets. However, there are also several smaller firms and independent consultants that cater to specific industries or niche markets.The increasing number of patent filings and the growing importance of intellectual property rights present significant opportunities for the patent valuation market. Companies are increasingly realizing the value of their patents and are seeking professional valuation services to maximize their returns. Additionally, the rise of emerging technologies such as artificial intelligence, blockchain, and biotechnology is creating new opportunities for patent valuation in these sectors.The patent valuation market faces several challenges that could impact its growth. One of the main challenges is the complexity of valuing patents, as it requires a deep understanding of the technology, market dynamics, and legal aspects. Additionally, the lack of standardized valuation methodologies and the subjective nature of patent valuation can make it challenging to reach consensus on the value of a patent. Moreover, the increasing number of patent trolls and litigation cases adds uncertainty to the market and can deter companies from investing in patent valuation.
This report aims to provide a comprehensive presentation of the global market for Patent Valuation, with both quantitative and qualitative analysis, to help readers develop business/growth strategies, assess the market competitive situation, analyze their position in the current marketplace, and make informed business decisions regarding Patent Valuation.
The Patent Valuation market size, estimations, and forecasts are provided in terms of and revenue ($ millions), considering 2024 as the base year, with history and forecast data for the period from 2020 to 2031. This report segments the global Patent Valuation market comprehensively. Regional market sizes, concerning products by Type, by Application, and by players, are also provided.
For a more in-depth understanding of the market, the report provides profiles of the competitive landscape, key competitors, and their respective market ranks. The report also discusses technological trends and new product developments.
The report will help the Patent Valuation companies, new entrants, and industry chain related companies in this market with information on the revenues for the overall market and the sub-segments across the different segments, by company, by Type, by Application, and by regions.
Market Segmentation

Scope of Patent Valuation Market Report

Report Metric Details
Report Name Patent Valuation Market
Accounted market size in year US$ 1262 million
Forecasted market size in 2031 US$ 2710 million
CAGR 11.7%
Base Year year
Forecasted years 2025 - 2031
Segment by Type
  • Software
  • Service
Segment by Application
  • Personal
  • Enterprise
  • Research Institute
By Region
  • North America (United States, Canada)
  • Europe (Germany, France, UK, Italy, Russia) Rest of Europe
  • Nordic Countries
  • Asia-Pacific (China, Japan, South Korea)
  • Southeast Asia (India, Australia)
  • Rest of Asia
  • Latin America (Mexico, Brazil)
  • Rest of Latin America
  • Middle East & Africa (Turkey, Saudi Arabia, UAE, Rest of MEA)
By Company InTraCoM, ktMINE, Toolip, Ocean Tomo, Ingot, PatSnap, Clarivate, Brandon IP, Dennemeyer, GHB Intellect, BaxterIP, Pellegrino Associates, PatSeer, May Figures Ltd, Leadenhall, TransactionsIP, Nevium, Kroll, Metis Partners, IPOfferings, Excelon IP, Sagacious IP, Aranca, OxFirst, Valueteam, Deloitte, Right Reality, EverEdge, Especia, Redwood, Soquel Group, Markman Advisors, IEBS, Tee IP, IP Wagon, InnoRes
Forecast units USD million in value
Report coverage Revenue and volume forecast, company share, competitive landscape, growth factors and trends

Chapter Outline

  • Chapter 1: Introduces the report scope of the report, executive summary of different market segments (by Type, by Application, etc), including the market size of each market segment, future development potential, and so on. It offers a high-level view of the current state of the market and its likely evolution in the short to mid-term, and long term.
  • Chapter 2: Introduces executive summary of global market size, regional market size, this section also introduces the market dynamics, latest developments of the market, the driving factors and restrictive factors of the market, the challenges and risks faced by companies in the industry, and the analysis of relevant policies in the industry.
  • Chapter 3: Detailed analysis of Patent Valuation company competitive landscape, revenue market share, latest development plan, merger, and acquisition information, etc.
  • Chapter 4: Provides the analysis of various market segments by Type, covering the market size and development potential of each market segment, to help readers find the blue ocean market in different market segments.
  • Chapter 5: Provides the analysis of various market segments by Application, covering the market size and development potential of each market segment, to help readers find the blue ocean market in different downstream markets.
  • Chapter 6, 7, 8, 9, 10: North America, Europe, Asia Pacific, Latin America, Middle East and Africa segment by country. It provides a quantitative analysis of the market size and development potential of each region and its main countries and introduces the market development, future development prospects, market space, and capacity of each country in the world.
  • Chapter 11: Provides profiles of key players, introducing the basic situation of the main companies in the market in detail, including product sales, revenue, price, gross margin, product introduction, recent development, etc.
  • Chapter 12: The main points and conclusions of the report.

FAQ for this report

How fast is Patent Valuation Market growing?

Ans: The Patent Valuation Market witnessing a CAGR of 11.7% during the forecast period 2025-2031.

What is the Patent Valuation Market size in 2031?

Ans: The Patent Valuation Market size in 2031 will be US$ 2710 million.

Who are the main players in the Patent Valuation Market report?

Ans: The main players in the Patent Valuation Market are InTraCoM, ktMINE, Toolip, Ocean Tomo, Ingot, PatSnap, Clarivate, Brandon IP, Dennemeyer, GHB Intellect, BaxterIP, Pellegrino Associates, PatSeer, May Figures Ltd, Leadenhall, TransactionsIP, Nevium, Kroll, Metis Partners, IPOfferings, Excelon IP, Sagacious IP, Aranca, OxFirst, Valueteam, Deloitte, Right Reality, EverEdge, Especia, Redwood, Soquel Group, Markman Advisors, IEBS, Tee IP, IP Wagon, InnoRes

What are the Application segmentation covered in the Patent Valuation Market report?

Ans: The Applications covered in the Patent Valuation Market report are Personal, Enterprise, Research Institute

What are the Type segmentation covered in the Patent Valuation Market report?

Ans: The Types covered in the Patent Valuation Market report are Software, Service

Recommended Reports

Patent Services

IP Valuation

Intellectual Property

1 Report Overview
1.1 Study Scope
1.2 Market Analysis by Type
1.2.1 Global Patent Valuation Market Size Growth Rate by Type: 2020 VS 2024 VS 2031
1.2.2 Software
1.2.3 Service
1.3 Market by Application
1.3.1 Global Patent Valuation Market Growth by Application: 2020 VS 2024 VS 2031
1.3.2 Personal
1.3.3 Enterprise
1.3.4 Research Institute
1.4 Assumptions and Limitations
1.5 Study Objectives
1.6 Years Considered
2 Global Growth Trends
2.1 Global Patent Valuation Market Perspective (2020-2031)
2.2 Global Patent Valuation Growth Trends by Region
2.2.1 Global Patent Valuation Market Size by Region: 2020 VS 2024 VS 2031
2.2.2 Patent Valuation Historic Market Size by Region (2020-2025)
2.2.3 Patent Valuation Forecasted Market Size by Region (2026-2031)
2.3 Patent Valuation Market Dynamics
2.3.1 Patent Valuation Industry Trends
2.3.2 Patent Valuation Market Drivers
2.3.3 Patent Valuation Market Challenges
2.3.4 Patent Valuation Market Restraints
3 Competition Landscape by Key Players
3.1 Global Top Patent Valuation Players by Revenue
3.1.1 Global Top Patent Valuation Players by Revenue (2020-2025)
3.1.2 Global Patent Valuation Revenue Market Share by Players (2020-2025)
3.2 Global Patent Valuation Market Share by Company Type (Tier 1, Tier 2, and Tier 3)
3.3 Global Key Players Ranking by Patent Valuation Revenue
3.4 Global Patent Valuation Market Concentration Ratio
3.4.1 Global Patent Valuation Market Concentration Ratio (CR5 and HHI)
3.4.2 Global Top 10 and Top 5 Companies by Patent Valuation Revenue in 2024
3.5 Global Key Players of Patent Valuation Head office and Area Served
3.6 Global Key Players of Patent Valuation, Product and Application
3.7 Global Key Players of Patent Valuation, Date of Enter into This Industry
3.8 Mergers & Acquisitions, Expansion Plans
4 Patent Valuation Breakdown Data by Type
4.1 Global Patent Valuation Historic Market Size by Type (2020-2025)
4.2 Global Patent Valuation Forecasted Market Size by Type (2026-2031)
5 Patent Valuation Breakdown Data by Application
5.1 Global Patent Valuation Historic Market Size by Application (2020-2025)
5.2 Global Patent Valuation Forecasted Market Size by Application (2026-2031)
6 North America
6.1 North America Patent Valuation Market Size (2020-2031)
6.2 North America Patent Valuation Market Growth Rate by Country: 2020 VS 2024 VS 2031
6.3 North America Patent Valuation Market Size by Country (2020-2025)
6.4 North America Patent Valuation Market Size by Country (2026-2031)
6.5 United States
6.6 Canada
7 Europe
7.1 Europe Patent Valuation Market Size (2020-2031)
7.2 Europe Patent Valuation Market Growth Rate by Country: 2020 VS 2024 VS 2031
7.3 Europe Patent Valuation Market Size by Country (2020-2025)
7.4 Europe Patent Valuation Market Size by Country (2026-2031)
7.5 Germany
7.6 France
7.7 U.K.
7.8 Italy
7.9 Russia
7.10 Nordic Countries
8 Asia-Pacific
8.1 Asia-Pacific Patent Valuation Market Size (2020-2031)
8.2 Asia-Pacific Patent Valuation Market Growth Rate by Region: 2020 VS 2024 VS 2031
8.3 Asia-Pacific Patent Valuation Market Size by Region (2020-2025)
8.4 Asia-Pacific Patent Valuation Market Size by Region (2026-2031)
8.5 China
8.6 Japan
8.7 South Korea
8.8 Southeast Asia
8.9 India
8.10 Australia
9 Latin America
9.1 Latin America Patent Valuation Market Size (2020-2031)
9.2 Latin America Patent Valuation Market Growth Rate by Country: 2020 VS 2024 VS 2031
9.3 Latin America Patent Valuation Market Size by Country (2020-2025)
9.4 Latin America Patent Valuation Market Size by Country (2026-2031)
9.5 Mexico
9.6 Brazil
10 Middle East & Africa
10.1 Middle East & Africa Patent Valuation Market Size (2020-2031)
10.2 Middle East & Africa Patent Valuation Market Growth Rate by Country: 2020 VS 2024 VS 2031
10.3 Middle East & Africa Patent Valuation Market Size by Country (2020-2025)
10.4 Middle East & Africa Patent Valuation Market Size by Country (2026-2031)
10.5 Turkey
10.6 Saudi Arabia
10.7 UAE
11 Key Players Profiles
11.1 InTraCoM
11.1.1 InTraCoM Company Details
11.1.2 InTraCoM Business Overview
11.1.3 InTraCoM Patent Valuation Introduction
11.1.4 InTraCoM Revenue in Patent Valuation Business (2020-2025)
11.1.5 InTraCoM Recent Development
11.2 ktMINE
11.2.1 ktMINE Company Details
11.2.2 ktMINE Business Overview
11.2.3 ktMINE Patent Valuation Introduction
11.2.4 ktMINE Revenue in Patent Valuation Business (2020-2025)
11.2.5 ktMINE Recent Development
11.3 Toolip
11.3.1 Toolip Company Details
11.3.2 Toolip Business Overview
11.3.3 Toolip Patent Valuation Introduction
11.3.4 Toolip Revenue in Patent Valuation Business (2020-2025)
11.3.5 Toolip Recent Development
11.4 Ocean Tomo
11.4.1 Ocean Tomo Company Details
11.4.2 Ocean Tomo Business Overview
11.4.3 Ocean Tomo Patent Valuation Introduction
11.4.4 Ocean Tomo Revenue in Patent Valuation Business (2020-2025)
11.4.5 Ocean Tomo Recent Development
11.5 Ingot
11.5.1 Ingot Company Details
11.5.2 Ingot Business Overview
11.5.3 Ingot Patent Valuation Introduction
11.5.4 Ingot Revenue in Patent Valuation Business (2020-2025)
11.5.5 Ingot Recent Development
11.6 PatSnap
11.6.1 PatSnap Company Details
11.6.2 PatSnap Business Overview
11.6.3 PatSnap Patent Valuation Introduction
11.6.4 PatSnap Revenue in Patent Valuation Business (2020-2025)
11.6.5 PatSnap Recent Development
11.7 Clarivate
11.7.1 Clarivate Company Details
11.7.2 Clarivate Business Overview
11.7.3 Clarivate Patent Valuation Introduction
11.7.4 Clarivate Revenue in Patent Valuation Business (2020-2025)
11.7.5 Clarivate Recent Development
11.8 Brandon IP
11.8.1 Brandon IP Company Details
11.8.2 Brandon IP Business Overview
11.8.3 Brandon IP Patent Valuation Introduction
11.8.4 Brandon IP Revenue in Patent Valuation Business (2020-2025)
11.8.5 Brandon IP Recent Development
11.9 Dennemeyer
11.9.1 Dennemeyer Company Details
11.9.2 Dennemeyer Business Overview
11.9.3 Dennemeyer Patent Valuation Introduction
11.9.4 Dennemeyer Revenue in Patent Valuation Business (2020-2025)
11.9.5 Dennemeyer Recent Development
11.10 GHB Intellect
11.10.1 GHB Intellect Company Details
11.10.2 GHB Intellect Business Overview
11.10.3 GHB Intellect Patent Valuation Introduction
11.10.4 GHB Intellect Revenue in Patent Valuation Business (2020-2025)
11.10.5 GHB Intellect Recent Development
11.11 BaxterIP
11.11.1 BaxterIP Company Details
11.11.2 BaxterIP Business Overview
11.11.3 BaxterIP Patent Valuation Introduction
11.11.4 BaxterIP Revenue in Patent Valuation Business (2020-2025)
11.11.5 BaxterIP Recent Development
11.12 Pellegrino Associates
11.12.1 Pellegrino Associates Company Details
11.12.2 Pellegrino Associates Business Overview
11.12.3 Pellegrino Associates Patent Valuation Introduction
11.12.4 Pellegrino Associates Revenue in Patent Valuation Business (2020-2025)
11.12.5 Pellegrino Associates Recent Development
11.13 PatSeer
11.13.1 PatSeer Company Details
11.13.2 PatSeer Business Overview
11.13.3 PatSeer Patent Valuation Introduction
11.13.4 PatSeer Revenue in Patent Valuation Business (2020-2025)
11.13.5 PatSeer Recent Development
11.14 May Figures Ltd
11.14.1 May Figures Ltd Company Details
11.14.2 May Figures Ltd Business Overview
11.14.3 May Figures Ltd Patent Valuation Introduction
11.14.4 May Figures Ltd Revenue in Patent Valuation Business (2020-2025)
11.14.5 May Figures Ltd Recent Development
11.15 Leadenhall
11.15.1 Leadenhall Company Details
11.15.2 Leadenhall Business Overview
11.15.3 Leadenhall Patent Valuation Introduction
11.15.4 Leadenhall Revenue in Patent Valuation Business (2020-2025)
11.15.5 Leadenhall Recent Development
11.16 TransactionsIP
11.16.1 TransactionsIP Company Details
11.16.2 TransactionsIP Business Overview
11.16.3 TransactionsIP Patent Valuation Introduction
11.16.4 TransactionsIP Revenue in Patent Valuation Business (2020-2025)
11.16.5 TransactionsIP Recent Development
11.17 Nevium
11.17.1 Nevium Company Details
11.17.2 Nevium Business Overview
11.17.3 Nevium Patent Valuation Introduction
11.17.4 Nevium Revenue in Patent Valuation Business (2020-2025)
11.17.5 Nevium Recent Development
11.18 Kroll
11.18.1 Kroll Company Details
11.18.2 Kroll Business Overview
11.18.3 Kroll Patent Valuation Introduction
11.18.4 Kroll Revenue in Patent Valuation Business (2020-2025)
11.18.5 Kroll Recent Development
11.19 Metis Partners
11.19.1 Metis Partners Company Details
11.19.2 Metis Partners Business Overview
11.19.3 Metis Partners Patent Valuation Introduction
11.19.4 Metis Partners Revenue in Patent Valuation Business (2020-2025)
11.19.5 Metis Partners Recent Development
11.20 IPOfferings
11.20.1 IPOfferings Company Details
11.20.2 IPOfferings Business Overview
11.20.3 IPOfferings Patent Valuation Introduction
11.20.4 IPOfferings Revenue in Patent Valuation Business (2020-2025)
11.20.5 IPOfferings Recent Development
11.21 Excelon IP
11.21.1 Excelon IP Company Details
11.21.2 Excelon IP Business Overview
11.21.3 Excelon IP Patent Valuation Introduction
11.21.4 Excelon IP Revenue in Patent Valuation Business (2020-2025)
11.21.5 Excelon IP Recent Development
11.22 Sagacious IP
11.22.1 Sagacious IP Company Details
11.22.2 Sagacious IP Business Overview
11.22.3 Sagacious IP Patent Valuation Introduction
11.22.4 Sagacious IP Revenue in Patent Valuation Business (2020-2025)
11.22.5 Sagacious IP Recent Development
11.23 Aranca
11.23.1 Aranca Company Details
11.23.2 Aranca Business Overview
11.23.3 Aranca Patent Valuation Introduction
11.23.4 Aranca Revenue in Patent Valuation Business (2020-2025)
11.23.5 Aranca Recent Development
11.24 OxFirst
11.24.1 OxFirst Company Details
11.24.2 OxFirst Business Overview
11.24.3 OxFirst Patent Valuation Introduction
11.24.4 OxFirst Revenue in Patent Valuation Business (2020-2025)
11.24.5 OxFirst Recent Development
11.25 Valueteam
11.25.1 Valueteam Company Details
11.25.2 Valueteam Business Overview
11.25.3 Valueteam Patent Valuation Introduction
11.25.4 Valueteam Revenue in Patent Valuation Business (2020-2025)
11.25.5 Valueteam Recent Development
11.26 Deloitte
11.26.1 Deloitte Company Details
11.26.2 Deloitte Business Overview
11.26.3 Deloitte Patent Valuation Introduction
11.26.4 Deloitte Revenue in Patent Valuation Business (2020-2025)
11.26.5 Deloitte Recent Development
11.27 Right Reality
11.27.1 Right Reality Company Details
11.27.2 Right Reality Business Overview
11.27.3 Right Reality Patent Valuation Introduction
11.27.4 Right Reality Revenue in Patent Valuation Business (2020-2025)
11.27.5 Right Reality Recent Development
11.28 EverEdge
11.28.1 EverEdge Company Details
11.28.2 EverEdge Business Overview
11.28.3 EverEdge Patent Valuation Introduction
11.28.4 EverEdge Revenue in Patent Valuation Business (2020-2025)
11.28.5 EverEdge Recent Development
11.29 Especia
11.29.1 Especia Company Details
11.29.2 Especia Business Overview
11.29.3 Especia Patent Valuation Introduction
11.29.4 Especia Revenue in Patent Valuation Business (2020-2025)
11.29.5 Especia Recent Development
11.30 Redwood
11.30.1 Redwood Company Details
11.30.2 Redwood Business Overview
11.30.3 Redwood Patent Valuation Introduction
11.30.4 Redwood Revenue in Patent Valuation Business (2020-2025)
11.30.5 Redwood Recent Development
11.31 Soquel Group
11.31.1 Soquel Group Company Details
11.31.2 Soquel Group Business Overview
11.31.3 Soquel Group Patent Valuation Introduction
11.31.4 Soquel Group Revenue in Patent Valuation Business (2020-2025)
11.31.5 Soquel Group Recent Development
11.32 Markman Advisors
11.32.1 Markman Advisors Company Details
11.32.2 Markman Advisors Business Overview
11.32.3 Markman Advisors Patent Valuation Introduction
11.32.4 Markman Advisors Revenue in Patent Valuation Business (2020-2025)
11.32.5 Markman Advisors Recent Development
11.33 IEBS
11.33.1 IEBS Company Details
11.33.2 IEBS Business Overview
11.33.3 IEBS Patent Valuation Introduction
11.33.4 IEBS Revenue in Patent Valuation Business (2020-2025)
11.33.5 IEBS Recent Development
11.34 Tee IP
11.34.1 Tee IP Company Details
11.34.2 Tee IP Business Overview
11.34.3 Tee IP Patent Valuation Introduction
11.34.4 Tee IP Revenue in Patent Valuation Business (2020-2025)
11.34.5 Tee IP Recent Development
11.35 IP Wagon
11.35.1 IP Wagon Company Details
11.35.2 IP Wagon Business Overview
11.35.3 IP Wagon Patent Valuation Introduction
11.35.4 IP Wagon Revenue in Patent Valuation Business (2020-2025)
11.35.5 IP Wagon Recent Development
11.36 InnoRes
11.36.1 InnoRes Company Details
11.36.2 InnoRes Business Overview
11.36.3 InnoRes Patent Valuation Introduction
11.36.4 InnoRes Revenue in Patent Valuation Business (2020-2025)
11.36.5 InnoRes Recent Development
12 Analyst's Viewpoints/Conclusions
13 Appendix
13.1 Research Methodology
13.1.1 Methodology/Research Approach
13.1.1.1 Research Programs/Design
13.1.1.2 Market Size Estimation
13.1.1.3 Market Breakdown and Data Triangulation
13.1.2 Data Source
13.1.2.1 Secondary Sources
13.1.2.2 Primary Sources
13.2 Author Details
13.3 Disclaimer
List of Tables
 Table 1. Global Patent Valuation Market Size Growth Rate by Type (US$ Million): 2020 VS 2024 VS 2031
 Table 2. Key Players of Software
 Table 3. Key Players of Service
 Table 4. Global Patent Valuation Market Size Growth by Application (US$ Million): 2020 VS 2024 VS 2031
 Table 5. Global Patent Valuation Market Size by Region (US$ Million): 2020 VS 2024 VS 2031
 Table 6. Global Patent Valuation Market Size by Region (2020-2025) & (US$ Million)
 Table 7. Global Patent Valuation Market Share by Region (2020-2025)
 Table 8. Global Patent Valuation Forecasted Market Size by Region (2026-2031) & (US$ Million)
 Table 9. Global Patent Valuation Market Share by Region (2026-2031)
 Table 10. Patent Valuation Market Trends
 Table 11. Patent Valuation Market Drivers
 Table 12. Patent Valuation Market Challenges
 Table 13. Patent Valuation Market Restraints
 Table 14. Global Patent Valuation Revenue by Players (2020-2025) & (US$ Million)
 Table 15. Global Patent Valuation Market Share by Players (2020-2025)
 Table 16. Global Top Patent Valuation Players by Company Type (Tier 1, Tier 2, and Tier 3) & (based on the Revenue in Patent Valuation as of 2024)
 Table 17. Ranking of Global Top Patent Valuation Companies by Revenue (US$ Million) in 2024
 Table 18. Global 5 Largest Players Market Share by Patent Valuation Revenue (CR5 and HHI) & (2020-2025)
 Table 19. Global Key Players of Patent Valuation, Headquarters and Area Served
 Table 20. Global Key Players of Patent Valuation, Product and Application
 Table 21. Global Key Players of Patent Valuation, Date of Enter into This Industry
 Table 22. Mergers & Acquisitions, Expansion Plans
 Table 23. Global Patent Valuation Market Size by Type (2020-2025) & (US$ Million)
 Table 24. Global Patent Valuation Revenue Market Share by Type (2020-2025)
 Table 25. Global Patent Valuation Forecasted Market Size by Type (2026-2031) & (US$ Million)
 Table 26. Global Patent Valuation Revenue Market Share by Type (2026-2031)
 Table 27. Global Patent Valuation Market Size by Application (2020-2025) & (US$ Million)
 Table 28. Global Patent Valuation Revenue Market Share by Application (2020-2025)
 Table 29. Global Patent Valuation Forecasted Market Size by Application (2026-2031) & (US$ Million)
 Table 30. Global Patent Valuation Revenue Market Share by Application (2026-2031)
 Table 31. North America Patent Valuation Market Size Growth Rate by Country (US$ Million): 2020 VS 2024 VS 2031
 Table 32. North America Patent Valuation Market Size by Country (2020-2025) & (US$ Million)
 Table 33. North America Patent Valuation Market Size by Country (2026-2031) & (US$ Million)
 Table 34. Europe Patent Valuation Market Size Growth Rate by Country (US$ Million): 2020 VS 2024 VS 2031
 Table 35. Europe Patent Valuation Market Size by Country (2020-2025) & (US$ Million)
 Table 36. Europe Patent Valuation Market Size by Country (2026-2031) & (US$ Million)
 Table 37. Asia-Pacific Patent Valuation Market Size Growth Rate by Region (US$ Million): 2020 VS 2024 VS 2031
 Table 38. Asia-Pacific Patent Valuation Market Size by Region (2020-2025) & (US$ Million)
 Table 39. Asia-Pacific Patent Valuation Market Size by Region (2026-2031) & (US$ Million)
 Table 40. Latin America Patent Valuation Market Size Growth Rate by Country (US$ Million): 2020 VS 2024 VS 2031
 Table 41. Latin America Patent Valuation Market Size by Country (2020-2025) & (US$ Million)
 Table 42. Latin America Patent Valuation Market Size by Country (2026-2031) & (US$ Million)
 Table 43. Middle East & Africa Patent Valuation Market Size Growth Rate by Country (US$ Million): 2020 VS 2024 VS 2031
 Table 44. Middle East & Africa Patent Valuation Market Size by Country (2020-2025) & (US$ Million)
 Table 45. Middle East & Africa Patent Valuation Market Size by Country (2026-2031) & (US$ Million)
 Table 46. InTraCoM Company Details
 Table 47. InTraCoM Business Overview
 Table 48. InTraCoM Patent Valuation Product
 Table 49. InTraCoM Revenue in Patent Valuation Business (2020-2025) & (US$ Million)
 Table 50. InTraCoM Recent Development
 Table 51. ktMINE Company Details
 Table 52. ktMINE Business Overview
 Table 53. ktMINE Patent Valuation Product
 Table 54. ktMINE Revenue in Patent Valuation Business (2020-2025) & (US$ Million)
 Table 55. ktMINE Recent Development
 Table 56. Toolip Company Details
 Table 57. Toolip Business Overview
 Table 58. Toolip Patent Valuation Product
 Table 59. Toolip Revenue in Patent Valuation Business (2020-2025) & (US$ Million)
 Table 60. Toolip Recent Development
 Table 61. Ocean Tomo Company Details
 Table 62. Ocean Tomo Business Overview
 Table 63. Ocean Tomo Patent Valuation Product
 Table 64. Ocean Tomo Revenue in Patent Valuation Business (2020-2025) & (US$ Million)
 Table 65. Ocean Tomo Recent Development
 Table 66. Ingot Company Details
 Table 67. Ingot Business Overview
 Table 68. Ingot Patent Valuation Product
 Table 69. Ingot Revenue in Patent Valuation Business (2020-2025) & (US$ Million)
 Table 70. Ingot Recent Development
 Table 71. PatSnap Company Details
 Table 72. PatSnap Business Overview
 Table 73. PatSnap Patent Valuation Product
 Table 74. PatSnap Revenue in Patent Valuation Business (2020-2025) & (US$ Million)
 Table 75. PatSnap Recent Development
 Table 76. Clarivate Company Details
 Table 77. Clarivate Business Overview
 Table 78. Clarivate Patent Valuation Product
 Table 79. Clarivate Revenue in Patent Valuation Business (2020-2025) & (US$ Million)
 Table 80. Clarivate Recent Development
 Table 81. Brandon IP Company Details
 Table 82. Brandon IP Business Overview
 Table 83. Brandon IP Patent Valuation Product
 Table 84. Brandon IP Revenue in Patent Valuation Business (2020-2025) & (US$ Million)
 Table 85. Brandon IP Recent Development
 Table 86. Dennemeyer Company Details
 Table 87. Dennemeyer Business Overview
 Table 88. Dennemeyer Patent Valuation Product
 Table 89. Dennemeyer Revenue in Patent Valuation Business (2020-2025) & (US$ Million)
 Table 90. Dennemeyer Recent Development
 Table 91. GHB Intellect Company Details
 Table 92. GHB Intellect Business Overview
 Table 93. GHB Intellect Patent Valuation Product
 Table 94. GHB Intellect Revenue in Patent Valuation Business (2020-2025) & (US$ Million)
 Table 95. GHB Intellect Recent Development
 Table 96. BaxterIP Company Details
 Table 97. BaxterIP Business Overview
 Table 98. BaxterIP Patent Valuation Product
 Table 99. BaxterIP Revenue in Patent Valuation Business (2020-2025) & (US$ Million)
 Table 100. BaxterIP Recent Development
 Table 101. Pellegrino Associates Company Details
 Table 102. Pellegrino Associates Business Overview
 Table 103. Pellegrino Associates Patent Valuation Product
 Table 104. Pellegrino Associates Revenue in Patent Valuation Business (2020-2025) & (US$ Million)
 Table 105. Pellegrino Associates Recent Development
 Table 106. PatSeer Company Details
 Table 107. PatSeer Business Overview
 Table 108. PatSeer Patent Valuation Product
 Table 109. PatSeer Revenue in Patent Valuation Business (2020-2025) & (US$ Million)
 Table 110. PatSeer Recent Development
 Table 111. May Figures Ltd Company Details
 Table 112. May Figures Ltd Business Overview
 Table 113. May Figures Ltd Patent Valuation Product
 Table 114. May Figures Ltd Revenue in Patent Valuation Business (2020-2025) & (US$ Million)
 Table 115. May Figures Ltd Recent Development
 Table 116. Leadenhall Company Details
 Table 117. Leadenhall Business Overview
 Table 118. Leadenhall Patent Valuation Product
 Table 119. Leadenhall Revenue in Patent Valuation Business (2020-2025) & (US$ Million)
 Table 120. Leadenhall Recent Development
 Table 121. TransactionsIP Company Details
 Table 122. TransactionsIP Business Overview
 Table 123. TransactionsIP Patent Valuation Product
 Table 124. TransactionsIP Revenue in Patent Valuation Business (2020-2025) & (US$ Million)
 Table 125. TransactionsIP Recent Development
 Table 126. Nevium Company Details
 Table 127. Nevium Business Overview
 Table 128. Nevium Patent Valuation Product
 Table 129. Nevium Revenue in Patent Valuation Business (2020-2025) & (US$ Million)
 Table 130. Nevium Recent Development
 Table 131. Kroll Company Details
 Table 132. Kroll Business Overview
 Table 133. Kroll Patent Valuation Product
 Table 134. Kroll Revenue in Patent Valuation Business (2020-2025) & (US$ Million)
 Table 135. Kroll Recent Development
 Table 136. Metis Partners Company Details
 Table 137. Metis Partners Business Overview
 Table 138. Metis Partners Patent Valuation Product
 Table 139. Metis Partners Revenue in Patent Valuation Business (2020-2025) & (US$ Million)
 Table 140. Metis Partners Recent Development
 Table 141. IPOfferings Company Details
 Table 142. IPOfferings Business Overview
 Table 143. IPOfferings Patent Valuation Product
 Table 144. IPOfferings Revenue in Patent Valuation Business (2020-2025) & (US$ Million)
 Table 145. IPOfferings Recent Development
 Table 146. Excelon IP Company Details
 Table 147. Excelon IP Business Overview
 Table 148. Excelon IP Patent Valuation Product
 Table 149. Excelon IP Revenue in Patent Valuation Business (2020-2025) & (US$ Million)
 Table 150. Excelon IP Recent Development
 Table 151. Sagacious IP Company Details
 Table 152. Sagacious IP Business Overview
 Table 153. Sagacious IP Patent Valuation Product
 Table 154. Sagacious IP Revenue in Patent Valuation Business (2020-2025) & (US$ Million)
 Table 155. Sagacious IP Recent Development
 Table 156. Aranca Company Details
 Table 157. Aranca Business Overview
 Table 158. Aranca Patent Valuation Product
 Table 159. Aranca Revenue in Patent Valuation Business (2020-2025) & (US$ Million)
 Table 160. Aranca Recent Development
 Table 161. OxFirst Company Details
 Table 162. OxFirst Business Overview
 Table 163. OxFirst Patent Valuation Product
 Table 164. OxFirst Revenue in Patent Valuation Business (2020-2025) & (US$ Million)
 Table 165. OxFirst Recent Development
 Table 166. Valueteam Company Details
 Table 167. Valueteam Business Overview
 Table 168. Valueteam Patent Valuation Product
 Table 169. Valueteam Revenue in Patent Valuation Business (2020-2025) & (US$ Million)
 Table 170. Valueteam Recent Development
 Table 171. Deloitte Company Details
 Table 172. Deloitte Business Overview
 Table 173. Deloitte Patent Valuation Product
 Table 174. Deloitte Revenue in Patent Valuation Business (2020-2025) & (US$ Million)
 Table 175. Deloitte Recent Development
 Table 176. Right Reality Company Details
 Table 177. Right Reality Business Overview
 Table 178. Right Reality Patent Valuation Product
 Table 179. Right Reality Revenue in Patent Valuation Business (2020-2025) & (US$ Million)
 Table 180. Right Reality Recent Development
 Table 181. EverEdge Company Details
 Table 182. EverEdge Business Overview
 Table 183. EverEdge Patent Valuation Product
 Table 184. EverEdge Revenue in Patent Valuation Business (2020-2025) & (US$ Million)
 Table 185. EverEdge Recent Development
 Table 186. Especia Company Details
 Table 187. Especia Business Overview
 Table 188. Especia Patent Valuation Product
 Table 189. Especia Revenue in Patent Valuation Business (2020-2025) & (US$ Million)
 Table 190. Especia Recent Development
 Table 191. Redwood Company Details
 Table 192. Redwood Business Overview
 Table 193. Redwood Patent Valuation Product
 Table 194. Redwood Revenue in Patent Valuation Business (2020-2025) & (US$ Million)
 Table 195. Redwood Recent Development
 Table 196. Soquel Group Company Details
 Table 197. Soquel Group Business Overview
 Table 198. Soquel Group Patent Valuation Product
 Table 199. Soquel Group Revenue in Patent Valuation Business (2020-2025) & (US$ Million)
 Table 200. Soquel Group Recent Development
 Table 201. Markman Advisors Company Details
 Table 202. Markman Advisors Business Overview
 Table 203. Markman Advisors Patent Valuation Product
 Table 204. Markman Advisors Revenue in Patent Valuation Business (2020-2025) & (US$ Million)
 Table 205. Markman Advisors Recent Development
 Table 206. IEBS Company Details
 Table 207. IEBS Business Overview
 Table 208. IEBS Patent Valuation Product
 Table 209. IEBS Revenue in Patent Valuation Business (2020-2025) & (US$ Million)
 Table 210. IEBS Recent Development
 Table 211. Tee IP Company Details
 Table 212. Tee IP Business Overview
 Table 213. Tee IP Patent Valuation Product
 Table 214. Tee IP Revenue in Patent Valuation Business (2020-2025) & (US$ Million)
 Table 215. Tee IP Recent Development
 Table 216. IP Wagon Company Details
 Table 217. IP Wagon Business Overview
 Table 218. IP Wagon Patent Valuation Product
 Table 219. IP Wagon Revenue in Patent Valuation Business (2020-2025) & (US$ Million)
 Table 220. IP Wagon Recent Development
 Table 221. InnoRes Company Details
 Table 222. InnoRes Business Overview
 Table 223. InnoRes Patent Valuation Product
 Table 224. InnoRes Revenue in Patent Valuation Business (2020-2025) & (US$ Million)
 Table 225. InnoRes Recent Development
 Table 226. Research Programs/Design for This Report
 Table 227. Key Data Information from Secondary Sources
 Table 228. Key Data Information from Primary Sources
 Table 229. Authors List of This Report


List of Figures
 Figure 1. Patent Valuation Picture
 Figure 2. Global Patent Valuation Market Size Comparison by Type (2020-2031) & (US$ Million)
 Figure 3. Global Patent Valuation Market Share by Type: 2024 VS 2031
 Figure 4. Software Features
 Figure 5. Service Features
 Figure 6. Global Patent Valuation Market Size by Application (2020-2031) & (US$ Million)
 Figure 7. Global Patent Valuation Market Share by Application: 2024 VS 2031
 Figure 8. Personal Case Studies
 Figure 9. Enterprise Case Studies
 Figure 10. Research Institute Case Studies
 Figure 11. Patent Valuation Report Years Considered
 Figure 12. Global Patent Valuation Market Size (US$ Million), Year-over-Year: 2020-2031
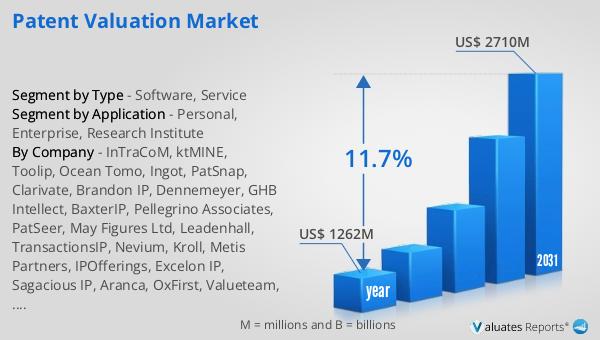
 Figure 13. Global Patent Valuation Market Size, (US$ Million), 2020 VS 2024 VS 2031
 Figure 14. Global Patent Valuation Market Share by Region: 2024 VS 2031
 Figure 15. Global Patent Valuation Market Share by Players in 2024
 Figure 16. Global Top Patent Valuation Players by Company Type (Tier 1, Tier 2, and Tier 3) & (based on the Revenue in Patent Valuation as of 2024)
 Figure 17. The Top 10 and 5 Players Market Share by Patent Valuation Revenue in 2024
 Figure 18. North America Patent Valuation Market Size YoY Growth (2020-2031) & (US$ Million)
 Figure 19. North America Patent Valuation Market Share by Country (2020-2031)
 Figure 20. United States Patent Valuation Market Size YoY Growth (2020-2031) & (US$ Million)
 Figure 21. Canada Patent Valuation Market Size YoY Growth (2020-2031) & (US$ Million)
 Figure 22. Europe Patent Valuation Market Size YoY Growth (2020-2031) & (US$ Million)
 Figure 23. Europe Patent Valuation Market Share by Country (2020-2031)
 Figure 24. Germany Patent Valuation Market Size YoY Growth (2020-2031) & (US$ Million)
 Figure 25. France Patent Valuation Market Size YoY Growth (2020-2031) & (US$ Million)
 Figure 26. U.K. Patent Valuation Market Size YoY Growth (2020-2031) & (US$ Million)
 Figure 27. Italy Patent Valuation Market Size YoY Growth (2020-2031) & (US$ Million)
 Figure 28. Russia Patent Valuation Market Size YoY Growth (2020-2031) & (US$ Million)
 Figure 29. Nordic Countries Patent Valuation Market Size YoY Growth (2020-2031) & (US$ Million)
 Figure 30. Asia-Pacific Patent Valuation Market Size YoY Growth (2020-2031) & (US$ Million)
 Figure 31. Asia-Pacific Patent Valuation Market Share by Region (2020-2031)
 Figure 32. China Patent Valuation Market Size YoY Growth (2020-2031) & (US$ Million)
 Figure 33. Japan Patent Valuation Market Size YoY Growth (2020-2031) & (US$ Million)
 Figure 34. South Korea Patent Valuation Market Size YoY Growth (2020-2031) & (US$ Million)
 Figure 35. Southeast Asia Patent Valuation Market Size YoY Growth (2020-2031) & (US$ Million)
 Figure 36. India Patent Valuation Market Size YoY Growth (2020-2031) & (US$ Million)
 Figure 37. Australia Patent Valuation Market Size YoY Growth (2020-2031) & (US$ Million)
 Figure 38. Latin America Patent Valuation Market Size YoY Growth (2020-2031) & (US$ Million)
 Figure 39. Latin America Patent Valuation Market Share by Country (2020-2031)
 Figure 40. Mexico Patent Valuation Market Size YoY Growth (2020-2031) & (US$ Million)
 Figure 41. Brazil Patent Valuation Market Size YoY Growth (2020-2031) & (US$ Million)
 Figure 42. Middle East & Africa Patent Valuation Market Size YoY Growth (2020-2031) & (US$ Million)
 Figure 43. Middle East & Africa Patent Valuation Market Share by Country (2020-2031)
 Figure 44. Turkey Patent Valuation Market Size YoY Growth (2020-2031) & (US$ Million)
 Figure 45. Saudi Arabia Patent Valuation Market Size YoY Growth (2020-2031) & (US$ Million)
 Figure 46. UAE Patent Valuation Market Size YoY Growth (2020-2031) & (US$ Million)
 Figure 47. InTraCoM Revenue Growth Rate in Patent Valuation Business (2020-2025)
 Figure 48. ktMINE Revenue Growth Rate in Patent Valuation Business (2020-2025)
 Figure 49. Toolip Revenue Growth Rate in Patent Valuation Business (2020-2025)
 Figure 50. Ocean Tomo Revenue Growth Rate in Patent Valuation Business (2020-2025)
 Figure 51. Ingot Revenue Growth Rate in Patent Valuation Business (2020-2025)
 Figure 52. PatSnap Revenue Growth Rate in Patent Valuation Business (2020-2025)
 Figure 53. Clarivate Revenue Growth Rate in Patent Valuation Business (2020-2025)
 Figure 54. Brandon IP Revenue Growth Rate in Patent Valuation Business (2020-2025)
 Figure 55. Dennemeyer Revenue Growth Rate in Patent Valuation Business (2020-2025)
 Figure 56. GHB Intellect Revenue Growth Rate in Patent Valuation Business (2020-2025)
 Figure 57. BaxterIP Revenue Growth Rate in Patent Valuation Business (2020-2025)
 Figure 58. Pellegrino Associates Revenue Growth Rate in Patent Valuation Business (2020-2025)
 Figure 59. PatSeer Revenue Growth Rate in Patent Valuation Business (2020-2025)
 Figure 60. May Figures Ltd Revenue Growth Rate in Patent Valuation Business (2020-2025)
 Figure 61. Leadenhall Revenue Growth Rate in Patent Valuation Business (2020-2025)
 Figure 62. TransactionsIP Revenue Growth Rate in Patent Valuation Business (2020-2025)
 Figure 63. Nevium Revenue Growth Rate in Patent Valuation Business (2020-2025)
 Figure 64. Kroll Revenue Growth Rate in Patent Valuation Business (2020-2025)
 Figure 65. Metis Partners Revenue Growth Rate in Patent Valuation Business (2020-2025)
 Figure 66. IPOfferings Revenue Growth Rate in Patent Valuation Business (2020-2025)
 Figure 67. Excelon IP Revenue Growth Rate in Patent Valuation Business (2020-2025)
 Figure 68. Sagacious IP Revenue Growth Rate in Patent Valuation Business (2020-2025)
 Figure 69. Aranca Revenue Growth Rate in Patent Valuation Business (2020-2025)
 Figure 70. OxFirst Revenue Growth Rate in Patent Valuation Business (2020-2025)
 Figure 71. Valueteam Revenue Growth Rate in Patent Valuation Business (2020-2025)
 Figure 72. Deloitte Revenue Growth Rate in Patent Valuation Business (2020-2025)
 Figure 73. Right Reality Revenue Growth Rate in Patent Valuation Business (2020-2025)
 Figure 74. EverEdge Revenue Growth Rate in Patent Valuation Business (2020-2025)
 Figure 75. Especia Revenue Growth Rate in Patent Valuation Business (2020-2025)
 Figure 76. Redwood Revenue Growth Rate in Patent Valuation Business (2020-2025)
 Figure 77. Soquel Group Revenue Growth Rate in Patent Valuation Business (2020-2025)
 Figure 78. Markman Advisors Revenue Growth Rate in Patent Valuation Business (2020-2025)
 Figure 79. IEBS Revenue Growth Rate in Patent Valuation Business (2020-2025)
 Figure 80. Tee IP Revenue Growth Rate in Patent Valuation Business (2020-2025)
 Figure 81. IP Wagon Revenue Growth Rate in Patent Valuation Business (2020-2025)
 Figure 82. InnoRes Revenue Growth Rate in Patent Valuation Business (2020-2025)
 Figure 83. Bottom-up and Top-down Approaches for This Report
 Figure 84. Data Triangulation
 Figure 85. Key Executives Interviewed
SELECT A FORMAT
Added to Cart
Electronic (PDF)

$2900

This license allows only one user to access the PDF.
Electronic (PDF)

$4350

This license allows 1 - 5 user to access the PDF, license is suitable for small groups of 5 users working together
Electronic (PDF)

$5800

This license allows users/teams in a same Enterprise to use this report, various departments within an enterpise can use this report
Add to Cart
Buy Now (15% Discount)

OUR CUSTOMER

Seventh Sense AI

RELATED REPORTS

Global Physical Intellectual Property Market Research Report 2025

120 Pages
Type: Report
Code: QYRE-Auto-29O2868
Thu Sep 11 00:00:00 UTC 2025

Add to Cart

Global Lawyer Liability Insurance Market Research Report 2025

120 Pages
Type: Report
Code: QYRE-Auto-19V4125
Thu Sep 11 00:00:00 UTC 2025

Add to Cart

Global Intellectual Property Rights & Royalty Management Market Research Report 2025

120 Pages
Type: Report
Code: QYRE-Auto-26K1668
Wed Sep 10 00:00:00 UTC 2025

Add to Cart

Global Legal Document Preparation Services Market Research Report 2025

120 Pages
Type: Report
Code: QYRE-Auto-27Q19481
Tue Sep 09 00:00:00 UTC 2025

Add to Cart