List of Tables
Table 1. Global Water Quality Testing Service Market Size Growth Rate by Type (US$ Million): 2020 VS 2024 VS 2031
Table 2. Key Players of Physical Test
Table 3. Key Players of Chemical Test
Table 4. Key Players of Microbiological Test
Table 5. Global Water Quality Testing Service Market Size Growth Rate by Technology (US$ Million): 2020 VS 2024 VS 2031
Table 6. Key Players of On-site Testing
Table 7. Key Players of Laboratory Testing
Table 8. Global Water Quality Testing Service Market Size Growth Rate by User (US$ Million): 2020 VS 2024 VS 2031
Table 9. Key Players of Government
Table 10. Key Players of Enterprises
Table 11. Key Players of Others
Table 12. Global Water Quality Testing Service Market Size Growth by Application (US$ Million): 2020 VS 2024 VS 2031
Table 13. Global Water Quality Testing Service Market Size by Region (US$ Million): 2020 VS 2024 VS 2031
Table 14. Global Water Quality Testing Service Market Size by Region (2020-2025) & (US$ Million)
Table 15. Global Water Quality Testing Service Market Share by Region (2020-2025)
Table 16. Global Water Quality Testing Service Forecasted Market Size by Region (2026-2031) & (US$ Million)
Table 17. Global Water Quality Testing Service Market Share by Region (2026-2031)
Table 18. Water Quality Testing Service Market Trends
Table 19. Water Quality Testing Service Market Drivers
Table 20. Water Quality Testing Service Market Challenges
Table 21. Water Quality Testing Service Market Restraints
Table 22. Global Water Quality Testing Service Revenue by Players (2020-2025) & (US$ Million)
Table 23. Global Water Quality Testing Service Market Share by Players (2020-2025)
Table 24. Global Top Water Quality Testing Service Players by Company Type (Tier 1, Tier 2, and Tier 3) & (based on the Revenue in Water Quality Testing Service as of 2024)
Table 25. Ranking of Global Top Water Quality Testing Service Companies by Revenue (US$ Million) in 2024
Table 26. Global 5 Largest Players Market Share by Water Quality Testing Service Revenue (CR5 and HHI) & (2020-2025)
Table 27. Global Key Players of Water Quality Testing Service, Headquarters and Area Served
Table 28. Global Key Players of Water Quality Testing Service, Product and Application
Table 29. Global Key Players of Water Quality Testing Service, Date of Enter into This Industry
Table 30. Mergers & Acquisitions, Expansion Plans
Table 31. Global Water Quality Testing Service Market Size by Type (2020-2025) & (US$ Million)
Table 32. Global Water Quality Testing Service Revenue Market Share by Type (2020-2025)
Table 33. Global Water Quality Testing Service Forecasted Market Size by Type (2026-2031) & (US$ Million)
Table 34. Global Water Quality Testing Service Revenue Market Share by Type (2026-2031)
Table 35. Global Water Quality Testing Service Market Size by Application (2020-2025) & (US$ Million)
Table 36. Global Water Quality Testing Service Revenue Market Share by Application (2020-2025)
Table 37. Global Water Quality Testing Service Forecasted Market Size by Application (2026-2031) & (US$ Million)
Table 38. Global Water Quality Testing Service Revenue Market Share by Application (2026-2031)
Table 39. North America Water Quality Testing Service Market Size Growth Rate by Country (US$ Million): 2020 VS 2024 VS 2031
Table 40. North America Water Quality Testing Service Market Size by Country (2020-2025) & (US$ Million)
Table 41. North America Water Quality Testing Service Market Size by Country (2026-2031) & (US$ Million)
Table 42. Europe Water Quality Testing Service Market Size Growth Rate by Country (US$ Million): 2020 VS 2024 VS 2031
Table 43. Europe Water Quality Testing Service Market Size by Country (2020-2025) & (US$ Million)
Table 44. Europe Water Quality Testing Service Market Size by Country (2026-2031) & (US$ Million)
Table 45. Asia-Pacific Water Quality Testing Service Market Size Growth Rate by Region (US$ Million): 2020 VS 2024 VS 2031
Table 46. Asia-Pacific Water Quality Testing Service Market Size by Region (2020-2025) & (US$ Million)
Table 47. Asia-Pacific Water Quality Testing Service Market Size by Region (2026-2031) & (US$ Million)
Table 48. Latin America Water Quality Testing Service Market Size Growth Rate by Country (US$ Million): 2020 VS 2024 VS 2031
Table 49. Latin America Water Quality Testing Service Market Size by Country (2020-2025) & (US$ Million)
Table 50. Latin America Water Quality Testing Service Market Size by Country (2026-2031) & (US$ Million)
Table 51. Middle East & Africa Water Quality Testing Service Market Size Growth Rate by Country (US$ Million): 2020 VS 2024 VS 2031
Table 52. Middle East & Africa Water Quality Testing Service Market Size by Country (2020-2025) & (US$ Million)
Table 53. Middle East & Africa Water Quality Testing Service Market Size by Country (2026-2031) & (US$ Million)
Table 54. SGS Company Details
Table 55. SGS Business Overview
Table 56. SGS Water Quality Testing Service Product
Table 57. SGS Revenue in Water Quality Testing Service Business (2020-2025) & (US$ Million)
Table 58. SGS Recent Development
Table 59. ALS Global Company Details
Table 60. ALS Global Business Overview
Table 61. ALS Global Water Quality Testing Service Product
Table 62. ALS Global Revenue in Water Quality Testing Service Business (2020-2025) & (US$ Million)
Table 63. ALS Global Recent Development
Table 64. TÜV SÜD Company Details
Table 65. TÜV SÜD Business Overview
Table 66. TÜV SÜD Water Quality Testing Service Product
Table 67. TÜV SÜD Revenue in Water Quality Testing Service Business (2020-2025) & (US$ Million)
Table 68. TÜV SÜD Recent Development
Table 69. Eurofins Scientific Company Details
Table 70. Eurofins Scientific Business Overview
Table 71. Eurofins Scientific Water Quality Testing Service Product
Table 72. Eurofins Scientific Revenue in Water Quality Testing Service Business (2020-2025) & (US$ Million)
Table 73. Eurofins Scientific Recent Development
Table 74. Intertek Company Details
Table 75. Intertek Business Overview
Table 76. Intertek Water Quality Testing Service Product
Table 77. Intertek Revenue in Water Quality Testing Service Business (2020-2025) & (US$ Million)
Table 78. Intertek Recent Development
Table 79. DEKRA Company Details
Table 80. DEKRA Business Overview
Table 81. DEKRA Water Quality Testing Service Product
Table 82. DEKRA Revenue in Water Quality Testing Service Business (2020-2025) & (US$ Million)
Table 83. DEKRA Recent Development
Table 84. Underwriters Laboratories Company Details
Table 85. Underwriters Laboratories Business Overview
Table 86. Underwriters Laboratories Water Quality Testing Service Product
Table 87. Underwriters Laboratories Revenue in Water Quality Testing Service Business (2020-2025) & (US$ Million)
Table 88. Underwriters Laboratories Recent Development
Table 89. Pace Analytical Services Company Details
Table 90. Pace Analytical Services Business Overview
Table 91. Pace Analytical Services Water Quality Testing Service Product
Table 92. Pace Analytical Services Revenue in Water Quality Testing Service Business (2020-2025) & (US$ Million)
Table 93. Pace Analytical Services Recent Development
Table 94. Element Company Details
Table 95. Element Business Overview
Table 96. Element Water Quality Testing Service Product
Table 97. Element Revenue in Water Quality Testing Service Business (2020-2025) & (US$ Million)
Table 98. Element Recent Development
Table 99. Bureau Veritas Company Details
Table 100. Bureau Veritas Business Overview
Table 101. Bureau Veritas Water Quality Testing Service Product
Table 102. Bureau Veritas Revenue in Water Quality Testing Service Business (2020-2025) & (US$ Million)
Table 103. Bureau Veritas Recent Development
Table 104. NSF International Company Details
Table 105. NSF International Business Overview
Table 106. NSF International Water Quality Testing Service Product
Table 107. NSF International Revenue in Water Quality Testing Service Business (2020-2025) & (US$ Million)
Table 108. NSF International Recent Development
Table 109. Enthalpy Analytical Company Details
Table 110. Enthalpy Analytical Business Overview
Table 111. Enthalpy Analytical Water Quality Testing Service Product
Table 112. Enthalpy Analytical Revenue in Water Quality Testing Service Business (2020-2025) & (US$ Million)
Table 113. Enthalpy Analytical Recent Development
Table 114. Applus+ Laboratories Company Details
Table 115. Applus+ Laboratories Business Overview
Table 116. Applus+ Laboratories Water Quality Testing Service Product
Table 117. Applus+ Laboratories Revenue in Water Quality Testing Service Business (2020-2025) & (US$ Million)
Table 118. Applus+ Laboratories Recent Development
Table 119. AGROLAB GROUP Company Details
Table 120. AGROLAB GROUP Business Overview
Table 121. AGROLAB GROUP Water Quality Testing Service Product
Table 122. AGROLAB GROUP Revenue in Water Quality Testing Service Business (2020-2025) & (US$ Million)
Table 123. AGROLAB GROUP Recent Development
Table 124. Feedwater Ltd Company Details
Table 125. Feedwater Ltd Business Overview
Table 126. Feedwater Ltd Water Quality Testing Service Product
Table 127. Feedwater Ltd Revenue in Water Quality Testing Service Business (2020-2025) & (US$ Million)
Table 128. Feedwater Ltd Recent Development
Table 129. Simplex Health Company Details
Table 130. Simplex Health Business Overview
Table 131. Simplex Health Water Quality Testing Service Product
Table 132. Simplex Health Revenue in Water Quality Testing Service Business (2020-2025) & (US$ Million)
Table 133. Simplex Health Recent Development
Table 134. Suez Company Details
Table 135. Suez Business Overview
Table 136. Suez Water Quality Testing Service Product
Table 137. Suez Revenue in Water Quality Testing Service Business (2020-2025) & (US$ Million)
Table 138. Suez Recent Development
Table 139. Research Programs/Design for This Report
Table 140. Key Data Information from Secondary Sources
Table 141. Key Data Information from Primary Sources
Table 142. Authors List of This Report
List of Figures
Figure 1. Water Quality Testing Service Picture
Figure 2. Global Water Quality Testing Service Market Size Comparison by Type (2020-2031) & (US$ Million)
Figure 3. Global Water Quality Testing Service Market Share by Type: 2024 VS 2031
Figure 4. Physical Test Features
Figure 5. Chemical Test Features
Figure 6. Microbiological Test Features
Figure 7. Global Water Quality Testing Service Market Size Comparison by Technology (2020-2031) & (US$ Million)
Figure 8. On-site Testing Features
Figure 9. Laboratory Testing Features
Figure 10. Global Water Quality Testing Service Market Size Comparison by User (2020-2031) & (US$ Million)
Figure 11. Government Features
Figure 12. Enterprises Features
Figure 13. Others Features
Figure 14. Global Water Quality Testing Service Market Size by Application (2020-2031) & (US$ Million)
Figure 15. Global Water Quality Testing Service Market Share by Application: 2024 VS 2031
Figure 16. Industrial Case Studies
Figure 17. Family Case Studies
Figure 18. Natural Environment Case Studies
Figure 19. Swimming Pool Case Studies
Figure 20. Others Case Studies
Figure 21. Water Quality Testing Service Report Years Considered
Figure 22. Global Water Quality Testing Service Market Size (US$ Million), Year-over-Year: 2020-2031
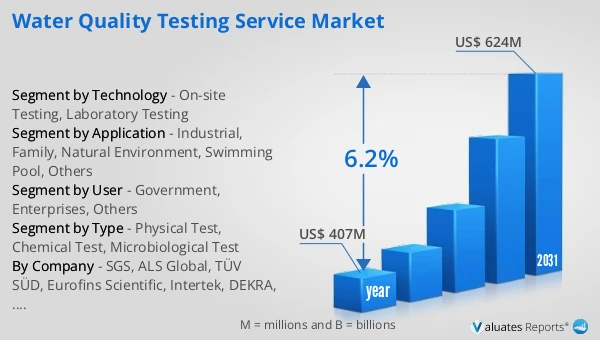
Figure 23. Global Water Quality Testing Service Market Size, (US$ Million), 2020 VS 2024 VS 2031
Figure 24. Global Water Quality Testing Service Market Share by Region: 2024 VS 2031
Figure 25. Global Water Quality Testing Service Market Share by Players in 2024
Figure 26. Global Water Quality Testing Service Market Share by Company Type (Tier 1, Tier 2, and Tier 3)
Figure 27. The Top 10 and 5 Players Market Share by Water Quality Testing Service Revenue in 2024
Figure 28. North America Water Quality Testing Service Market Size YoY Growth (2020-2031) & (US$ Million)
Figure 29. North America Water Quality Testing Service Market Share by Country (2020-2031)
Figure 30. United States Water Quality Testing Service Market Size YoY Growth (2020-2031) & (US$ Million)
Figure 31. Canada Water Quality Testing Service Market Size YoY Growth (2020-2031) & (US$ Million)
Figure 32. Europe Water Quality Testing Service Market Size YoY Growth (2020-2031) & (US$ Million)
Figure 33. Europe Water Quality Testing Service Market Share by Country (2020-2031)
Figure 34. Germany Water Quality Testing Service Market Size YoY Growth (2020-2031) & (US$ Million)
Figure 35. France Water Quality Testing Service Market Size YoY Growth (2020-2031) & (US$ Million)
Figure 36. U.K. Water Quality Testing Service Market Size YoY Growth (2020-2031) & (US$ Million)
Figure 37. Italy Water Quality Testing Service Market Size YoY Growth (2020-2031) & (US$ Million)
Figure 38. Russia Water Quality Testing Service Market Size YoY Growth (2020-2031) & (US$ Million)
Figure 39. Ireland Water Quality Testing Service Market Size YoY Growth (2020-2031) & (US$ Million)
Figure 40. Asia-Pacific Water Quality Testing Service Market Size YoY Growth (2020-2031) & (US$ Million)
Figure 41. Asia-Pacific Water Quality Testing Service Market Share by Region (2020-2031)
Figure 42. China Water Quality Testing Service Market Size YoY Growth (2020-2031) & (US$ Million)
Figure 43. Japan Water Quality Testing Service Market Size YoY Growth (2020-2031) & (US$ Million)
Figure 44. South Korea Water Quality Testing Service Market Size YoY Growth (2020-2031) & (US$ Million)
Figure 45. Southeast Asia Water Quality Testing Service Market Size YoY Growth (2020-2031) & (US$ Million)
Figure 46. India Water Quality Testing Service Market Size YoY Growth (2020-2031) & (US$ Million)
Figure 47. Australia & New Zealand Water Quality Testing Service Market Size YoY Growth (2020-2031) & (US$ Million)
Figure 48. Latin America Water Quality Testing Service Market Size YoY Growth (2020-2031) & (US$ Million)
Figure 49. Latin America Water Quality Testing Service Market Share by Country (2020-2031)
Figure 50. Mexico Water Quality Testing Service Market Size YoY Growth (2020-2031) & (US$ Million)
Figure 51. Brazil Water Quality Testing Service Market Size YoY Growth (2020-2031) & (US$ Million)
Figure 52. Middle East & Africa Water Quality Testing Service Market Size YoY Growth (2020-2031) & (US$ Million)
Figure 53. Middle East & Africa Water Quality Testing Service Market Share by Country (2020-2031)
Figure 54. Israel Water Quality Testing Service Market Size YoY Growth (2020-2031) & (US$ Million)
Figure 55. Saudi Arabia Water Quality Testing Service Market Size YoY Growth (2020-2031) & (US$ Million)
Figure 56. UAE Water Quality Testing Service Market Size YoY Growth (2020-2031) & (US$ Million)
Figure 57. SGS Revenue Growth Rate in Water Quality Testing Service Business (2020-2025)
Figure 58. ALS Global Revenue Growth Rate in Water Quality Testing Service Business (2020-2025)
Figure 59. TÜV SÜD Revenue Growth Rate in Water Quality Testing Service Business (2020-2025)
Figure 60. Eurofins Scientific Revenue Growth Rate in Water Quality Testing Service Business (2020-2025)
Figure 61. Intertek Revenue Growth Rate in Water Quality Testing Service Business (2020-2025)
Figure 62. DEKRA Revenue Growth Rate in Water Quality Testing Service Business (2020-2025)
Figure 63. Underwriters Laboratories Revenue Growth Rate in Water Quality Testing Service Business (2020-2025)
Figure 64. Pace Analytical Services Revenue Growth Rate in Water Quality Testing Service Business (2020-2025)
Figure 65. Element Revenue Growth Rate in Water Quality Testing Service Business (2020-2025)
Figure 66. Bureau Veritas Revenue Growth Rate in Water Quality Testing Service Business (2020-2025)
Figure 67. NSF International Revenue Growth Rate in Water Quality Testing Service Business (2020-2025)
Figure 68. Enthalpy Analytical Revenue Growth Rate in Water Quality Testing Service Business (2020-2025)
Figure 69. Applus+ Laboratories Revenue Growth Rate in Water Quality Testing Service Business (2020-2025)
Figure 70. AGROLAB GROUP Revenue Growth Rate in Water Quality Testing Service Business (2020-2025)
Figure 71. Feedwater Ltd Revenue Growth Rate in Water Quality Testing Service Business (2020-2025)
Figure 72. Simplex Health Revenue Growth Rate in Water Quality Testing Service Business (2020-2025)
Figure 73. Suez Revenue Growth Rate in Water Quality Testing Service Business (2020-2025)
Figure 74. Bottom-up and Top-down Approaches for This Report
Figure 75. Data Triangulation
Figure 76. Key Executives Interviewed