List of Tables
Table 1. Global Mid-Infrared Hollow Core Anti-Resonant Fiber Market Value by Core Diameter, (US$ Million) & (2022 VS 2029)
Table 2. Global Mid-Infrared Hollow Core Anti-Resonant Fiber Market Value by Application, (US$ Million) & (2022 VS 2029)
Table 3. Global Mid-Infrared Hollow Core Anti-Resonant Fiber Production Capacity (Km) by Manufacturers in 2022
Table 4. Global Mid-Infrared Hollow Core Anti-Resonant Fiber Production by Manufacturers (2018-2023) & (Km)
Table 5. Global Mid-Infrared Hollow Core Anti-Resonant Fiber Production Market Share by Manufacturers (2018-2023)
Table 6. Global Mid-Infrared Hollow Core Anti-Resonant Fiber Production Value by Manufacturers (2018-2023) & (US$ Million)
Table 7. Global Mid-Infrared Hollow Core Anti-Resonant Fiber Production Value Share by Manufacturers (2018-2023)
Table 8. Global Mid-Infrared Hollow Core Anti-Resonant Fiber Industry Ranking 2021 VS 2022 VS 2023
Table 9. Company Type (Tier 1, Tier 2 and Tier 3) & (based on the Revenue in Mid-Infrared Hollow Core Anti-Resonant Fiber as of 2022)
Table 10. Global Market Mid-Infrared Hollow Core Anti-Resonant Fiber Average Price by Manufacturers (US$/Km) & (2018-2023)
Table 11. Manufacturers Mid-Infrared Hollow Core Anti-Resonant Fiber Production Sites and Area Served
Table 12. Manufacturers Mid-Infrared Hollow Core Anti-Resonant Fiber Product Types
Table 13. Global Mid-Infrared Hollow Core Anti-Resonant Fiber Manufacturers Market Concentration Ratio (CR5 and HHI)
Table 14. Mergers & Acquisitions, Expansion
Table 15. Global Mid-Infrared Hollow Core Anti-Resonant Fiber Production Value by Region: 2018 VS 2022 VS 2029 (US$ Million)
Table 16. Global Mid-Infrared Hollow Core Anti-Resonant Fiber Production Value (US$ Million) by Region (2018-2023)
Table 17. Global Mid-Infrared Hollow Core Anti-Resonant Fiber Production Value Market Share by Region (2018-2023)
Table 18. Global Mid-Infrared Hollow Core Anti-Resonant Fiber Production Value (US$ Million) Forecast by Region (2024-2029)
Table 19. Global Mid-Infrared Hollow Core Anti-Resonant Fiber Production Value Market Share Forecast by Region (2024-2029)
Table 20. Global Mid-Infrared Hollow Core Anti-Resonant Fiber Production Comparison by Region: 2018 VS 2022 VS 2029 (Km)
Table 21. Global Mid-Infrared Hollow Core Anti-Resonant Fiber Production (Km) by Region (2018-2023)
Table 22. Global Mid-Infrared Hollow Core Anti-Resonant Fiber Production Market Share by Region (2018-2023)
Table 23. Global Mid-Infrared Hollow Core Anti-Resonant Fiber Production (Km) Forecast by Region (2024-2029)
Table 24. Global Mid-Infrared Hollow Core Anti-Resonant Fiber Production Market Share Forecast by Region (2024-2029)
Table 25. Global Mid-Infrared Hollow Core Anti-Resonant Fiber Market Average Price (US$/Km) by Region (2018-2023)
Table 26. Global Mid-Infrared Hollow Core Anti-Resonant Fiber Market Average Price (US$/Km) by Region (2024-2029)
Table 27. Global Mid-Infrared Hollow Core Anti-Resonant Fiber Consumption Growth Rate by Region: 2018 VS 2022 VS 2029 (Km)
Table 28. Global Mid-Infrared Hollow Core Anti-Resonant Fiber Consumption by Region (2018-2023) & (Km)
Table 29. Global Mid-Infrared Hollow Core Anti-Resonant Fiber Consumption Market Share by Region (2018-2023)
Table 30. Global Mid-Infrared Hollow Core Anti-Resonant Fiber Forecasted Consumption by Region (2024-2029) & (Km)
Table 31. Global Mid-Infrared Hollow Core Anti-Resonant Fiber Forecasted Consumption Market Share by Region (2018-2023)
Table 32. North America Mid-Infrared Hollow Core Anti-Resonant Fiber Consumption Growth Rate by Country: 2018 VS 2022 VS 2029 (Km)
Table 33. North America Mid-Infrared Hollow Core Anti-Resonant Fiber Consumption by Country (2018-2023) & (Km)
Table 34. North America Mid-Infrared Hollow Core Anti-Resonant Fiber Consumption by Country (2024-2029) & (Km)
Table 35. Europe Mid-Infrared Hollow Core Anti-Resonant Fiber Consumption Growth Rate by Country: 2018 VS 2022 VS 2029 (Km)
Table 36. Europe Mid-Infrared Hollow Core Anti-Resonant Fiber Consumption by Country (2018-2023) & (Km)
Table 37. Europe Mid-Infrared Hollow Core Anti-Resonant Fiber Consumption by Country (2024-2029) & (Km)
Table 38. Asia Pacific Mid-Infrared Hollow Core Anti-Resonant Fiber Consumption Growth Rate by Region: 2018 VS 2022 VS 2029 (Km)
Table 39. Asia Pacific Mid-Infrared Hollow Core Anti-Resonant Fiber Consumption by Region (2018-2023) & (Km)
Table 40. Asia Pacific Mid-Infrared Hollow Core Anti-Resonant Fiber Consumption by Region (2024-2029) & (Km)
Table 41. Latin America, Middle East & Africa Mid-Infrared Hollow Core Anti-Resonant Fiber Consumption Growth Rate by Country: 2018 VS 2022 VS 2029 (Km)
Table 42. Latin America, Middle East & Africa Mid-Infrared Hollow Core Anti-Resonant Fiber Consumption by Country (2018-2023) & (Km)
Table 43. Latin America, Middle East & Africa Mid-Infrared Hollow Core Anti-Resonant Fiber Consumption by Country (2024-2029) & (Km)
Table 44. Global Mid-Infrared Hollow Core Anti-Resonant Fiber Production (Km) by Core Diameter (2018-2023)
Table 45. Global Mid-Infrared Hollow Core Anti-Resonant Fiber Production (Km) by Core Diameter (2024-2029)
Table 46. Global Mid-Infrared Hollow Core Anti-Resonant Fiber Production Market Share by Core Diameter (2018-2023)
Table 47. Global Mid-Infrared Hollow Core Anti-Resonant Fiber Production Market Share by Core Diameter (2024-2029)
Table 48. Global Mid-Infrared Hollow Core Anti-Resonant Fiber Production Value (US$ Million) by Core Diameter (2018-2023)
Table 49. Global Mid-Infrared Hollow Core Anti-Resonant Fiber Production Value (US$ Million) by Core Diameter (2024-2029)
Table 50. Global Mid-Infrared Hollow Core Anti-Resonant Fiber Production Value Share by Core Diameter (2018-2023)
Table 51. Global Mid-Infrared Hollow Core Anti-Resonant Fiber Production Value Share by Core Diameter (2024-2029)
Table 52. Global Mid-Infrared Hollow Core Anti-Resonant Fiber Price (US$/Km) by Core Diameter (2018-2023)
Table 53. Global Mid-Infrared Hollow Core Anti-Resonant Fiber Price (US$/Km) by Core Diameter (2024-2029)
Table 54. Global Mid-Infrared Hollow Core Anti-Resonant Fiber Production (Km) by Application (2018-2023)
Table 55. Global Mid-Infrared Hollow Core Anti-Resonant Fiber Production (Km) by Application (2024-2029)
Table 56. Global Mid-Infrared Hollow Core Anti-Resonant Fiber Production Market Share by Application (2018-2023)
Table 57. Global Mid-Infrared Hollow Core Anti-Resonant Fiber Production Market Share by Application (2024-2029)
Table 58. Global Mid-Infrared Hollow Core Anti-Resonant Fiber Production Value (US$ Million) by Application (2018-2023)
Table 59. Global Mid-Infrared Hollow Core Anti-Resonant Fiber Production Value (US$ Million) by Application (2024-2029)
Table 60. Global Mid-Infrared Hollow Core Anti-Resonant Fiber Production Value Share by Application (2018-2023)
Table 61. Global Mid-Infrared Hollow Core Anti-Resonant Fiber Production Value Share by Application (2024-2029)
Table 62. Global Mid-Infrared Hollow Core Anti-Resonant Fiber Price (US$/Km) by Application (2018-2023)
Table 63. Global Mid-Infrared Hollow Core Anti-Resonant Fiber Price (US$/Km) by Application (2024-2029)
Table 64. NKT Photonics Mid-Infrared Hollow Core Anti-Resonant Fiber Corporation Information
Table 65. NKT Photonics Specification and Application
Table 66. NKT Photonics Mid-Infrared Hollow Core Anti-Resonant Fiber Production (Km), Value (US$ Million), Price (US$/Km) and Gross Margin (2018-2023)
Table 67. NKT Photonics Main Business and Markets Served
Table 68. NKT Photonics Recent Developments/Updates
Table 69. Photonics Bretagne Mid-Infrared Hollow Core Anti-Resonant Fiber Corporation Information
Table 70. Photonics Bretagne Specification and Application
Table 71. Photonics Bretagne Mid-Infrared Hollow Core Anti-Resonant Fiber Production (Km), Value (US$ Million), Price (US$/Km) and Gross Margin (2018-2023)
Table 72. Photonics Bretagne Main Business and Markets Served
Table 73. Photonics Bretagne Recent Developments/Updates
Table 74. GLOphotonics Mid-Infrared Hollow Core Anti-Resonant Fiber Corporation Information
Table 75. GLOphotonics Specification and Application
Table 76. GLOphotonics Mid-Infrared Hollow Core Anti-Resonant Fiber Production (Km), Value (US$ Million), Price (US$/Km) and Gross Margin (2018-2023)
Table 77. GLOphotonics Main Business and Markets Served
Table 78. GLOphotonics Recent Developments/Updates
Table 79. Guiding Photonics Mid-Infrared Hollow Core Anti-Resonant Fiber Corporation Information
Table 80. Guiding Photonics Specification and Application
Table 81. Guiding Photonics Mid-Infrared Hollow Core Anti-Resonant Fiber Production (Km), Value (US$ Million), Price (US$/Km) and Gross Margin (2018-2023)
Table 82. Guiding Photonics Main Business and Markets Served
Table 83. Guiding Photonics Recent Developments/Updates
Table 84. OFS (Furukawa) Mid-Infrared Hollow Core Anti-Resonant Fiber Corporation Information
Table 85. OFS (Furukawa) Specification and Application
Table 86. OFS (Furukawa) Mid-Infrared Hollow Core Anti-Resonant Fiber Production (Km), Value (US$ Million), Price (US$/Km) and Gross Margin (2018-2023)
Table 87. OFS (Furukawa) Main Business and Markets Served
Table 88. OFS (Furukawa) Recent Developments/Updates
Table 89. Key Raw Materials Lists
Table 90. Raw Materials Key Suppliers Lists
Table 91. Mid-Infrared Hollow Core Anti-Resonant Fiber Distributors List
Table 92. Mid-Infrared Hollow Core Anti-Resonant Fiber Customers List
Table 93. Mid-Infrared Hollow Core Anti-Resonant Fiber Market Trends
Table 94. Mid-Infrared Hollow Core Anti-Resonant Fiber Market Drivers
Table 95. Mid-Infrared Hollow Core Anti-Resonant Fiber Market Challenges
Table 96. Mid-Infrared Hollow Core Anti-Resonant Fiber Market Restraints
Table 97. Research Programs/Design for This Report
Table 98. Key Data Information from Secondary Sources
Table 99. Key Data Information from Primary Sources
List of Figures
Figure 1. Product Picture of Mid-Infrared Hollow Core Anti-Resonant Fiber
Figure 2. Global Mid-Infrared Hollow Core Anti-Resonant Fiber Market Value by Core Diameter, (US$ Million) & (2022 VS 2029)
Figure 3. Global Mid-Infrared Hollow Core Anti-Resonant Fiber Market Share by Core Diameter: 2022 VS 2029
Figure 4. Below 10µm Product Picture
Figure 5. 10-30µm Product Picture
Figure 6. Above 30µm Product Picture
Figure 7. Global Mid-Infrared Hollow Core Anti-Resonant Fiber Market Value by Application, (US$ Million) & (2022 VS 2029)
Figure 8. Global Mid-Infrared Hollow Core Anti-Resonant Fiber Market Share by Application: 2022 VS 2029
Figure 9. Telecommunications
Figure 10. High Power Laser Delivery
Figure 11. Gas Sensing
Figure 12. Optical Gyroscope
Figure 13. Other
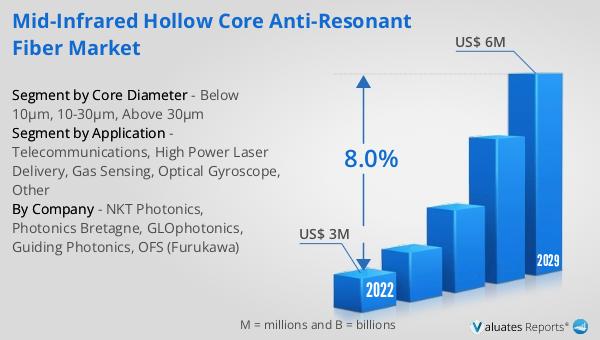
Figure 14. Global Mid-Infrared Hollow Core Anti-Resonant Fiber Production Value (US$ Million), 2018 VS 2022 VS 2029
Figure 15. Global Mid-Infrared Hollow Core Anti-Resonant Fiber Production Value (US$ Million) & (2018-2029)
Figure 16. Global Mid-Infrared Hollow Core Anti-Resonant Fiber Production (Km) & (2018-2029)
Figure 17. Global Mid-Infrared Hollow Core Anti-Resonant Fiber Average Price (US$/Km) & (2018-2029)
Figure 18. Mid-Infrared Hollow Core Anti-Resonant Fiber Report Years Considered
Figure 19. Mid-Infrared Hollow Core Anti-Resonant Fiber Production Share by Manufacturers in 2022
Figure 20. Mid-Infrared Hollow Core Anti-Resonant Fiber Market Share by Company Type (Tier 1, Tier 2, and Tier 3): 2018 VS 2022
Figure 21. The Global 5 and 10 Largest Players: Market Share by Mid-Infrared Hollow Core Anti-Resonant Fiber Revenue in 2022
Figure 22. Global Mid-Infrared Hollow Core Anti-Resonant Fiber Production Value by Region: 2018 VS 2022 VS 2029 (US$ Million)
Figure 23. Global Mid-Infrared Hollow Core Anti-Resonant Fiber Production Value Market Share by Region: 2018 VS 2022 VS 2029
Figure 24. Global Mid-Infrared Hollow Core Anti-Resonant Fiber Production Comparison by Region: 2018 VS 2022 VS 2029 (Km)
Figure 25. Global Mid-Infrared Hollow Core Anti-Resonant Fiber Production Market Share by Region: 2018 VS 2022 VS 2029
Figure 26. North America Mid-Infrared Hollow Core Anti-Resonant Fiber Production Value (US$ Million) Growth Rate (2018-2029)
Figure 27. Europe Mid-Infrared Hollow Core Anti-Resonant Fiber Production Value (US$ Million) Growth Rate (2018-2029)
Figure 28. China Mid-Infrared Hollow Core Anti-Resonant Fiber Production Value (US$ Million) Growth Rate (2018-2029)
Figure 29. Japan Mid-Infrared Hollow Core Anti-Resonant Fiber Production Value (US$ Million) Growth Rate (2018-2029)
Figure 30. Global Mid-Infrared Hollow Core Anti-Resonant Fiber Consumption by Region: 2018 VS 2022 VS 2029 (Km)
Figure 31. Global Mid-Infrared Hollow Core Anti-Resonant Fiber Consumption Market Share by Region: 2018 VS 2022 VS 2029
Figure 32. North America Mid-Infrared Hollow Core Anti-Resonant Fiber Consumption and Growth Rate (2018-2023) & (Km)
Figure 33. North America Mid-Infrared Hollow Core Anti-Resonant Fiber Consumption Market Share by Country (2018-2029)
Figure 34. Canada Mid-Infrared Hollow Core Anti-Resonant Fiber Consumption and Growth Rate (2018-2023) & (Km)
Figure 35. U.S. Mid-Infrared Hollow Core Anti-Resonant Fiber Consumption and Growth Rate (2018-2023) & (Km)
Figure 36. Europe Mid-Infrared Hollow Core Anti-Resonant Fiber Consumption and Growth Rate (2018-2023) & (Km)
Figure 37. Europe Mid-Infrared Hollow Core Anti-Resonant Fiber Consumption Market Share by Country (2018-2029)
Figure 38. Germany Mid-Infrared Hollow Core Anti-Resonant Fiber Consumption and Growth Rate (2018-2023) & (Km)
Figure 39. France Mid-Infrared Hollow Core Anti-Resonant Fiber Consumption and Growth Rate (2018-2023) & (Km)
Figure 40. U.K. Mid-Infrared Hollow Core Anti-Resonant Fiber Consumption and Growth Rate (2018-2023) & (Km)
Figure 41. Italy Mid-Infrared Hollow Core Anti-Resonant Fiber Consumption and Growth Rate (2018-2023) & (Km)
Figure 42. Russia Mid-Infrared Hollow Core Anti-Resonant Fiber Consumption and Growth Rate (2018-2023) & (Km)
Figure 43. Asia Pacific Mid-Infrared Hollow Core Anti-Resonant Fiber Consumption and Growth Rate (2018-2023) & (Km)
Figure 44. Asia Pacific Mid-Infrared Hollow Core Anti-Resonant Fiber Consumption Market Share by Regions (2018-2029)
Figure 45. China Mid-Infrared Hollow Core Anti-Resonant Fiber Consumption and Growth Rate (2018-2023) & (Km)
Figure 46. Japan Mid-Infrared Hollow Core Anti-Resonant Fiber Consumption and Growth Rate (2018-2023) & (Km)
Figure 47. South Korea Mid-Infrared Hollow Core Anti-Resonant Fiber Consumption and Growth Rate (2018-2023) & (Km)
Figure 48. China Taiwan Mid-Infrared Hollow Core Anti-Resonant Fiber Consumption and Growth Rate (2018-2023) & (Km)
Figure 49. Southeast Asia Mid-Infrared Hollow Core Anti-Resonant Fiber Consumption and Growth Rate (2018-2023) & (Km)
Figure 50. India Mid-Infrared Hollow Core Anti-Resonant Fiber Consumption and Growth Rate (2018-2023) & (Km)
Figure 51. Latin America, Middle East & Africa Mid-Infrared Hollow Core Anti-Resonant Fiber Consumption and Growth Rate (2018-2023) & (Km)
Figure 52. Latin America, Middle East & Africa Mid-Infrared Hollow Core Anti-Resonant Fiber Consumption Market Share by Country (2018-2029)
Figure 53. Mexico Mid-Infrared Hollow Core Anti-Resonant Fiber Consumption and Growth Rate (2018-2023) & (Km)
Figure 54. Brazil Mid-Infrared Hollow Core Anti-Resonant Fiber Consumption and Growth Rate (2018-2023) & (Km)
Figure 55. Turkey Mid-Infrared Hollow Core Anti-Resonant Fiber Consumption and Growth Rate (2018-2023) & (Km)
Figure 56. GCC Countries Mid-Infrared Hollow Core Anti-Resonant Fiber Consumption and Growth Rate (2018-2023) & (Km)
Figure 57. Global Production Market Share of Mid-Infrared Hollow Core Anti-Resonant Fiber by Core Diameter (2018-2029)
Figure 58. Global Production Value Market Share of Mid-Infrared Hollow Core Anti-Resonant Fiber by Core Diameter (2018-2029)
Figure 59. Global Mid-Infrared Hollow Core Anti-Resonant Fiber Price (US$/Km) by Core Diameter (2018-2029)
Figure 60. Global Production Market Share of Mid-Infrared Hollow Core Anti-Resonant Fiber by Application (2018-2029)
Figure 61. Global Production Value Market Share of Mid-Infrared Hollow Core Anti-Resonant Fiber by Application (2018-2029)
Figure 62. Global Mid-Infrared Hollow Core Anti-Resonant Fiber Price (US$/Km) by Application (2018-2029)
Figure 63. Mid-Infrared Hollow Core Anti-Resonant Fiber Value Chain
Figure 64. Mid-Infrared Hollow Core Anti-Resonant Fiber Production Process
Figure 65. Channels of Distribution (Direct Vs Distribution)
Figure 66. Distributors Profiles
Figure 67. Bottom-up and Top-down Approaches for This Report
Figure 68. Data Triangulation