List of Tables
Table 1. Global Cloud Security Operations Center Market Size Growth Rate by Type (US$ Million): 2020 VS 2024 VS 2031
Table 2. Key Players of General-Purpose
Table 3. Key Players of Targeted For Specific Industries
Table 4. Global Cloud Security Operations Center Market Size Growth Rate by Service Model (US$ Million): 2020 VS 2024 VS 2031
Table 5. Key Players of Fully Managed
Table 6. Key Players of Co-Built and Operated
Table 7. Global Cloud Security Operations Center Market Size Growth Rate by Deployment Type (US$ Million): 2020 VS 2024 VS 2031
Table 8. Key Players of Public Cloud-Based
Table 9. Key Players of Localized and Private
Table 10. Key Players of Hybrid Cloud Model
Table 11. Global Cloud Security Operations Center Market Size Growth Rate by Intelligence Level (US$ Million): 2020 VS 2024 VS 2031
Table 12. Key Players of Human-Machine Collaborative Analysis
Table 13. Key Players of Active Predictive Autonomous Platform
Table 14. Global Cloud Security Operations Center Market Size Growth by Application (US$ Million): 2020 VS 2024 VS 2031
Table 15. Global Cloud Security Operations Center Market Size by Region (US$ Million): 2020 VS 2024 VS 2031
Table 16. Global Cloud Security Operations Center Market Size by Region (2020-2025) & (US$ Million)
Table 17. Global Cloud Security Operations Center Market Share by Region (2020-2025)
Table 18. Global Cloud Security Operations Center Forecasted Market Size by Region (2026-2031) & (US$ Million)
Table 19. Global Cloud Security Operations Center Market Share by Region (2026-2031)
Table 20. Cloud Security Operations Center Market Trends
Table 21. Cloud Security Operations Center Market Drivers
Table 22. Cloud Security Operations Center Market Challenges
Table 23. Cloud Security Operations Center Market Restraints
Table 24. Global Cloud Security Operations Center Revenue by Players (2020-2025) & (US$ Million)
Table 25. Global Cloud Security Operations Center Market Share by Players (2020-2025)
Table 26. Global Top Cloud Security Operations Center Players by Company Type (Tier 1, Tier 2, and Tier 3) & (based on the Revenue in Cloud Security Operations Center as of 2024)
Table 27. Ranking of Global Top Cloud Security Operations Center Companies by Revenue (US$ Million) in 2024
Table 28. Global 5 Largest Players Market Share by Cloud Security Operations Center Revenue (CR5 and HHI) & (2020-2025)
Table 29. Global Key Players of Cloud Security Operations Center, Headquarters and Area Served
Table 30. Global Key Players of Cloud Security Operations Center, Product and Application
Table 31. Global Key Players of Cloud Security Operations Center, Date of Enter into This Industry
Table 32. Mergers & Acquisitions, Expansion Plans
Table 33. Global Cloud Security Operations Center Market Size by Type (2020-2025) & (US$ Million)
Table 34. Global Cloud Security Operations Center Revenue Market Share by Type (2020-2025)
Table 35. Global Cloud Security Operations Center Forecasted Market Size by Type (2026-2031) & (US$ Million)
Table 36. Global Cloud Security Operations Center Revenue Market Share by Type (2026-2031)
Table 37. Global Cloud Security Operations Center Market Size by Application (2020-2025) & (US$ Million)
Table 38. Global Cloud Security Operations Center Revenue Market Share by Application (2020-2025)
Table 39. Global Cloud Security Operations Center Forecasted Market Size by Application (2026-2031) & (US$ Million)
Table 40. Global Cloud Security Operations Center Revenue Market Share by Application (2026-2031)
Table 41. North America Cloud Security Operations Center Market Size Growth Rate by Country (US$ Million): 2020 VS 2024 VS 2031
Table 42. North America Cloud Security Operations Center Market Size by Country (2020-2025) & (US$ Million)
Table 43. North America Cloud Security Operations Center Market Size by Country (2026-2031) & (US$ Million)
Table 44. Europe Cloud Security Operations Center Market Size Growth Rate by Country (US$ Million): 2020 VS 2024 VS 2031
Table 45. Europe Cloud Security Operations Center Market Size by Country (2020-2025) & (US$ Million)
Table 46. Europe Cloud Security Operations Center Market Size by Country (2026-2031) & (US$ Million)
Table 47. Asia-Pacific Cloud Security Operations Center Market Size Growth Rate by Region (US$ Million): 2020 VS 2024 VS 2031
Table 48. Asia-Pacific Cloud Security Operations Center Market Size by Region (2020-2025) & (US$ Million)
Table 49. Asia-Pacific Cloud Security Operations Center Market Size by Region (2026-2031) & (US$ Million)
Table 50. Latin America Cloud Security Operations Center Market Size Growth Rate by Country (US$ Million): 2020 VS 2024 VS 2031
Table 51. Latin America Cloud Security Operations Center Market Size by Country (2020-2025) & (US$ Million)
Table 52. Latin America Cloud Security Operations Center Market Size by Country (2026-2031) & (US$ Million)
Table 53. Middle East & Africa Cloud Security Operations Center Market Size Growth Rate by Country (US$ Million): 2020 VS 2024 VS 2031
Table 54. Middle East & Africa Cloud Security Operations Center Market Size by Country (2020-2025) & (US$ Million)
Table 55. Middle East & Africa Cloud Security Operations Center Market Size by Country (2026-2031) & (US$ Million)
Table 56. Palo Alto Networks Company Details
Table 57. Palo Alto Networks Business Overview
Table 58. Palo Alto Networks Cloud Security Operations Center Product
Table 59. Palo Alto Networks Revenue in Cloud Security Operations Center Business (2020-2025) & (US$ Million)
Table 60. Palo Alto Networks Recent Development
Table 61. CrowdStrike Company Details
Table 62. CrowdStrike Business Overview
Table 63. CrowdStrike Cloud Security Operations Center Product
Table 64. CrowdStrike Revenue in Cloud Security Operations Center Business (2020-2025) & (US$ Million)
Table 65. CrowdStrike Recent Development
Table 66. Microsoft Company Details
Table 67. Microsoft Business Overview
Table 68. Microsoft Cloud Security Operations Center Product
Table 69. Microsoft Revenue in Cloud Security Operations Center Business (2020-2025) & (US$ Million)
Table 70. Microsoft Recent Development
Table 71. IBM Company Details
Table 72. IBM Business Overview
Table 73. IBM Cloud Security Operations Center Product
Table 74. IBM Revenue in Cloud Security Operations Center Business (2020-2025) & (US$ Million)
Table 75. IBM Recent Development
Table 76. Secureworks Company Details
Table 77. Secureworks Business Overview
Table 78. Secureworks Cloud Security Operations Center Product
Table 79. Secureworks Revenue in Cloud Security Operations Center Business (2020-2025) & (US$ Million)
Table 80. Secureworks Recent Development
Table 81. AT&T Cybersecurity Company Details
Table 82. AT&T Cybersecurity Business Overview
Table 83. AT&T Cybersecurity Cloud Security Operations Center Product
Table 84. AT&T Cybersecurity Revenue in Cloud Security Operations Center Business (2020-2025) & (US$ Million)
Table 85. AT&T Cybersecurity Recent Development
Table 86. Qi An Xin Technology Company Details
Table 87. Qi An Xin Technology Business Overview
Table 88. Qi An Xin Technology Cloud Security Operations Center Product
Table 89. Qi An Xin Technology Revenue in Cloud Security Operations Center Business (2020-2025) & (US$ Million)
Table 90. Qi An Xin Technology Recent Development
Table 91. HUAWEI Company Details
Table 92. HUAWEI Business Overview
Table 93. HUAWEI Cloud Security Operations Center Product
Table 94. HUAWEI Revenue in Cloud Security Operations Center Business (2020-2025) & (US$ Million)
Table 95. HUAWEI Recent Development
Table 96. Tencent Cloud Company Details
Table 97. Tencent Cloud Business Overview
Table 98. Tencent Cloud Cloud Security Operations Center Product
Table 99. Tencent Cloud Revenue in Cloud Security Operations Center Business (2020-2025) & (US$ Million)
Table 100. Tencent Cloud Recent Development
Table 101. Alibaba Cloud Company Details
Table 102. Alibaba Cloud Business Overview
Table 103. Alibaba Cloud Cloud Security Operations Center Product
Table 104. Alibaba Cloud Revenue in Cloud Security Operations Center Business (2020-2025) & (US$ Million)
Table 105. Alibaba Cloud Recent Development
Table 106. Venustech Group Company Details
Table 107. Venustech Group Business Overview
Table 108. Venustech Group Cloud Security Operations Center Product
Table 109. Venustech Group Revenue in Cloud Security Operations Center Business (2020-2025) & (US$ Million)
Table 110. Venustech Group Recent Development
Table 111. NSFOCUS Technologies Company Details
Table 112. NSFOCUS Technologies Business Overview
Table 113. NSFOCUS Technologies Cloud Security Operations Center Product
Table 114. NSFOCUS Technologies Revenue in Cloud Security Operations Center Business (2020-2025) & (US$ Million)
Table 115. NSFOCUS Technologies Recent Development
Table 116. Topsec Technologies Company Details
Table 117. Topsec Technologies Business Overview
Table 118. Topsec Technologies Cloud Security Operations Center Product
Table 119. Topsec Technologies Revenue in Cloud Security Operations Center Business (2020-2025) & (US$ Million)
Table 120. Topsec Technologies Recent Development
Table 121. DBAPPSecurity Company Details
Table 122. DBAPPSecurity Business Overview
Table 123. DBAPPSecurity Cloud Security Operations Center Product
Table 124. DBAPPSecurity Revenue in Cloud Security Operations Center Business (2020-2025) & (US$ Million)
Table 125. DBAPPSecurity Recent Development
Table 126. Sangfor Technologies Company Details
Table 127. Sangfor Technologies Business Overview
Table 128. Sangfor Technologies Cloud Security Operations Center Product
Table 129. Sangfor Technologies Revenue in Cloud Security Operations Center Business (2020-2025) & (US$ Million)
Table 130. Sangfor Technologies Recent Development
Table 131. Insur Company Details
Table 132. Insur Business Overview
Table 133. Insur Cloud Security Operations Center Product
Table 134. Insur Revenue in Cloud Security Operations Center Business (2020-2025) & (US$ Million)
Table 135. Insur Recent Development
Table 136. H3C Technologies Company Details
Table 137. H3C Technologies Business Overview
Table 138. H3C Technologies Cloud Security Operations Center Product
Table 139. H3C Technologies Revenue in Cloud Security Operations Center Business (2020-2025) & (US$ Million)
Table 140. H3C Technologies Recent Development
Table 141. Volcano Engine Company Details
Table 142. Volcano Engine Business Overview
Table 143. Volcano Engine Cloud Security Operations Center Product
Table 144. Volcano Engine Revenue in Cloud Security Operations Center Business (2020-2025) & (US$ Million)
Table 145. Volcano Engine Recent Development
Table 146. Research Programs/Design for This Report
Table 147. Key Data Information from Secondary Sources
Table 148. Key Data Information from Primary Sources
Table 149. Authors List of This Report
List of Figures
Figure 1. Cloud Security Operations Center Picture
Figure 2. Global Cloud Security Operations Center Market Size Comparison by Type (2020-2031) & (US$ Million)
Figure 3. Global Cloud Security Operations Center Market Share by Type: 2024 VS 2031
Figure 4. General-Purpose Features
Figure 5. Targeted For Specific Industries Features
Figure 6. Global Cloud Security Operations Center Market Size Comparison by Service Model (2020-2031) & (US$ Million)
Figure 7. Fully Managed Features
Figure 8. Co-Built and Operated Features
Figure 9. Global Cloud Security Operations Center Market Size Comparison by Deployment Type (2020-2031) & (US$ Million)
Figure 10. Public Cloud-Based Features
Figure 11. Localized and Private Features
Figure 12. Hybrid Cloud Model Features
Figure 13. Global Cloud Security Operations Center Market Size Comparison by Intelligence Level (2020-2031) & (US$ Million)
Figure 14. Human-Machine Collaborative Analysis Features
Figure 15. Active Predictive Autonomous Platform Features
Figure 16. Global Cloud Security Operations Center Market Size by Application (2020-2031) & (US$ Million)
Figure 17. Global Cloud Security Operations Center Market Share by Application: 2024 VS 2031
Figure 18. Government Agencies Case Studies
Figure 19. Financial Industry Case Studies
Figure 20. Internet Industry Case Studies
Figure 21. Education Industry Case Studies
Figure 22. Healthcare Case Studies
Figure 23. E-Commerce Case Studies
Figure 24. Cloud Security Operations Center Report Years Considered
Figure 25. Global Cloud Security Operations Center Market Size (US$ Million), Year-over-Year: 2020-2031
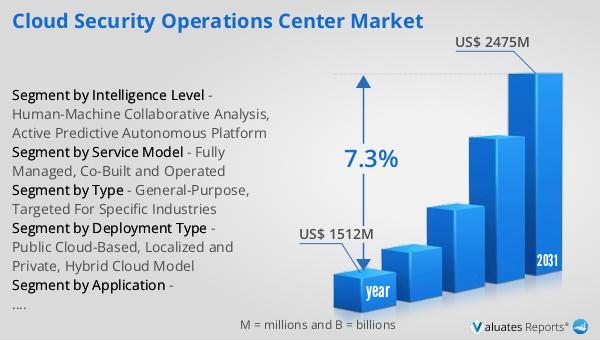
Figure 26. Global Cloud Security Operations Center Market Size, (US$ Million), 2020 VS 2024 VS 2031
Figure 27. Global Cloud Security Operations Center Market Share by Region: 2024 VS 2031
Figure 28. Global Cloud Security Operations Center Market Share by Players in 2024
Figure 29. Global Cloud Security Operations Center Market Share by Company Type (Tier 1, Tier 2, and Tier 3)
Figure 30. The Top 10 and 5 Players Market Share by Cloud Security Operations Center Revenue in 2024
Figure 31. North America Cloud Security Operations Center Market Size YoY Growth (2020-2031) & (US$ Million)
Figure 32. North America Cloud Security Operations Center Market Share by Country (2020-2031)
Figure 33. United States Cloud Security Operations Center Market Size YoY Growth (2020-2031) & (US$ Million)
Figure 34. Canada Cloud Security Operations Center Market Size YoY Growth (2020-2031) & (US$ Million)
Figure 35. Europe Cloud Security Operations Center Market Size YoY Growth (2020-2031) & (US$ Million)
Figure 36. Europe Cloud Security Operations Center Market Share by Country (2020-2031)
Figure 37. Germany Cloud Security Operations Center Market Size YoY Growth (2020-2031) & (US$ Million)
Figure 38. France Cloud Security Operations Center Market Size YoY Growth (2020-2031) & (US$ Million)
Figure 39. U.K. Cloud Security Operations Center Market Size YoY Growth (2020-2031) & (US$ Million)
Figure 40. Italy Cloud Security Operations Center Market Size YoY Growth (2020-2031) & (US$ Million)
Figure 41. Russia Cloud Security Operations Center Market Size YoY Growth (2020-2031) & (US$ Million)
Figure 42. Ireland Cloud Security Operations Center Market Size YoY Growth (2020-2031) & (US$ Million)
Figure 43. Asia-Pacific Cloud Security Operations Center Market Size YoY Growth (2020-2031) & (US$ Million)
Figure 44. Asia-Pacific Cloud Security Operations Center Market Share by Region (2020-2031)
Figure 45. China Cloud Security Operations Center Market Size YoY Growth (2020-2031) & (US$ Million)
Figure 46. Japan Cloud Security Operations Center Market Size YoY Growth (2020-2031) & (US$ Million)
Figure 47. South Korea Cloud Security Operations Center Market Size YoY Growth (2020-2031) & (US$ Million)
Figure 48. Southeast Asia Cloud Security Operations Center Market Size YoY Growth (2020-2031) & (US$ Million)
Figure 49. India Cloud Security Operations Center Market Size YoY Growth (2020-2031) & (US$ Million)
Figure 50. Australia & New Zealand Cloud Security Operations Center Market Size YoY Growth (2020-2031) & (US$ Million)
Figure 51. Latin America Cloud Security Operations Center Market Size YoY Growth (2020-2031) & (US$ Million)
Figure 52. Latin America Cloud Security Operations Center Market Share by Country (2020-2031)
Figure 53. Mexico Cloud Security Operations Center Market Size YoY Growth (2020-2031) & (US$ Million)
Figure 54. Brazil Cloud Security Operations Center Market Size YoY Growth (2020-2031) & (US$ Million)
Figure 55. Middle East & Africa Cloud Security Operations Center Market Size YoY Growth (2020-2031) & (US$ Million)
Figure 56. Middle East & Africa Cloud Security Operations Center Market Share by Country (2020-2031)
Figure 57. Israel Cloud Security Operations Center Market Size YoY Growth (2020-2031) & (US$ Million)
Figure 58. Saudi Arabia Cloud Security Operations Center Market Size YoY Growth (2020-2031) & (US$ Million)
Figure 59. UAE Cloud Security Operations Center Market Size YoY Growth (2020-2031) & (US$ Million)
Figure 60. Palo Alto Networks Revenue Growth Rate in Cloud Security Operations Center Business (2020-2025)
Figure 61. CrowdStrike Revenue Growth Rate in Cloud Security Operations Center Business (2020-2025)
Figure 62. Microsoft Revenue Growth Rate in Cloud Security Operations Center Business (2020-2025)
Figure 63. IBM Revenue Growth Rate in Cloud Security Operations Center Business (2020-2025)
Figure 64. Secureworks Revenue Growth Rate in Cloud Security Operations Center Business (2020-2025)
Figure 65. AT&T Cybersecurity Revenue Growth Rate in Cloud Security Operations Center Business (2020-2025)
Figure 66. Qi An Xin Technology Revenue Growth Rate in Cloud Security Operations Center Business (2020-2025)
Figure 67. HUAWEI Revenue Growth Rate in Cloud Security Operations Center Business (2020-2025)
Figure 68. Tencent Cloud Revenue Growth Rate in Cloud Security Operations Center Business (2020-2025)
Figure 69. Alibaba Cloud Revenue Growth Rate in Cloud Security Operations Center Business (2020-2025)
Figure 70. Venustech Group Revenue Growth Rate in Cloud Security Operations Center Business (2020-2025)
Figure 71. NSFOCUS Technologies Revenue Growth Rate in Cloud Security Operations Center Business (2020-2025)
Figure 72. Topsec Technologies Revenue Growth Rate in Cloud Security Operations Center Business (2020-2025)
Figure 73. DBAPPSecurity Revenue Growth Rate in Cloud Security Operations Center Business (2020-2025)
Figure 74. Sangfor Technologies Revenue Growth Rate in Cloud Security Operations Center Business (2020-2025)
Figure 75. Insur Revenue Growth Rate in Cloud Security Operations Center Business (2020-2025)
Figure 76. H3C Technologies Revenue Growth Rate in Cloud Security Operations Center Business (2020-2025)
Figure 77. Volcano Engine Revenue Growth Rate in Cloud Security Operations Center Business (2020-2025)
Figure 78. Bottom-up and Top-down Approaches for This Report
Figure 79. Data Triangulation
Figure 80. Key Executives Interviewed