List of Tables
Table 1. Global Temperature Calibration Services Market Size Growth Rate by Type (US$ Million): 2021 vs 2025 vs 2032
Table 2. Key Players of Fixed-point Calibration
Table 3. Key Players of Comparative Calibration
Table 4. Global Temperature Calibration Services Market Size Growth Rate by Calibration Objects (US$ Million): 2021 vs 2025 vs 2032
Table 5. Key Players of Standard Calibration
Table 6. Key Players of Working Instrument Calibration
Table 7. Global Temperature Calibration Services Market Size Growth Rate by Service Modes (US$ Million): 2021 vs 2025 vs 2032
Table 8. Key Players of Full-process Calibration Service
Table 9. Key Players of Modular Calibration Service
Table 10. Global Temperature Calibration Services Market Size Growth by Application (US$ Million): 2021 vs 2025 vs 2032
Table 11. Global Temperature Calibration Services Market Size by Region (US$ Million): 2021 vs 2025 vs 2032
Table 12. Global Temperature Calibration Services Market Size by Region (US$ Million), 2021–2026
Table 13. Global Temperature Calibration Services Market Share by Region (2021–2026)
Table 14. Global Temperature Calibration Services Forecasted Market Size by Region (US$ Million), 2027–2032
Table 15. Global Temperature Calibration Services Market Share by Region (2027–2032)
Table 16. Temperature Calibration Services Market Trends
Table 17. Temperature Calibration Services Market Drivers
Table 18. Temperature Calibration Services Market Challenges
Table 19. Temperature Calibration Services Market Restraints
Table 20. Global Temperature Calibration Services Revenue by Players (US$ Million), 2021–2026
Table 21. Global Temperature Calibration Services Market Share by Players (2021–2026)
Table 22. Global Top Temperature Calibration Services Players by Tier (Tier 1, Tier 2, and Tier 3), based on Temperature Calibration Services Revenue, 2025
Table 23. Ranking of Global Top Temperature Calibration Services Companies by Revenue (US$ Million) in 2025
Table 24. Global 5 Largest Players Market Share by Temperature Calibration Services Revenue (CR5 and HHI), 2021–2026
Table 25. Global Key Players of Temperature Calibration Services, Headquarters and Area Served
Table 26. Global Key Players of Temperature Calibration Services, Products and Applications
Table 27. Global Key Players of Temperature Calibration Services, Date of General Availability (GA)
Table 28. Mergers and Acquisitions, Expansion Plans
Table 29. Global Temperature Calibration Services Market Size by Type (US$ Million), 2021–2026
Table 30. Global Temperature Calibration Services Revenue Market Share by Type (2021–2026)
Table 31. Global Temperature Calibration Services Forecasted Market Size by Type (US$ Million), 2027–2032
Table 32. Global Temperature Calibration Services Revenue Market Share by Type (2027–2032)
Table 33. Global Temperature Calibration Services Market Size by Application (US$ Million), 2021–2026
Table 34. Global Temperature Calibration Services Revenue Market Share by Application (2021–2026)
Table 35. Global Temperature Calibration Services Forecasted Market Size by Application (US$ Million), 2027–2032
Table 36. Global Temperature Calibration Services Revenue Market Share by Application (2027–2032)
Table 37. North America Temperature Calibration Services Market Size Growth Rate by Country (US$ Million): 2021 vs 2025 vs 2032
Table 38. North America Temperature Calibration Services Market Size by Country (US$ Million), 2021–2026
Table 39. North America Temperature Calibration Services Market Size by Country (US$ Million), 2027–2032
Table 40. Europe Temperature Calibration Services Market Size Growth Rate by Country (US$ Million): 2021 vs 2025 vs 2032
Table 41. Europe Temperature Calibration Services Market Size by Country (US$ Million), 2021–2026
Table 42. Europe Temperature Calibration Services Market Size by Country (US$ Million), 2027–2032
Table 43. Asia-Pacific Temperature Calibration Services Market Size Growth Rate by Region (US$ Million): 2021 vs 2025 vs 2032
Table 44. Asia-Pacific Temperature Calibration Services Market Size by Region (US$ Million), 2021–2026
Table 45. Asia-Pacific Temperature Calibration Services Market Size by Region (US$ Million), 2027–2032
Table 46. Latin America Temperature Calibration Services Market Size Growth Rate by Country (US$ Million): 2021 vs 2025 vs 2032
Table 47. Latin America Temperature Calibration Services Market Size by Country (US$ Million), 2021–2026
Table 48. Latin America Temperature Calibration Services Market Size by Country (US$ Million), 2027–2032
Table 49. Middle East & Africa Temperature Calibration Services Market Size Growth Rate by Country (US$ Million): 2021 vs 2025 vs 2032
Table 50. Middle East & Africa Temperature Calibration Services Market Size by Country (US$ Million), 2021–2026
Table 51. Middle East & Africa Temperature Calibration Services Market Size by Country (US$ Million), 2027–2032
Table 52. Withnell Sensors Company Details
Table 53. Withnell Sensors Business Overview
Table 54. Withnell Sensors Temperature Calibration Services Product
Table 55. Withnell Sensors Revenue in Temperature Calibration Services Business (US$ Million), 2021–2026
Table 56. Withnell Sensors Recent Development
Table 57. Michell Instruments Company Details
Table 58. Michell Instruments Business Overview
Table 59. Michell Instruments Temperature Calibration Services Product
Table 60. Michell Instruments Revenue in Temperature Calibration Services Business (US$ Million), 2021–2026
Table 61. Michell Instruments Recent Development
Table 62. Fluke Corporation Company Details
Table 63. Fluke Corporation Business Overview
Table 64. Fluke Corporation Temperature Calibration Services Product
Table 65. Fluke Corporation Revenue in Temperature Calibration Services Business (US$ Million), 2021–2026
Table 66. Fluke Corporation Recent Development
Table 67. AMETEK Company Details
Table 68. AMETEK Business Overview
Table 69. AMETEK Temperature Calibration Services Product
Table 70. AMETEK Revenue in Temperature Calibration Services Business (US$ Million), 2021–2026
Table 71. AMETEK Recent Development
Table 72. Beamex Company Details
Table 73. Beamex Business Overview
Table 74. Beamex Temperature Calibration Services Product
Table 75. Beamex Revenue in Temperature Calibration Services Business (US$ Million), 2021–2026
Table 76. Beamex Recent Development
Table 77. WIKA Company Details
Table 78. WIKA Business Overview
Table 79. WIKA Temperature Calibration Services Product
Table 80. WIKA Revenue in Temperature Calibration Services Business (US$ Million), 2021–2026
Table 81. WIKA Recent Development
Table 82. Sika Company Details
Table 83. Sika Business Overview
Table 84. Sika Temperature Calibration Services Product
Table 85. Sika Revenue in Temperature Calibration Services Business (US$ Million), 2021–2026
Table 86. Sika Recent Development
Table 87. Beijing Kangste Instrument Technology Company Details
Table 88. Beijing Kangste Instrument Technology Business Overview
Table 89. Beijing Kangste Instrument Technology Temperature Calibration Services Product
Table 90. Beijing Kangste Instrument Technology Revenue in Temperature Calibration Services Business (US$ Million), 2021–2026
Table 91. Beijing Kangste Instrument Technology Recent Development
Table 92. TÜV Rheinland Company Details
Table 93. TÜV Rheinland Business Overview
Table 94. TÜV Rheinland Temperature Calibration Services Product
Table 95. TÜV Rheinland Revenue in Temperature Calibration Services Business (US$ Million), 2021–2026
Table 96. TÜV Rheinland Recent Development
Table 97. Bureau Veritas Company Details
Table 98. Bureau Veritas Business Overview
Table 99. Bureau Veritas Temperature Calibration Services Product
Table 100. Bureau Veritas Revenue in Temperature Calibration Services Business (US$ Million), 2021–2026
Table 101. Bureau Veritas Recent Development
Table 102. Intertek Company Details
Table 103. Intertek Business Overview
Table 104. Intertek Temperature Calibration Services Product
Table 105. Intertek Revenue in Temperature Calibration Services Business (US$ Million), 2021–2026
Table 106. Intertek Recent Development
Table 107. DEKRA Company Details
Table 108. DEKRA Business Overview
Table 109. DEKRA Temperature Calibration Services Product
Table 110. DEKRA Revenue in Temperature Calibration Services Business (US$ Million), 2021–2026
Table 111. DEKRA Recent Development
Table 112. Jiangsu Shitong Instrument Testing Company Details
Table 113. Jiangsu Shitong Instrument Testing Business Overview
Table 114. Jiangsu Shitong Instrument Testing Temperature Calibration Services Product
Table 115. Jiangsu Shitong Instrument Testing Revenue in Temperature Calibration Services Business (US$ Million), 2021–2026
Table 116. Jiangsu Shitong Instrument Testing Recent Development
Table 117. Beijing Zhongce Calibration Technology Company Details
Table 118. Beijing Zhongce Calibration Technology Business Overview
Table 119. Beijing Zhongce Calibration Technology Temperature Calibration Services Product
Table 120. Beijing Zhongce Calibration Technology Revenue in Temperature Calibration Services Business (US$ Million), 2021–2026
Table 121. Beijing Zhongce Calibration Technology Recent Development
Table 122. Guangzhou Huace Testing Company Details
Table 123. Guangzhou Huace Testing Business Overview
Table 124. Guangzhou Huace Testing Temperature Calibration Services Product
Table 125. Guangzhou Huace Testing Revenue in Temperature Calibration Services Business (US$ Million), 2021–2026
Table 126. Guangzhou Huace Testing Recent Development
Table 127. Xi'an Guolian Metrology Testing Company Details
Table 128. Xi'an Guolian Metrology Testing Business Overview
Table 129. Xi'an Guolian Metrology Testing Temperature Calibration Services Product
Table 130. Xi'an Guolian Metrology Testing Revenue in Temperature Calibration Services Business (US$ Million), 2021–2026
Table 131. Xi'an Guolian Metrology Testing Recent Development
Table 132. OMEGA Engineering Company Details
Table 133. OMEGA Engineering Business Overview
Table 134. OMEGA Engineering Temperature Calibration Services Product
Table 135. OMEGA Engineering Revenue in Temperature Calibration Services Business (US$ Million), 2021–2026
Table 136. OMEGA Engineering Recent Development
Table 137. Isothermal Technology Company Details
Table 138. Isothermal Technology Business Overview
Table 139. Isothermal Technology Temperature Calibration Services Product
Table 140. Isothermal Technology Revenue in Temperature Calibration Services Business (US$ Million), 2021–2026
Table 141. Isothermal Technology Recent Development
Table 142. CHINO Corporation Company Details
Table 143. CHINO Corporation Business Overview
Table 144. CHINO Corporation Temperature Calibration Services Product
Table 145. CHINO Corporation Revenue in Temperature Calibration Services Business (US$ Million), 2021–2026
Table 146. CHINO Corporation Recent Development
Table 147. Research Programs/Design for This Report
Table 148. Key Data Information from Secondary Sources
Table 149. Key Data Information from Primary Sources
Table 150. Authors List of This Report
List of Figures
Figure 1. Temperature Calibration Services Picture
Figure 2. Global Temperature Calibration Services Market Size Comparison by Type (US$ Million), 2021–2032
Figure 3. Global Temperature Calibration Services Market Share by Type: 2025 vs 2032
Figure 4. Fixed-point Calibration Features
Figure 5. Comparative Calibration Features
Figure 6. Global Temperature Calibration Services Market Size Comparison by Calibration Objects (US$ Million), 2021–2032
Figure 7. Standard Calibration Features
Figure 8. Working Instrument Calibration Features
Figure 9. Global Temperature Calibration Services Market Size Comparison by Service Modes (US$ Million), 2021–2032
Figure 10. Full-process Calibration Service Features
Figure 11. Modular Calibration Service Features
Figure 12. Global Temperature Calibration Services Market Size by Application (US$ Million), 2021–2032
Figure 13. Global Temperature Calibration Services Market Share by Application: 2025 vs 2032
Figure 14. Biopharmaceuticals Case Studies
Figure 15. Food & Beverage Case Studies
Figure 16. Healthcare Case Studies
Figure 17. Aerospace Case Studies
Figure 18. Other Case Studies
Figure 19. Temperature Calibration Services Report Years Considered
Figure 20. Global Temperature Calibration Services Market Size (US$ Million), Year-over-Year: 2021–2032
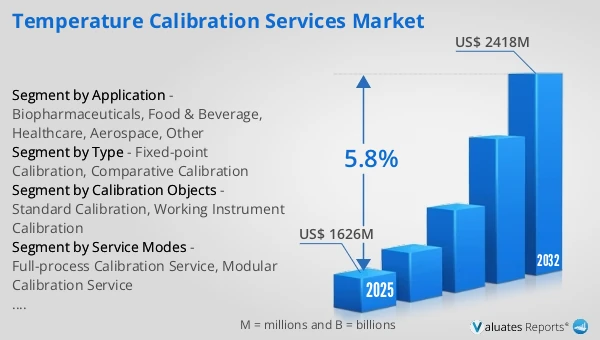
Figure 21. Global Temperature Calibration Services Market Size, (US$ Million), 2021 vs 2025 vs 2032
Figure 22. Global Temperature Calibration Services Market Share by Region: 2025 vs 2032
Figure 23. Global Temperature Calibration Services Market Share by Players in 2025
Figure 24. Global Temperature Calibration Services Market Share by Company Type (Tier 1, Tier 2, and Tier 3)
Figure 25. The Top 10 and 5 Players Market Share by Temperature Calibration Services Revenue in 2025
Figure 26. North America Temperature Calibration Services Market Size YoY Growth (US$ Million), 2021–2032
Figure 27. North America Temperature Calibration Services Market Share by Country (2021–2032)
Figure 28. United States Temperature Calibration Services Market Size YoY Growth (US$ Million), 2021–2032
Figure 29. Canada Temperature Calibration Services Market Size YoY Growth (US$ Million), 2021–2032
Figure 30. Europe Temperature Calibration Services Market Size YoY Growth (US$ Million), 2021–2032
Figure 31. Europe Temperature Calibration Services Market Share by Country (2021–2032)
Figure 32. Germany Temperature Calibration Services Market Size YoY Growth (US$ Million), 2021–2032
Figure 33. France Temperature Calibration Services Market Size YoY Growth (US$ Million), 2021–2032
Figure 34. U.K. Temperature Calibration Services Market Size YoY Growth (US$ Million), 2021–2032
Figure 35. Italy Temperature Calibration Services Market Size YoY Growth (US$ Million), 2021–2032
Figure 36. Russia Temperature Calibration Services Market Size YoY Growth (US$ Million), 2021–2032
Figure 37. Ireland Temperature Calibration Services Market Size YoY Growth (US$ Million), 2021–2032
Figure 38. Asia-Pacific Temperature Calibration Services Market Size YoY Growth (US$ Million), 2021–2032
Figure 39. Asia-Pacific Temperature Calibration Services Market Share by Region (2021–2032)
Figure 40. China Temperature Calibration Services Market Size YoY Growth (US$ Million), 2021–2032
Figure 41. Japan Temperature Calibration Services Market Size YoY Growth (US$ Million), 2021–2032
Figure 42. South Korea Temperature Calibration Services Market Size YoY Growth (US$ Million), 2021–2032
Figure 43. Southeast Asia Temperature Calibration Services Market Size YoY Growth (US$ Million), 2021–2032
Figure 44. India Temperature Calibration Services Market Size YoY Growth (US$ Million), 2021–2032
Figure 45. Australia & New Zealand Temperature Calibration Services Market Size YoY Growth (US$ Million), 2021–2032
Figure 46. Latin America Temperature Calibration Services Market Size YoY Growth (US$ Million), 2021–2032
Figure 47. Latin America Temperature Calibration Services Market Share by Country (2021–2032)
Figure 48. Mexico Temperature Calibration Services Market Size YoY Growth (US$ Million), 2021–2032
Figure 49. Brazil Temperature Calibration Services Market Size YoY Growth (US$ Million), 2021–2032
Figure 50. Middle East & Africa Temperature Calibration Services Market Size YoY Growth (US$ Million), 2021–2032
Figure 51. Middle East & Africa Temperature Calibration Services Market Share by Country (2021–2032)
Figure 52. Israel Temperature Calibration Services Market Size YoY Growth (US$ Million), 2021–2032
Figure 53. Saudi Arabia Temperature Calibration Services Market Size YoY Growth (US$ Million), 2021–2032
Figure 54. UAE Temperature Calibration Services Market Size YoY Growth (US$ Million), 2021–2032
Figure 55. Withnell Sensors Revenue Growth Rate in Temperature Calibration Services Business (2021–2026)
Figure 56. Michell Instruments Revenue Growth Rate in Temperature Calibration Services Business (2021–2026)
Figure 57. Fluke Corporation Revenue Growth Rate in Temperature Calibration Services Business (2021–2026)
Figure 58. AMETEK Revenue Growth Rate in Temperature Calibration Services Business (2021–2026)
Figure 59. Beamex Revenue Growth Rate in Temperature Calibration Services Business (2021–2026)
Figure 60. WIKA Revenue Growth Rate in Temperature Calibration Services Business (2021–2026)
Figure 61. Sika Revenue Growth Rate in Temperature Calibration Services Business (2021–2026)
Figure 62. Beijing Kangste Instrument Technology Revenue Growth Rate in Temperature Calibration Services Business (2021–2026)
Figure 63. TÜV Rheinland Revenue Growth Rate in Temperature Calibration Services Business (2021–2026)
Figure 64. Bureau Veritas Revenue Growth Rate in Temperature Calibration Services Business (2021–2026)
Figure 65. Intertek Revenue Growth Rate in Temperature Calibration Services Business (2021–2026)
Figure 66. DEKRA Revenue Growth Rate in Temperature Calibration Services Business (2021–2026)
Figure 67. Jiangsu Shitong Instrument Testing Revenue Growth Rate in Temperature Calibration Services Business (2021–2026)
Figure 68. Beijing Zhongce Calibration Technology Revenue Growth Rate in Temperature Calibration Services Business (2021–2026)
Figure 69. Guangzhou Huace Testing Revenue Growth Rate in Temperature Calibration Services Business (2021–2026)
Figure 70. Xi'an Guolian Metrology Testing Revenue Growth Rate in Temperature Calibration Services Business (2021–2026)
Figure 71. OMEGA Engineering Revenue Growth Rate in Temperature Calibration Services Business (2021–2026)
Figure 72. Isothermal Technology Revenue Growth Rate in Temperature Calibration Services Business (2021–2026)
Figure 73. CHINO Corporation Revenue Growth Rate in Temperature Calibration Services Business (2021–2026)
Figure 74. Bottom-up and Top-down Approaches for This Report
Figure 75. Data Triangulation
Figure 76. Key Executives Interviewed