List of Tables
Table 1. Global Two-Dimensional (2D) Nanostructured Materials Market Value by Type (US$ Million), 2025 vs 2032
Table 2. Global Two-Dimensional (2D) Nanostructured Materials Market Value by Preparation Methods (US$ Million), 2025 vs 2032
Table 3. Global Two-Dimensional (2D) Nanostructured Materials Market Value by Functional Properties (US$ Million), 2025 vs 2032
Table 4. Global Two-Dimensional (2D) Nanostructured Materials Market Value by Application (US$ Million), 2025 vs 2032
Table 5. Global Two-Dimensional (2D) Nanostructured Materials Production Capacity (Tons) by Manufacturers in 2025
Table 6. Global Two-Dimensional (2D) Nanostructured Materials Production by Manufacturers (Tons), 2021–2026
Table 7. Global Two-Dimensional (2D) Nanostructured Materials Production Market Share by Manufacturers (2021–2026)
Table 8. Global Two-Dimensional (2D) Nanostructured Materials Production Value by Manufacturers (US$ Million), 2021–2026
Table 9. Global Two-Dimensional (2D) Nanostructured Materials Production Value Share by Manufacturers (2021–2026)
Table 10. Global Key Players of Two-Dimensional (2D) Nanostructured Materials, Industry Ranking, 2024 vs 2025
Table 11. Classification of Companies by Tier (Tier 1, Tier 2, Tier 3), based on Two-Dimensional (2D) Nanostructured Materials Production Value, 2025
Table 12. Global Market Two-Dimensional (2D) Nanostructured Materials Average Price by Manufacturers (US$/kg), 2021–2026
Table 13. Global Key Manufacturers of Two-Dimensional (2D) Nanostructured Materials, Manufacturing Footprints and Headquarters
Table 14. Global Key Manufacturers of Two-Dimensional (2D) Nanostructured Materials, Product Offerings and Applications
Table 15. Global Key Manufacturers of Two-Dimensional (2D) Nanostructured Materials, Date of Entry into the Industry
Table 16. Global Two-Dimensional (2D) Nanostructured Materials Manufacturers Market Concentration Ratio (CR5 and HHI)
Table 17. Mergers & Acquisitions and Expansion Plans
Table 18. Global Two-Dimensional (2D) Nanostructured Materials Production Value by Region: 2021 vs 2025 vs 2032 (US$ Million)
Table 19. Global Two-Dimensional (2D) Nanostructured Materials Production Value (US$ Million) by Region (2021–2026)
Table 20. Global Two-Dimensional (2D) Nanostructured Materials Production Value Market Share by Region (2021–2026)
Table 21. Global Two-Dimensional (2D) Nanostructured Materials Production Value (US$ Million) Forecast by Region (2027–2032)
Table 22. Global Two-Dimensional (2D) Nanostructured Materials Production Value Market Share Forecast by Region (2027–2032)
Table 23. Global Two-Dimensional (2D) Nanostructured Materials Production Comparison by Region: 2021 vs 2025 vs 2032 (Tons)
Table 24. Global Two-Dimensional (2D) Nanostructured Materials Production (Tons) by Region (2021–2026)
Table 25. Global Two-Dimensional (2D) Nanostructured Materials Production Market Share by Region (2021–2026)
Table 26. Global Two-Dimensional (2D) Nanostructured Materials Production (Tons) Forecast by Region (2027–2032)
Table 27. Global Two-Dimensional (2D) Nanostructured Materials Production Market Share Forecast by Region (2027–2032)
Table 28. Global Two-Dimensional (2D) Nanostructured Materials Market Average Price (US$/kg) by Region (2021–2026)
Table 29. Global Two-Dimensional (2D) Nanostructured Materials Market Average Price (US$/kg) by Region (2027–2032)
Table 30. Global Two-Dimensional (2D) Nanostructured Materials Consumption Growth Rate by Region: 2021 vs 2025 vs 2032 (Tons)
Table 31. Global Two-Dimensional (2D) Nanostructured Materials Consumption by Region (Tons), 2021–2026
Table 32. Global Two-Dimensional (2D) Nanostructured Materials Consumption Market Share by Region (2021–2026)
Table 33. Global Two-Dimensional (2D) Nanostructured Materials Forecasted Consumption by Region (Tons), 2027–2032
Table 34. Global Two-Dimensional (2D) Nanostructured Materials Forecasted Consumption Market Share by Region (2027–2032)
Table 35. North America Two-Dimensional (2D) Nanostructured Materials Consumption Growth Rate by Country: 2021 vs 2025 vs 2032 (Tons)
Table 36. North America Two-Dimensional (2D) Nanostructured Materials Consumption by Country (Tons), 2021–2026
Table 37. North America Two-Dimensional (2D) Nanostructured Materials Consumption by Country (Tons), 2027–2032
Table 38. Europe Two-Dimensional (2D) Nanostructured Materials Consumption Growth Rate by Country: 2021 vs 2025 vs 2032 (Tons)
Table 39. Europe Two-Dimensional (2D) Nanostructured Materials Consumption by Country (Tons), 2021–2026
Table 40. Europe Two-Dimensional (2D) Nanostructured Materials Consumption by Country (Tons), 2027–2032
Table 41. Asia Pacific Two-Dimensional (2D) Nanostructured Materials Consumption Growth Rate by Region: 2021 vs 2025 vs 2032 (Tons)
Table 42. Asia Pacific Two-Dimensional (2D) Nanostructured Materials Consumption by Region (Tons), 2021–2026
Table 43. Asia Pacific Two-Dimensional (2D) Nanostructured Materials Consumption by Region (Tons), 2027–2032
Table 44. Latin America, Middle East & Africa Two-Dimensional (2D) Nanostructured Materials Consumption Growth Rate by Country: 2021 vs 2025 vs 2032 (Tons)
Table 45. Latin America, Middle East & Africa Two-Dimensional (2D) Nanostructured Materials Consumption by Country (Tons), 2021–2026
Table 46. Latin America, Middle East & Africa Two-Dimensional (2D) Nanostructured Materials Consumption by Country (Tons), 2027–2032
Table 47. Global Two-Dimensional (2D) Nanostructured Materials Production (Tons) by Type (2021–2026)
Table 48. Global Two-Dimensional (2D) Nanostructured Materials Production (Tons) by Type (2027–2032)
Table 49. Global Two-Dimensional (2D) Nanostructured Materials Production Market Share by Type (2021–2026)
Table 50. Global Two-Dimensional (2D) Nanostructured Materials Production Market Share by Type (2027–2032)
Table 51. Global Two-Dimensional (2D) Nanostructured Materials Production Value (US$ Million) by Type (2021–2026)
Table 52. Global Two-Dimensional (2D) Nanostructured Materials Production Value (US$ Million) by Type (2027–2032)
Table 53. Global Two-Dimensional (2D) Nanostructured Materials Production Value Market Share by Type (2021–2026)
Table 54. Global Two-Dimensional (2D) Nanostructured Materials Production Value Market Share by Type (2027–2032)
Table 55. Global Two-Dimensional (2D) Nanostructured Materials Price (US$/kg) by Type (2021–2026)
Table 56. Global Two-Dimensional (2D) Nanostructured Materials Price (US$/kg) by Type (2027–2032)
Table 57. Global Two-Dimensional (2D) Nanostructured Materials Production (Tons) by Application (2021–2026)
Table 58. Global Two-Dimensional (2D) Nanostructured Materials Production (Tons) by Application (2027–2032)
Table 59. Global Two-Dimensional (2D) Nanostructured Materials Production Market Share by Application (2021–2026)
Table 60. Global Two-Dimensional (2D) Nanostructured Materials Production Market Share by Application (2027–2032)
Table 61. Global Two-Dimensional (2D) Nanostructured Materials Production Value (US$ Million) by Application (2021–2026)
Table 62. Global Two-Dimensional (2D) Nanostructured Materials Production Value (US$ Million) by Application (2027–2032)
Table 63. Global Two-Dimensional (2D) Nanostructured Materials Production Value Market Share by Application (2021–2026)
Table 64. Global Two-Dimensional (2D) Nanostructured Materials Production Value Market Share by Application (2027–2032)
Table 65. Global Two-Dimensional (2D) Nanostructured Materials Price (US$/kg) by Application (2021–2026)
Table 66. Global Two-Dimensional (2D) Nanostructured Materials Price (US$/kg) by Application (2027–2032)
Table 67. NanoXplore Two-Dimensional (2D) Nanostructured Materials Company Information
Table 68. NanoXplore Two-Dimensional (2D) Nanostructured Materials Specification and Application
Table 69. NanoXplore Two-Dimensional (2D) Nanostructured Materials Production (Tons), Value (US$ Million), Price (US$/kg) and Gross Margin (2021–2026)
Table 70. NanoXplore Main Business and Markets Served
Table 71. NanoXplore Recent Developments/Updates
Table 72. The Sixth Element (Changzhou) Materials Technology Co., Ltd. Two-Dimensional (2D) Nanostructured Materials Company Information
Table 73. The Sixth Element (Changzhou) Materials Technology Co., Ltd. Two-Dimensional (2D) Nanostructured Materials Specification and Application
Table 74. The Sixth Element (Changzhou) Materials Technology Co., Ltd. Two-Dimensional (2D) Nanostructured Materials Production (Tons), Value (US$ Million), Price (US$/kg) and Gross Margin (2021–2026)
Table 75. The Sixth Element (Changzhou) Materials Technology Co., Ltd. Main Business and Markets Served
Table 76. The Sixth Element (Changzhou) Materials Technology Co., Ltd. Recent Developments/Updates
Table 77. Graphenea Two-Dimensional (2D) Nanostructured Materials Company Information
Table 78. Graphenea Two-Dimensional (2D) Nanostructured Materials Specification and Application
Table 79. Graphenea Two-Dimensional (2D) Nanostructured Materials Production (Tons), Value (US$ Million), Price (US$/kg) and Gross Margin (2021–2026)
Table 80. Graphenea Main Business and Markets Served
Table 81. Graphenea Recent Developments/Updates
Table 82. First Graphene Two-Dimensional (2D) Nanostructured Materials Company Information
Table 83. First Graphene Two-Dimensional (2D) Nanostructured Materials Specification and Application
Table 84. First Graphene Two-Dimensional (2D) Nanostructured Materials Production (Tons), Value (US$ Million), Price (US$/kg) and Gross Margin (2021–2026)
Table 85. First Graphene Main Business and Markets Served
Table 86. First Graphene Recent Developments/Updates
Table 87. Avanzare Innovacion Tecnologica S.L. Two-Dimensional (2D) Nanostructured Materials Company Information
Table 88. Avanzare Innovacion Tecnologica S.L. Two-Dimensional (2D) Nanostructured Materials Specification and Application
Table 89. Avanzare Innovacion Tecnologica S.L. Two-Dimensional (2D) Nanostructured Materials Production (Tons), Value (US$ Million), Price (US$/kg) and Gross Margin (2021–2026)
Table 90. Avanzare Innovacion Tecnologica S.L. Main Business and Markets Served
Table 91. Avanzare Innovacion Tecnologica S.L. Recent Developments/Updates
Table 92. Global Graphene Group Two-Dimensional (2D) Nanostructured Materials Company Information
Table 93. Global Graphene Group Two-Dimensional (2D) Nanostructured Materials Specification and Application
Table 94. Global Graphene Group Two-Dimensional (2D) Nanostructured Materials Production (Tons), Value (US$ Million), Price (US$/kg) and Gross Margin (2021–2026)
Table 95. Global Graphene Group Main Business and Markets Served
Table 96. Global Graphene Group Recent Developments/Updates
Table 97. Directa Plus S.p.A. Two-Dimensional (2D) Nanostructured Materials Company Information
Table 98. Directa Plus S.p.A. Two-Dimensional (2D) Nanostructured Materials Specification and Application
Table 99. Directa Plus S.p.A. Two-Dimensional (2D) Nanostructured Materials Production (Tons), Value (US$ Million), Price (US$/kg) and Gross Margin (2021–2026)
Table 100. Directa Plus S.p.A. Main Business and Markets Served
Table 101. Directa Plus S.p.A. Recent Developments/Updates
Table 102. Haydale Graphene Industries plc Two-Dimensional (2D) Nanostructured Materials Company Information
Table 103. Haydale Graphene Industries plc Two-Dimensional (2D) Nanostructured Materials Specification and Application
Table 104. Haydale Graphene Industries plc Two-Dimensional (2D) Nanostructured Materials Production (Tons), Value (US$ Million), Price (US$/kg) and Gross Margin (2021–2026)
Table 105. Haydale Graphene Industries plc Main Business and Markets Served
Table 106. Haydale Graphene Industries plc Recent Developments/Updates
Table 107. Xiamen Knano Graphene Technology Co., Ltd. Two-Dimensional (2D) Nanostructured Materials Company Information
Table 108. Xiamen Knano Graphene Technology Co., Ltd. Two-Dimensional (2D) Nanostructured Materials Specification and Application
Table 109. Xiamen Knano Graphene Technology Co., Ltd. Two-Dimensional (2D) Nanostructured Materials Production (Tons), Value (US$ Million), Price (US$/kg) and Gross Margin (2021–2026)
Table 110. Xiamen Knano Graphene Technology Co., Ltd. Main Business and Markets Served
Table 111. Xiamen Knano Graphene Technology Co., Ltd. Recent Developments/Updates
Table 112. Universal Matter Inc. Two-Dimensional (2D) Nanostructured Materials Company Information
Table 113. Universal Matter Inc. Two-Dimensional (2D) Nanostructured Materials Specification and Application
Table 114. Universal Matter Inc. Two-Dimensional (2D) Nanostructured Materials Production (Tons), Value (US$ Million), Price (US$/kg) and Gross Margin (2021–2026)
Table 115. Universal Matter Inc. Main Business and Markets Served
Table 116. Universal Matter Inc. Recent Developments/Updates
Table 117. Thomas Swan & Co. Ltd. Two-Dimensional (2D) Nanostructured Materials Company Information
Table 118. Thomas Swan & Co. Ltd. Two-Dimensional (2D) Nanostructured Materials Specification and Application
Table 119. Thomas Swan & Co. Ltd. Two-Dimensional (2D) Nanostructured Materials Production (Tons), Value (US$ Million), Price (US$/kg) and Gross Margin (2021–2026)
Table 120. Thomas Swan & Co. Ltd. Main Business and Markets Served
Table 121. Thomas Swan & Co. Ltd. Recent Developments/Updates
Table 122. Danish Graphene ApS Two-Dimensional (2D) Nanostructured Materials Company Information
Table 123. Danish Graphene ApS Two-Dimensional (2D) Nanostructured Materials Specification and Application
Table 124. Danish Graphene ApS Two-Dimensional (2D) Nanostructured Materials Production (Tons), Value (US$ Million), Price (US$/kg) and Gross Margin (2021–2026)
Table 125. Danish Graphene ApS Main Business and Markets Served
Table 126. Danish Graphene ApS Recent Developments/Updates
Table 127. Wuxi Graphene Film Two-Dimensional (2D) Nanostructured Materials Company Information
Table 128. Wuxi Graphene Film Two-Dimensional (2D) Nanostructured Materials Specification and Application
Table 129. Wuxi Graphene Film Two-Dimensional (2D) Nanostructured Materials Production (Tons), Value (US$ Million), Price (US$/kg) and Gross Margin (2021–2026)
Table 130. Wuxi Graphene Film Main Business and Markets Served
Table 131. Wuxi Graphene Film Recent Developments/Updates
Table 132. Angstron Materials Two-Dimensional (2D) Nanostructured Materials Company Information
Table 133. Angstron Materials Two-Dimensional (2D) Nanostructured Materials Specification and Application
Table 134. Angstron Materials Two-Dimensional (2D) Nanostructured Materials Production (Tons), Value (US$ Million), Price (US$/kg) and Gross Margin (2021–2026)
Table 135. Angstron Materials Main Business and Markets Served
Table 136. Angstron Materials Recent Developments/Updates
Table 137. Taiwan Graphene Company Two-Dimensional (2D) Nanostructured Materials Company Information
Table 138. Taiwan Graphene Company Two-Dimensional (2D) Nanostructured Materials Specification and Application
Table 139. Taiwan Graphene Company Two-Dimensional (2D) Nanostructured Materials Production (Tons), Value (US$ Million), Price (US$/kg) and Gross Margin (2021–2026)
Table 140. Taiwan Graphene Company Main Business and Markets Served
Table 141. Taiwan Graphene Company Recent Developments/Updates
Table 142. BeDimensional S.p.A. Two-Dimensional (2D) Nanostructured Materials Company Information
Table 143. BeDimensional S.p.A. Two-Dimensional (2D) Nanostructured Materials Specification and Application
Table 144. BeDimensional S.p.A. Two-Dimensional (2D) Nanostructured Materials Production (Tons), Value (US$ Million), Price (US$/kg) and Gross Margin (2021–2026)
Table 145. BeDimensional S.p.A. Main Business and Markets Served
Table 146. BeDimensional S.p.A. Recent Developments/Updates
Table 147. Graphene Manufacturing Group Ltd. Two-Dimensional (2D) Nanostructured Materials Company Information
Table 148. Graphene Manufacturing Group Ltd. Two-Dimensional (2D) Nanostructured Materials Specification and Application
Table 149. Graphene Manufacturing Group Ltd. Two-Dimensional (2D) Nanostructured Materials Production (Tons), Value (US$ Million), Price (US$/kg) and Gross Margin (2021–2026)
Table 150. Graphene Manufacturing Group Ltd. Main Business and Markets Served
Table 151. Graphene Manufacturing Group Ltd. Recent Developments/Updates
Table 152. Nanografi Nano Technology Two-Dimensional (2D) Nanostructured Materials Company Information
Table 153. Nanografi Nano Technology Two-Dimensional (2D) Nanostructured Materials Specification and Application
Table 154. Nanografi Nano Technology Two-Dimensional (2D) Nanostructured Materials Production (Tons), Value (US$ Million), Price (US$/kg) and Gross Margin (2021–2026)
Table 155. Nanografi Nano Technology Main Business and Markets Served
Table 156. Nanografi Nano Technology Recent Developments/Updates
Table 157. HQ Graphene Two-Dimensional (2D) Nanostructured Materials Company Information
Table 158. HQ Graphene Two-Dimensional (2D) Nanostructured Materials Specification and Application
Table 159. HQ Graphene Two-Dimensional (2D) Nanostructured Materials Production (Tons), Value (US$ Million), Price (US$/kg) and Gross Margin (2021–2026)
Table 160. HQ Graphene Main Business and Markets Served
Table 161. HQ Graphene Recent Developments/Updates
Table 162. 2D Semiconductors, Inc. Two-Dimensional (2D) Nanostructured Materials Company Information
Table 163. 2D Semiconductors, Inc. Two-Dimensional (2D) Nanostructured Materials Specification and Application
Table 164. 2D Semiconductors, Inc. Two-Dimensional (2D) Nanostructured Materials Production (Tons), Value (US$ Million), Price (US$/kg) and Gross Margin (2021–2026)
Table 165. 2D Semiconductors, Inc. Main Business and Markets Served
Table 166. 2D Semiconductors, Inc. Recent Developments/Updates
Table 167. 2D fab Two-Dimensional (2D) Nanostructured Materials Company Information
Table 168. 2D fab Two-Dimensional (2D) Nanostructured Materials Specification and Application
Table 169. 2D fab Two-Dimensional (2D) Nanostructured Materials Production (Tons), Value (US$ Million), Price (US$/kg) and Gross Margin (2021–2026)
Table 170. 2D fab Main Business and Markets Served
Table 171. 2D fab Recent Developments/Updates
Table 172. Levidian Two-Dimensional (2D) Nanostructured Materials Company Information
Table 173. Levidian Two-Dimensional (2D) Nanostructured Materials Specification and Application
Table 174. Levidian Two-Dimensional (2D) Nanostructured Materials Production (Tons), Value (US$ Million), Price (US$/kg) and Gross Margin (2021–2026)
Table 175. Levidian Main Business and Markets Served
Table 176. Levidian Recent Developments/Updates
Table 177. General Graphene Two-Dimensional (2D) Nanostructured Materials Company Information
Table 178. General Graphene Two-Dimensional (2D) Nanostructured Materials Specification and Application
Table 179. General Graphene Two-Dimensional (2D) Nanostructured Materials Production (Tons), Value (US$ Million), Price (US$/kg) and Gross Margin (2021–2026)
Table 180. General Graphene Main Business and Markets Served
Table 181. General Graphene Recent Developments/Updates
Table 182. Zentek Ltd. Two-Dimensional (2D) Nanostructured Materials Company Information
Table 183. Zentek Ltd. Two-Dimensional (2D) Nanostructured Materials Specification and Application
Table 184. Zentek Ltd. Two-Dimensional (2D) Nanostructured Materials Production (Tons), Value (US$ Million), Price (US$/kg) and Gross Margin (2021–2026)
Table 185. Zentek Ltd. Main Business and Markets Served
Table 186. Zentek Ltd. Recent Developments/Updates
Table 187. Key Raw Materials Lists
Table 188. Raw Materials Key Suppliers Lists
Table 189. Two-Dimensional (2D) Nanostructured Materials Distributors List
Table 190. Two-Dimensional (2D) Nanostructured Materials Customers List
Table 191. Two-Dimensional (2D) Nanostructured Materials Market Trends
Table 192. Two-Dimensional (2D) Nanostructured Materials Market Drivers
Table 193. Two-Dimensional (2D) Nanostructured Materials Market Challenges
Table 194. Two-Dimensional (2D) Nanostructured Materials Market Restraints
Table 195. Research Programs/Design for This Report
Table 196. Key Data Information from Secondary Sources
Table 197. Key Data Information from Primary Sources
Table 198. Authors List of This Report
List of Figures
Figure 1. Product Picture of Two-Dimensional (2D) Nanostructured Materials
Figure 2. Global Two-Dimensional (2D) Nanostructured Materials Market Value by Type (US$ Million), 2021–2032
Figure 3. Global Two-Dimensional (2D) Nanostructured Materials Market Share by Type: 2025 vs 2032
Figure 4. Graphene and Its Derivatives Product Picture
Figure 5. Transition Metal Chalcogenides (TMDs) Product Picture
Figure 6. Layered Metal Oxides Product Picture
Figure 7. Two-Dimensional Nonmetallic Compounds Product Picture
Figure 8. Two-Dimensional Organic/Inorganic Hybrid Materials Product Picture
Figure 9. Global Two-Dimensional (2D) Nanostructured Materials Market Value by Preparation Methods (US$ Million), 2021–2032
Figure 10. Global Two-Dimensional (2D) Nanostructured Materials Market Share by Preparation Methods: 2025 vs 2032
Figure 11. Top-Down Method Product Picture
Figure 12. Bottom-up Method Product Picture
Figure 13. Global Two-Dimensional (2D) Nanostructured Materials Market Value by Functional Properties (US$ Million), 2021–2032
Figure 14. Global Two-Dimensional (2D) Nanostructured Materials Market Share by Functional Properties: 2025 vs 2032
Figure 15. Conductive Product Picture
Figure 16. Semiconductor Product Picture
Figure 17. Insulating Product Picture
Figure 18. Magnetic Product Picture
Figure 19. Catalytic Product Picture
Figure 20. Global Two-Dimensional (2D) Nanostructured Materials Market Value by Application (US$ Million), 2021–2032
Figure 21. Global Two-Dimensional (2D) Nanostructured Materials Market Share by Application: 2025 vs 2032
Figure 22. Electronic Information and Optoelectronic Devices
Figure 23. Energy Storage and Conversion
Figure 24. Environmental Governance
Figure 25. Biomedicine
Figure 26. Advanced Composite Materials
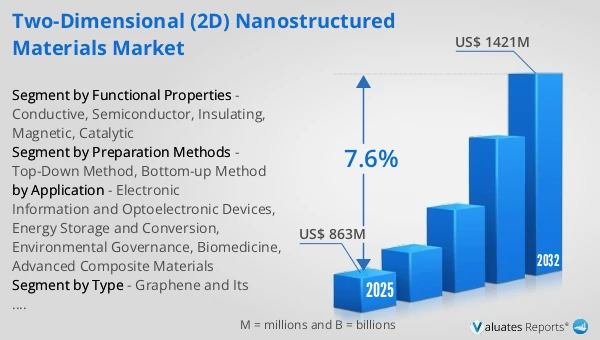
Figure 27. Global Two-Dimensional (2D) Nanostructured Materials Production Value (US$ Million), 2021 vs 2025 vs 2032
Figure 28. Global Two-Dimensional (2D) Nanostructured Materials Production Value (US$ Million), 2021–2032
Figure 29. Global Two-Dimensional (2D) Nanostructured Materials Production Capacity (Tons), 2021–2032
Figure 30. Global Two-Dimensional (2D) Nanostructured Materials Production (Tons), 2021–2032
Figure 31. Global Two-Dimensional (2D) Nanostructured Materials Average Price (US$/kg), 2021–2032
Figure 32. Two-Dimensional (2D) Nanostructured Materials Report Years Considered
Figure 33. Two-Dimensional (2D) Nanostructured Materials Production Share by Manufacturers in 2025
Figure 34. Global Two-Dimensional (2D) Nanostructured Materials Production Value Share by Manufacturers (2025)
Figure 35. Two-Dimensional (2D) Nanostructured Materials Market Share by Company Type (Tier 1, Tier 2, and Tier 3): 2021 vs 2025
Figure 36. Top 5 and Top 10 Global Players: Market Share by Two-Dimensional (2D) Nanostructured Materials Revenue in 2025
Figure 37. Global Two-Dimensional (2D) Nanostructured Materials Production Value by Region: 2021 vs 2025 vs 2032 (US$ Million)
Figure 38. Global Two-Dimensional (2D) Nanostructured Materials Production Value Market Share by Region: 2021 vs 2025 vs 2032
Figure 39. Global Two-Dimensional (2D) Nanostructured Materials Production Comparison by Region: 2021 vs 2025 vs 2032 (Tons)
Figure 40. Global Two-Dimensional (2D) Nanostructured Materials Production Market Share by Region: 2021 vs 2025 vs 2032
Figure 41. North America Two-Dimensional (2D) Nanostructured Materials Production Value (US$ Million) Growth Rate (2021–2032)
Figure 42. Europe Two-Dimensional (2D) Nanostructured Materials Production Value (US$ Million) Growth Rate (2021–2032)
Figure 43. China Two-Dimensional (2D) Nanostructured Materials Production Value (US$ Million) Growth Rate (2021–2032)
Figure 44. Japan Two-Dimensional (2D) Nanostructured Materials Production Value (US$ Million) Growth Rate (2021–2032)
Figure 45. Global Two-Dimensional (2D) Nanostructured Materials Consumption by Region: 2021 vs 2025 vs 2032 (Tons)
Figure 46. Global Two-Dimensional (2D) Nanostructured Materials Consumption Market Share by Region: 2021 vs 2025 vs 2032
Figure 47. North America Two-Dimensional (2D) Nanostructured Materials Consumption and Growth Rate (Tons), 2021–2032
Figure 48. North America Two-Dimensional (2D) Nanostructured Materials Consumption Market Share by Country (2021–2032)
Figure 49. U.S. Two-Dimensional (2D) Nanostructured Materials Consumption and Growth Rate (Tons), 2021–2032
Figure 50. Canada Two-Dimensional (2D) Nanostructured Materials Consumption and Growth Rate (Tons), 2021–2032
Figure 51. Europe Two-Dimensional (2D) Nanostructured Materials Consumption and Growth Rate (Tons), 2021–2032
Figure 52. Europe Two-Dimensional (2D) Nanostructured Materials Consumption Market Share by Country (2021–2032)
Figure 53. Germany Two-Dimensional (2D) Nanostructured Materials Consumption and Growth Rate (Tons), 2021–2032
Figure 54. France Two-Dimensional (2D) Nanostructured Materials Consumption and Growth Rate (Tons), 2021–2032
Figure 55. U.K. Two-Dimensional (2D) Nanostructured Materials Consumption and Growth Rate (Tons), 2021–2032
Figure 56. Italy Two-Dimensional (2D) Nanostructured Materials Consumption and Growth Rate (Tons), 2021–2032
Figure 57. Russia Two-Dimensional (2D) Nanostructured Materials Consumption and Growth Rate (Tons), 2021–2032
Figure 58. Asia Pacific Two-Dimensional (2D) Nanostructured Materials Consumption and Growth Rate (Tons), 2021–2032
Figure 59. Asia Pacific Two-Dimensional (2D) Nanostructured Materials Consumption Market Share by Region (2021–2032)
Figure 60. China Two-Dimensional (2D) Nanostructured Materials Consumption and Growth Rate (Tons), 2021–2032
Figure 61. Japan Two-Dimensional (2D) Nanostructured Materials Consumption and Growth Rate (Tons), 2021–2032
Figure 62. South Korea Two-Dimensional (2D) Nanostructured Materials Consumption and Growth Rate (Tons), 2021–2032
Figure 63. China Taiwan Two-Dimensional (2D) Nanostructured Materials Consumption and Growth Rate (Tons), 2021–2032
Figure 64. Southeast Asia Two-Dimensional (2D) Nanostructured Materials Consumption and Growth Rate (Tons), 2021–2032
Figure 65. India Two-Dimensional (2D) Nanostructured Materials Consumption and Growth Rate (Tons), 2021–2032
Figure 66. Latin America, Middle East & Africa Two-Dimensional (2D) Nanostructured Materials Consumption and Growth Rate (Tons), 2021–2032
Figure 67. Latin America, Middle East & Africa Two-Dimensional (2D) Nanostructured Materials Consumption Market Share by Country (2021–2032)
Figure 68. Mexico Two-Dimensional (2D) Nanostructured Materials Consumption and Growth Rate (Tons), 2021–2032
Figure 69. Brazil Two-Dimensional (2D) Nanostructured Materials Consumption and Growth Rate (Tons), 2021–2032
Figure 70. Turkey Two-Dimensional (2D) Nanostructured Materials Consumption and Growth Rate (Tons), 2021–2032
Figure 71. GCC Countries Two-Dimensional (2D) Nanostructured Materials Consumption and Growth Rate (Tons), 2021–2032
Figure 72. Global Production Market Share of Two-Dimensional (2D) Nanostructured Materials by Type (2021–2032)
Figure 73. Global Production Value Market Share of Two-Dimensional (2D) Nanostructured Materials by Type (2021–2032)
Figure 74. Global Two-Dimensional (2D) Nanostructured Materials Price (US$/kg) by Type (2021–2032)
Figure 75. Global Production Market Share of Two-Dimensional (2D) Nanostructured Materials by Application (2021–2032)
Figure 76. Global Production Value Market Share of Two-Dimensional (2D) Nanostructured Materials by Application (2021–2032)
Figure 77. Global Two-Dimensional (2D) Nanostructured Materials Price (US$/kg) by Application (2021–2032)
Figure 78. Two-Dimensional (2D) Nanostructured Materials Value Chain
Figure 79. Channels of Distribution (Direct Vs Distribution)
Figure 80. Bottom-up and Top-down Approaches for This Report
Figure 81. Data Triangulation