List of Tables
Table 1. Global Pesticide Active Ingredients Market Value by Pesticide Type (US$ Million), 2025 vs 2032
Table 2. Global Pesticide Active Ingredients Market Value by Origin (US$ Million), 2025 vs 2032
Table 3. Global Pesticide Active Ingredients Market Value by Active Substance Form (US$ Million), 2025 vs 2032
Table 4. Global Pesticide Active Ingredients Market Value by Phase-Out Status (US$ Million), 2025 vs 2032
Table 5. Global Pesticide Active Ingredients Market Value by Application (US$ Million), 2025 vs 2032
Table 6. Global Pesticide Active Ingredients Production Capacity (Kilotons) by Manufacturers in 2025
Table 7. Global Pesticide Active Ingredients Production by Manufacturers (Kilotons), 2021–2026
Table 8. Global Pesticide Active Ingredients Production Market Share by Manufacturers (2021–2026)
Table 9. Global Pesticide Active Ingredients Production Value by Manufacturers (US$ Million), 2021–2026
Table 10. Global Pesticide Active Ingredients Production Value Share by Manufacturers (2021–2026)
Table 11. Global Key Players of Pesticide Active Ingredients, Industry Ranking, 2024 vs 2025
Table 12. Classification of Companies by Tier (Tier 1, Tier 2, Tier 3), based on Pesticide Active Ingredients Production Value, 2025
Table 13. Global Market Pesticide Active Ingredients Average Price by Manufacturers (US$/Ton), 2021–2026
Table 14. Global Key Manufacturers of Pesticide Active Ingredients, Manufacturing Footprints and Headquarters
Table 15. Global Key Manufacturers of Pesticide Active Ingredients, Product Offerings and Applications
Table 16. Global Key Manufacturers of Pesticide Active Ingredients, Date of Entry into the Industry
Table 17. Global Pesticide Active Ingredients Manufacturers Market Concentration Ratio (CR5 and HHI)
Table 18. Mergers & Acquisitions and Expansion Plans
Table 19. Global Pesticide Active Ingredients Production Value by Region: 2021 vs 2025 vs 2032 (US$ Million)
Table 20. Global Pesticide Active Ingredients Production Value (US$ Million) by Region (2021–2026)
Table 21. Global Pesticide Active Ingredients Production Value Market Share by Region (2021–2026)
Table 22. Global Pesticide Active Ingredients Production Value (US$ Million) Forecast by Region (2027–2032)
Table 23. Global Pesticide Active Ingredients Production Value Market Share Forecast by Region (2027–2032)
Table 24. Global Pesticide Active Ingredients Production Comparison by Region: 2021 vs 2025 vs 2032 (Kilotons)
Table 25. Global Pesticide Active Ingredients Production (Kilotons) by Region (2021–2026)
Table 26. Global Pesticide Active Ingredients Production Market Share by Region (2021–2026)
Table 27. Global Pesticide Active Ingredients Production (Kilotons) Forecast by Region (2027–2032)
Table 28. Global Pesticide Active Ingredients Production Market Share Forecast by Region (2027–2032)
Table 29. Global Pesticide Active Ingredients Market Average Price (US$/Ton) by Region (2021–2026)
Table 30. Global Pesticide Active Ingredients Market Average Price (US$/Ton) by Region (2027–2032)
Table 31. Global Pesticide Active Ingredients Consumption Growth Rate by Region: 2021 vs 2025 vs 2032 (Kilotons)
Table 32. Global Pesticide Active Ingredients Consumption by Region (Kilotons), 2021–2026
Table 33. Global Pesticide Active Ingredients Consumption Market Share by Region (2021–2026)
Table 34. Global Pesticide Active Ingredients Forecasted Consumption by Region (Kilotons), 2027–2032
Table 35. Global Pesticide Active Ingredients Forecasted Consumption Market Share by Region (2027–2032)
Table 36. North America Pesticide Active Ingredients Consumption Growth Rate by Country: 2021 vs 2025 vs 2032 (Kilotons)
Table 37. North America Pesticide Active Ingredients Consumption by Country (Kilotons), 2021–2026
Table 38. North America Pesticide Active Ingredients Consumption by Country (Kilotons), 2027–2032
Table 39. Europe Pesticide Active Ingredients Consumption Growth Rate by Country: 2021 vs 2025 vs 2032 (Kilotons)
Table 40. Europe Pesticide Active Ingredients Consumption by Country (Kilotons), 2021–2026
Table 41. Europe Pesticide Active Ingredients Consumption by Country (Kilotons), 2027–2032
Table 42. Asia Pacific Pesticide Active Ingredients Consumption Growth Rate by Region: 2021 vs 2025 vs 2032 (Kilotons)
Table 43. Asia Pacific Pesticide Active Ingredients Consumption by Region (Kilotons), 2021–2026
Table 44. Asia Pacific Pesticide Active Ingredients Consumption by Region (Kilotons), 2027–2032
Table 45. Latin America, Middle East & Africa Pesticide Active Ingredients Consumption Growth Rate by Country: 2021 vs 2025 vs 2032 (Kilotons)
Table 46. Latin America, Middle East & Africa Pesticide Active Ingredients Consumption by Country (Kilotons), 2021–2026
Table 47. Latin America, Middle East & Africa Pesticide Active Ingredients Consumption by Country (Kilotons), 2027–2032
Table 48. Global Pesticide Active Ingredients Production (Kilotons) by Pesticide Type (2021–2026)
Table 49. Global Pesticide Active Ingredients Production (Kilotons) by Pesticide Type (2027–2032)
Table 50. Global Pesticide Active Ingredients Production Market Share by Pesticide Type (2021–2026)
Table 51. Global Pesticide Active Ingredients Production Market Share by Pesticide Type (2027–2032)
Table 52. Global Pesticide Active Ingredients Production Value (US$ Million) by Pesticide Type (2021–2026)
Table 53. Global Pesticide Active Ingredients Production Value (US$ Million) by Pesticide Type (2027–2032)
Table 54. Global Pesticide Active Ingredients Production Value Market Share by Pesticide Type (2021–2026)
Table 55. Global Pesticide Active Ingredients Production Value Market Share by Pesticide Type (2027–2032)
Table 56. Global Pesticide Active Ingredients Price (US$/Ton) by Pesticide Type (2021–2026)
Table 57. Global Pesticide Active Ingredients Price (US$/Ton) by Pesticide Type (2027–2032)
Table 58. Global Pesticide Active Ingredients Production (Kilotons) by Application (2021–2026)
Table 59. Global Pesticide Active Ingredients Production (Kilotons) by Application (2027–2032)
Table 60. Global Pesticide Active Ingredients Production Market Share by Application (2021–2026)
Table 61. Global Pesticide Active Ingredients Production Market Share by Application (2027–2032)
Table 62. Global Pesticide Active Ingredients Production Value (US$ Million) by Application (2021–2026)
Table 63. Global Pesticide Active Ingredients Production Value (US$ Million) by Application (2027–2032)
Table 64. Global Pesticide Active Ingredients Production Value Market Share by Application (2021–2026)
Table 65. Global Pesticide Active Ingredients Production Value Market Share by Application (2027–2032)
Table 66. Global Pesticide Active Ingredients Price (US$/Ton) by Application (2021–2026)
Table 67. Global Pesticide Active Ingredients Price (US$/Ton) by Application (2027–2032)
Table 68. Syngenta Group Pesticide Active Ingredients Company Information
Table 69. Syngenta Group Pesticide Active Ingredients Specification and Application
Table 70. Syngenta Group Pesticide Active Ingredients Production (Kilotons), Value (US$ Million), Price (US$/Ton) and Gross Margin (2021–2026)
Table 71. Syngenta Group Main Business and Markets Served
Table 72. Syngenta Group Recent Developments/Updates
Table 73. Bayer Pesticide Active Ingredients Company Information
Table 74. Bayer Pesticide Active Ingredients Specification and Application
Table 75. Bayer Pesticide Active Ingredients Production (Kilotons), Value (US$ Million), Price (US$/Ton) and Gross Margin (2021–2026)
Table 76. Bayer Main Business and Markets Served
Table 77. Bayer Recent Developments/Updates
Table 78. BASF Pesticide Active Ingredients Company Information
Table 79. BASF Pesticide Active Ingredients Specification and Application
Table 80. BASF Pesticide Active Ingredients Production (Kilotons), Value (US$ Million), Price (US$/Ton) and Gross Margin (2021–2026)
Table 81. BASF Main Business and Markets Served
Table 82. BASF Recent Developments/Updates
Table 83. Corteva Pesticide Active Ingredients Company Information
Table 84. Corteva Pesticide Active Ingredients Specification and Application
Table 85. Corteva Pesticide Active Ingredients Production (Kilotons), Value (US$ Million), Price (US$/Ton) and Gross Margin (2021–2026)
Table 86. Corteva Main Business and Markets Served
Table 87. Corteva Recent Developments/Updates
Table 88. FMC Pesticide Active Ingredients Company Information
Table 89. FMC Pesticide Active Ingredients Specification and Application
Table 90. FMC Pesticide Active Ingredients Production (Kilotons), Value (US$ Million), Price (US$/Ton) and Gross Margin (2021–2026)
Table 91. FMC Main Business and Markets Served
Table 92. FMC Recent Developments/Updates
Table 93. UPL Pesticide Active Ingredients Company Information
Table 94. UPL Pesticide Active Ingredients Specification and Application
Table 95. UPL Pesticide Active Ingredients Production (Kilotons), Value (US$ Million), Price (US$/Ton) and Gross Margin (2021–2026)
Table 96. UPL Main Business and Markets Served
Table 97. UPL Recent Developments/Updates
Table 98. ADAMA Pesticide Active Ingredients Company Information
Table 99. ADAMA Pesticide Active Ingredients Specification and Application
Table 100. ADAMA Pesticide Active Ingredients Production (Kilotons), Value (US$ Million), Price (US$/Ton) and Gross Margin (2021–2026)
Table 101. ADAMA Main Business and Markets Served
Table 102. ADAMA Recent Developments/Updates
Table 103. Albaugh Pesticide Active Ingredients Company Information
Table 104. Albaugh Pesticide Active Ingredients Specification and Application
Table 105. Albaugh Pesticide Active Ingredients Production (Kilotons), Value (US$ Million), Price (US$/Ton) and Gross Margin (2021–2026)
Table 106. Albaugh Main Business and Markets Served
Table 107. Albaugh Recent Developments/Updates
Table 108. Sipcam Oxon Pesticide Active Ingredients Company Information
Table 109. Sipcam Oxon Pesticide Active Ingredients Specification and Application
Table 110. Sipcam Oxon Pesticide Active Ingredients Production (Kilotons), Value (US$ Million), Price (US$/Ton) and Gross Margin (2021–2026)
Table 111. Sipcam Oxon Main Business and Markets Served
Table 112. Sipcam Oxon Recent Developments/Updates
Table 113. Nufarm Pesticide Active Ingredients Company Information
Table 114. Nufarm Pesticide Active Ingredients Specification and Application
Table 115. Nufarm Pesticide Active Ingredients Production (Kilotons), Value (US$ Million), Price (US$/Ton) and Gross Margin (2021–2026)
Table 116. Nufarm Main Business and Markets Served
Table 117. Nufarm Recent Developments/Updates
Table 118. Sumitomo Chemical Pesticide Active Ingredients Company Information
Table 119. Sumitomo Chemical Pesticide Active Ingredients Specification and Application
Table 120. Sumitomo Chemical Pesticide Active Ingredients Production (Kilotons), Value (US$ Million), Price (US$/Ton) and Gross Margin (2021–2026)
Table 121. Sumitomo Chemical Main Business and Markets Served
Table 122. Sumitomo Chemical Recent Developments/Updates
Table 123. Nissan Chemical Pesticide Active Ingredients Company Information
Table 124. Nissan Chemical Pesticide Active Ingredients Specification and Application
Table 125. Nissan Chemical Pesticide Active Ingredients Production (Kilotons), Value (US$ Million), Price (US$/Ton) and Gross Margin (2021–2026)
Table 126. Nissan Chemical Main Business and Markets Served
Table 127. Nissan Chemical Recent Developments/Updates
Table 128. Ishihara Sangyo Kaisha Pesticide Active Ingredients Company Information
Table 129. Ishihara Sangyo Kaisha Pesticide Active Ingredients Specification and Application
Table 130. Ishihara Sangyo Kaisha Pesticide Active Ingredients Production (Kilotons), Value (US$ Million), Price (US$/Ton) and Gross Margin (2021–2026)
Table 131. Ishihara Sangyo Kaisha Main Business and Markets Served
Table 132. Ishihara Sangyo Kaisha Recent Developments/Updates
Table 133. Kumiai Chemical Industry Pesticide Active Ingredients Company Information
Table 134. Kumiai Chemical Industry Pesticide Active Ingredients Specification and Application
Table 135. Kumiai Chemical Industry Pesticide Active Ingredients Production (Kilotons), Value (US$ Million), Price (US$/Ton) and Gross Margin (2021–2026)
Table 136. Kumiai Chemical Industry Main Business and Markets Served
Table 137. Kumiai Chemical Industry Recent Developments/Updates
Table 138. Nippon Soda Pesticide Active Ingredients Company Information
Table 139. Nippon Soda Pesticide Active Ingredients Specification and Application
Table 140. Nippon Soda Pesticide Active Ingredients Production (Kilotons), Value (US$ Million), Price (US$/Ton) and Gross Margin (2021–2026)
Table 141. Nippon Soda Main Business and Markets Served
Table 142. Nippon Soda Recent Developments/Updates
Table 143. Zhejiang Xin'an Chemical Group Pesticide Active Ingredients Company Information
Table 144. Zhejiang Xin'an Chemical Group Pesticide Active Ingredients Specification and Application
Table 145. Zhejiang Xin'an Chemical Group Pesticide Active Ingredients Production (Kilotons), Value (US$ Million), Price (US$/Ton) and Gross Margin (2021–2026)
Table 146. Zhejiang Xin'an Chemical Group Main Business and Markets Served
Table 147. Zhejiang Xin'an Chemical Group Recent Developments/Updates
Table 148. Hubei Xingfa Group Pesticide Active Ingredients Company Information
Table 149. Hubei Xingfa Group Pesticide Active Ingredients Specification and Application
Table 150. Hubei Xingfa Group Pesticide Active Ingredients Production (Kilotons), Value (US$ Million), Price (US$/Ton) and Gross Margin (2021–2026)
Table 151. Hubei Xingfa Group Main Business and Markets Served
Table 152. Hubei Xingfa Group Recent Developments/Updates
Table 153. Jiangsu Yangnong Chemical Pesticide Active Ingredients Company Information
Table 154. Jiangsu Yangnong Chemical Pesticide Active Ingredients Specification and Application
Table 155. Jiangsu Yangnong Chemical Pesticide Active Ingredients Production (Kilotons), Value (US$ Million), Price (US$/Ton) and Gross Margin (2021–2026)
Table 156. Jiangsu Yangnong Chemical Main Business and Markets Served
Table 157. Jiangsu Yangnong Chemical Recent Developments/Updates
Table 158. Lier Chemical Pesticide Active Ingredients Company Information
Table 159. Lier Chemical Pesticide Active Ingredients Specification and Application
Table 160. Lier Chemical Pesticide Active Ingredients Production (Kilotons), Value (US$ Million), Price (US$/Ton) and Gross Margin (2021–2026)
Table 161. Lier Chemical Main Business and Markets Served
Table 162. Lier Chemical Recent Developments/Updates
Table 163. Gharda Chemicals Pesticide Active Ingredients Company Information
Table 164. Gharda Chemicals Pesticide Active Ingredients Specification and Application
Table 165. Gharda Chemicals Pesticide Active Ingredients Production (Kilotons), Value (US$ Million), Price (US$/Ton) and Gross Margin (2021–2026)
Table 166. Gharda Chemicals Main Business and Markets Served
Table 167. Gharda Chemicals Recent Developments/Updates
Table 168. Key Raw Materials Lists
Table 169. Raw Materials Key Suppliers Lists
Table 170. Pesticide Active Ingredients Distributors List
Table 171. Pesticide Active Ingredients Customers List
Table 172. Pesticide Active Ingredients Market Trends
Table 173. Pesticide Active Ingredients Market Drivers
Table 174. Pesticide Active Ingredients Market Challenges
Table 175. Pesticide Active Ingredients Market Restraints
Table 176. Research Programs/Design for This Report
Table 177. Key Data Information from Secondary Sources
Table 178. Key Data Information from Primary Sources
Table 179. Authors List of This Report
List of Figures
Figure 1. Product Picture of Pesticide Active Ingredients
Figure 2. Global Pesticide Active Ingredients Market Value by Pesticide Type (US$ Million), 2021–2032
Figure 3. Global Pesticide Active Ingredients Market Share by Pesticide Type: 2025 vs 2032
Figure 4. Herbicide Active Ingredient Product Picture
Figure 5. Insecticide Active Ingredient Product Picture
Figure 6. Fungicide and Bactericide Active Ingredient Product Picture
Figure 7. Plant Growth Regulator Active Ingredient Product Picture
Figure 8. Other Pesticide Active Ingredient Product Picture
Figure 9. Global Pesticide Active Ingredients Market Value by Origin (US$ Million), 2021–2032
Figure 10. Global Pesticide Active Ingredients Market Share by Origin: 2025 vs 2032
Figure 11. Conventional Synthetic Active Ingredient Product Picture
Figure 12. Biochemical Active Ingredient Product Picture
Figure 13. Microbial Active Ingredient Product Picture
Figure 14. Inorganic Mineral Active Ingredient Product Picture
Figure 15. Global Pesticide Active Ingredients Market Value by Active Substance Form (US$ Million), 2021–2032
Figure 16. Global Pesticide Active Ingredients Market Share by Active Substance Form: 2025 vs 2032
Figure 17. Acid or Neutral Active Substance Product Picture
Figure 18. Salt Active Substance Product Picture
Figure 19. Ester Active Substance Product Picture
Figure 20. Other Derivative Active Substance Product Picture
Figure 21. Global Pesticide Active Ingredients Market Value by Phase-Out Status (US$ Million), 2021–2032
Figure 22. Global Pesticide Active Ingredients Market Share by Phase-Out Status: 2025 vs 2032
Figure 23. Stockholm Listed Active Ingredient Product Picture
Figure 24. Banned or Cancelled in Major Jurisdictions Product Picture
Figure 25. Phase Out Underway with Existing Stocks Product Picture
Figure 26. Restricted or Substitution Candidate Product Picture
Figure 27. Approved or Registered Active Ingredient Product Picture
Figure 28. Global Pesticide Active Ingredients Market Value by Application (US$ Million), 2021–2032
Figure 29. Global Pesticide Active Ingredients Market Share by Application: 2025 vs 2032
Figure 30. Field Crops
Figure 31. Horticulture Crops
Figure 32. Seed Treatment
Figure 33. Turf and Ornamentals
Figure 34. Public Health Vector Control
Figure 35. Structural and Household Pest Control
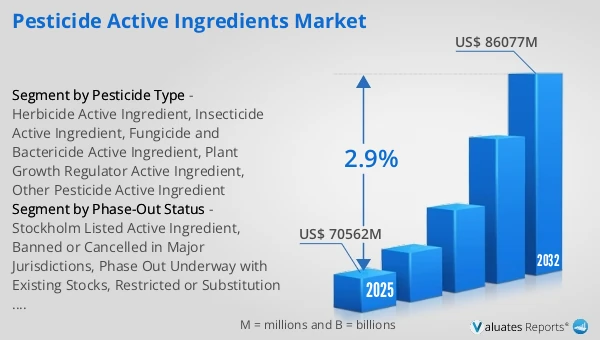
Figure 36. Global Pesticide Active Ingredients Production Value (US$ Million), 2021 vs 2025 vs 2032
Figure 37. Global Pesticide Active Ingredients Production Value (US$ Million), 2021–2032
Figure 38. Global Pesticide Active Ingredients Production Capacity (Kilotons), 2021–2032
Figure 39. Global Pesticide Active Ingredients Production (Kilotons), 2021–2032
Figure 40. Global Pesticide Active Ingredients Average Price (US$/Ton), 2021–2032
Figure 41. Pesticide Active Ingredients Report Years Considered
Figure 42. Pesticide Active Ingredients Production Share by Manufacturers in 2025
Figure 43. Global Pesticide Active Ingredients Production Value Share by Manufacturers (2025)
Figure 44. Pesticide Active Ingredients Market Share by Company Type (Tier 1, Tier 2, and Tier 3): 2021 vs 2025
Figure 45. Top 5 and Top 10 Global Players: Market Share by Pesticide Active Ingredients Revenue in 2025
Figure 46. Global Pesticide Active Ingredients Production Value by Region: 2021 vs 2025 vs 2032 (US$ Million)
Figure 47. Global Pesticide Active Ingredients Production Value Market Share by Region: 2021 vs 2025 vs 2032
Figure 48. Global Pesticide Active Ingredients Production Comparison by Region: 2021 vs 2025 vs 2032 (Kilotons)
Figure 49. Global Pesticide Active Ingredients Production Market Share by Region: 2021 vs 2025 vs 2032
Figure 50. North America Pesticide Active Ingredients Production Value (US$ Million) Growth Rate (2021–2032)
Figure 51. Europe Pesticide Active Ingredients Production Value (US$ Million) Growth Rate (2021–2032)
Figure 52. China Pesticide Active Ingredients Production Value (US$ Million) Growth Rate (2021–2032)
Figure 53. Japan Pesticide Active Ingredients Production Value (US$ Million) Growth Rate (2021–2032)
Figure 54. South America Pesticide Active Ingredients Production Value (US$ Million) Growth Rate (2021–2032)
Figure 55. Global Pesticide Active Ingredients Consumption by Region: 2021 vs 2025 vs 2032 (Kilotons)
Figure 56. Global Pesticide Active Ingredients Consumption Market Share by Region: 2021 vs 2025 vs 2032
Figure 57. North America Pesticide Active Ingredients Consumption and Growth Rate (Kilotons), 2021–2032
Figure 58. North America Pesticide Active Ingredients Consumption Market Share by Country (2021–2032)
Figure 59. U.S. Pesticide Active Ingredients Consumption and Growth Rate (Kilotons), 2021–2032
Figure 60. Canada Pesticide Active Ingredients Consumption and Growth Rate (Kilotons), 2021–2032
Figure 61. Europe Pesticide Active Ingredients Consumption and Growth Rate (Kilotons), 2021–2032
Figure 62. Europe Pesticide Active Ingredients Consumption Market Share by Country (2021–2032)
Figure 63. Germany Pesticide Active Ingredients Consumption and Growth Rate (Kilotons), 2021–2032
Figure 64. France Pesticide Active Ingredients Consumption and Growth Rate (Kilotons), 2021–2032
Figure 65. U.K. Pesticide Active Ingredients Consumption and Growth Rate (Kilotons), 2021–2032
Figure 66. Italy Pesticide Active Ingredients Consumption and Growth Rate (Kilotons), 2021–2032
Figure 67. Russia Pesticide Active Ingredients Consumption and Growth Rate (Kilotons), 2021–2032
Figure 68. Asia Pacific Pesticide Active Ingredients Consumption and Growth Rate (Kilotons), 2021–2032
Figure 69. Asia Pacific Pesticide Active Ingredients Consumption Market Share by Region (2021–2032)
Figure 70. China Pesticide Active Ingredients Consumption and Growth Rate (Kilotons), 2021–2032
Figure 71. Japan Pesticide Active Ingredients Consumption and Growth Rate (Kilotons), 2021–2032
Figure 72. South Korea Pesticide Active Ingredients Consumption and Growth Rate (Kilotons), 2021–2032
Figure 73. China Taiwan Pesticide Active Ingredients Consumption and Growth Rate (Kilotons), 2021–2032
Figure 74. Southeast Asia Pesticide Active Ingredients Consumption and Growth Rate (Kilotons), 2021–2032
Figure 75. India Pesticide Active Ingredients Consumption and Growth Rate (Kilotons), 2021–2032
Figure 76. Latin America, Middle East & Africa Pesticide Active Ingredients Consumption and Growth Rate (Kilotons), 2021–2032
Figure 77. Latin America, Middle East & Africa Pesticide Active Ingredients Consumption Market Share by Country (2021–2032)
Figure 78. Mexico Pesticide Active Ingredients Consumption and Growth Rate (Kilotons), 2021–2032
Figure 79. Brazil Pesticide Active Ingredients Consumption and Growth Rate (Kilotons), 2021–2032
Figure 80. Turkey Pesticide Active Ingredients Consumption and Growth Rate (Kilotons), 2021–2032
Figure 81. GCC Countries Pesticide Active Ingredients Consumption and Growth Rate (Kilotons), 2021–2032
Figure 82. Global Production Market Share of Pesticide Active Ingredients by Pesticide Type (2021–2032)
Figure 83. Global Production Value Market Share of Pesticide Active Ingredients by Pesticide Type (2021–2032)
Figure 84. Global Pesticide Active Ingredients Price (US$/Ton) by Pesticide Type (2021–2032)
Figure 85. Global Production Market Share of Pesticide Active Ingredients by Application (2021–2032)
Figure 86. Global Production Value Market Share of Pesticide Active Ingredients by Application (2021–2032)
Figure 87. Global Pesticide Active Ingredients Price (US$/Ton) by Application (2021–2032)
Figure 88. Pesticide Active Ingredients Value Chain
Figure 89. Channels of Distribution (Direct Vs Distribution)
Figure 90. Bottom-up and Top-down Approaches for This Report
Figure 91. Data Triangulation