List of Tables
Table 1. Global Drone Aerial Mapping Services Market Size Growth Rate by Type (US$ Million): 2021 vs 2025 vs 2032
Table 2. Key Players of Hyperspectral Aerial Mapping
Table 3. Key Players of Multispectral Aerial Survey
Table 4. Key Players of Thermal Infrared Aerial Survey
Table 5. Key Players of Laser Scanning Aerial Survey
Table 6. Key Players of Synthetic Aperture Radar Aerial Survey
Table 7. Key Players of Others
Table 8. Global Drone Aerial Mapping Services Market Size Growth by Application (US$ Million): 2021 vs 2025 vs 2032
Table 9. Global Drone Aerial Mapping Services Market Size by Region (US$ Million): 2021 vs 2025 vs 2032
Table 10. Global Drone Aerial Mapping Services Market Size by Region (US$ Million), 2021–2026
Table 11. Global Drone Aerial Mapping Services Market Share by Region (2021–2026)
Table 12. Global Drone Aerial Mapping Services Forecasted Market Size by Region (US$ Million), 2027–2032
Table 13. Global Drone Aerial Mapping Services Market Share by Region (2027–2032)
Table 14. Drone Aerial Mapping Services Market Trends
Table 15. Drone Aerial Mapping Services Market Drivers
Table 16. Drone Aerial Mapping Services Market Challenges
Table 17. Drone Aerial Mapping Services Market Restraints
Table 18. Global Drone Aerial Mapping Services Revenue by Players (US$ Million), 2021–2026
Table 19. Global Drone Aerial Mapping Services Market Share by Players (2021–2026)
Table 20. Global Top Drone Aerial Mapping Services Players by Tier (Tier 1, Tier 2, and Tier 3), based on Drone Aerial Mapping Services Revenue, 2025
Table 21. Ranking of Global Top Drone Aerial Mapping Services Companies by Revenue (US$ Million) in 2025
Table 22. Global 5 Largest Players Market Share by Drone Aerial Mapping Services Revenue (CR5 and HHI), 2021–2026
Table 23. Global Key Players of Drone Aerial Mapping Services, Headquarters and Area Served
Table 24. Global Key Players of Drone Aerial Mapping Services, Products and Applications
Table 25. Global Key Players of Drone Aerial Mapping Services, Date of General Availability (GA)
Table 26. Mergers and Acquisitions, Expansion Plans
Table 27. Global Drone Aerial Mapping Services Market Size by Type (US$ Million), 2021–2026
Table 28. Global Drone Aerial Mapping Services Revenue Market Share by Type (2021–2026)
Table 29. Global Drone Aerial Mapping Services Forecasted Market Size by Type (US$ Million), 2027–2032
Table 30. Global Drone Aerial Mapping Services Revenue Market Share by Type (2027–2032)
Table 31. Global Drone Aerial Mapping Services Market Size by Application (US$ Million), 2021–2026
Table 32. Global Drone Aerial Mapping Services Revenue Market Share by Application (2021–2026)
Table 33. Global Drone Aerial Mapping Services Forecasted Market Size by Application (US$ Million), 2027–2032
Table 34. Global Drone Aerial Mapping Services Revenue Market Share by Application (2027–2032)
Table 35. North America Drone Aerial Mapping Services Market Size Growth Rate by Country (US$ Million): 2021 vs 2025 vs 2032
Table 36. North America Drone Aerial Mapping Services Market Size by Country (US$ Million), 2021–2026
Table 37. North America Drone Aerial Mapping Services Market Size by Country (US$ Million), 2027–2032
Table 38. Europe Drone Aerial Mapping Services Market Size Growth Rate by Country (US$ Million): 2021 vs 2025 vs 2032
Table 39. Europe Drone Aerial Mapping Services Market Size by Country (US$ Million), 2021–2026
Table 40. Europe Drone Aerial Mapping Services Market Size by Country (US$ Million), 2027–2032
Table 41. Asia-Pacific Drone Aerial Mapping Services Market Size Growth Rate by Region (US$ Million): 2021 vs 2025 vs 2032
Table 42. Asia-Pacific Drone Aerial Mapping Services Market Size by Region (US$ Million), 2021–2026
Table 43. Asia-Pacific Drone Aerial Mapping Services Market Size by Region (US$ Million), 2027–2032
Table 44. Latin America Drone Aerial Mapping Services Market Size Growth Rate by Country (US$ Million): 2021 vs 2025 vs 2032
Table 45. Latin America Drone Aerial Mapping Services Market Size by Country (US$ Million), 2021–2026
Table 46. Latin America Drone Aerial Mapping Services Market Size by Country (US$ Million), 2027–2032
Table 47. Middle East & Africa Drone Aerial Mapping Services Market Size Growth Rate by Country (US$ Million): 2021 vs 2025 vs 2032
Table 48. Middle East & Africa Drone Aerial Mapping Services Market Size by Country (US$ Million), 2021–2026
Table 49. Middle East & Africa Drone Aerial Mapping Services Market Size by Country (US$ Million), 2027–2032
Table 50. AltiGator Company Details
Table 51. AltiGator Business Overview
Table 52. AltiGator Drone Aerial Mapping Services Product
Table 53. AltiGator Revenue in Drone Aerial Mapping Services Business (US$ Million), 2021–2026
Table 54. AltiGator Recent Development
Table 55. American Drone Industries Company Details
Table 56. American Drone Industries Business Overview
Table 57. American Drone Industries Drone Aerial Mapping Services Product
Table 58. American Drone Industries Revenue in Drone Aerial Mapping Services Business (US$ Million), 2021–2026
Table 59. American Drone Industries Recent Development
Table 60. Arch Aerial Company Details
Table 61. Arch Aerial Business Overview
Table 62. Arch Aerial Drone Aerial Mapping Services Product
Table 63. Arch Aerial Revenue in Drone Aerial Mapping Services Business (US$ Million), 2021–2026
Table 64. Arch Aerial Recent Development
Table 65. Arizona Surveying Company Details
Table 66. Arizona Surveying Business Overview
Table 67. Arizona Surveying Drone Aerial Mapping Services Product
Table 68. Arizona Surveying Revenue in Drone Aerial Mapping Services Business (US$ Million), 2021–2026
Table 69. Arizona Surveying Recent Development
Table 70. AUAV Company Details
Table 71. AUAV Business Overview
Table 72. AUAV Drone Aerial Mapping Services Product
Table 73. AUAV Revenue in Drone Aerial Mapping Services Business (US$ Million), 2021–2026
Table 74. AUAV Recent Development
Table 75. Azur Drones Company Details
Table 76. Azur Drones Business Overview
Table 77. Azur Drones Drone Aerial Mapping Services Product
Table 78. Azur Drones Revenue in Drone Aerial Mapping Services Business (US$ Million), 2021–2026
Table 79. Azur Drones Recent Development
Table 80. Birds Eye Aerial Drones Company Details
Table 81. Birds Eye Aerial Drones Business Overview
Table 82. Birds Eye Aerial Drones Drone Aerial Mapping Services Product
Table 83. Birds Eye Aerial Drones Revenue in Drone Aerial Mapping Services Business (US$ Million), 2021–2026
Table 84. Birds Eye Aerial Drones Recent Development
Table 85. Bryant Associates Company Details
Table 86. Bryant Associates Business Overview
Table 87. Bryant Associates Drone Aerial Mapping Services Product
Table 88. Bryant Associates Revenue in Drone Aerial Mapping Services Business (US$ Million), 2021–2026
Table 89. Bryant Associates Recent Development
Table 90. Charlotte UAV Company Details
Table 91. Charlotte UAV Business Overview
Table 92. Charlotte UAV Drone Aerial Mapping Services Product
Table 93. Charlotte UAV Revenue in Drone Aerial Mapping Services Business (US$ Million), 2021–2026
Table 94. Charlotte UAV Recent Development
Table 95. Chattanooga Land Surveying Company Details
Table 96. Chattanooga Land Surveying Business Overview
Table 97. Chattanooga Land Surveying Drone Aerial Mapping Services Product
Table 98. Chattanooga Land Surveying Revenue in Drone Aerial Mapping Services Business (US$ Million), 2021–2026
Table 99. Chattanooga Land Surveying Recent Development
Table 100. Chris Nelson & Associates Company Details
Table 101. Chris Nelson & Associates Business Overview
Table 102. Chris Nelson & Associates Drone Aerial Mapping Services Product
Table 103. Chris Nelson & Associates Revenue in Drone Aerial Mapping Services Business (US$ Million), 2021–2026
Table 104. Chris Nelson & Associates Recent Development
Table 105. Drone Services Ireland Company Details
Table 106. Drone Services Ireland Business Overview
Table 107. Drone Services Ireland Drone Aerial Mapping Services Product
Table 108. Drone Services Ireland Revenue in Drone Aerial Mapping Services Business (US$ Million), 2021–2026
Table 109. Drone Services Ireland Recent Development
Table 110. Florida Aerial Survey Technologies Company Details
Table 111. Florida Aerial Survey Technologies Business Overview
Table 112. Florida Aerial Survey Technologies Drone Aerial Mapping Services Product
Table 113. Florida Aerial Survey Technologies Revenue in Drone Aerial Mapping Services Business (US$ Million), 2021–2026
Table 114. Florida Aerial Survey Technologies Recent Development
Table 115. FlyGuys Company Details
Table 116. FlyGuys Business Overview
Table 117. FlyGuys Drone Aerial Mapping Services Product
Table 118. FlyGuys Revenue in Drone Aerial Mapping Services Business (US$ Million), 2021–2026
Table 119. FlyGuys Recent Development
Table 120. Goldsmith Engineering Company Details
Table 121. Goldsmith Engineering Business Overview
Table 122. Goldsmith Engineering Drone Aerial Mapping Services Product
Table 123. Goldsmith Engineering Revenue in Drone Aerial Mapping Services Business (US$ Million), 2021–2026
Table 124. Goldsmith Engineering Recent Development
Table 125. Keystone Aerial Surveys Company Details
Table 126. Keystone Aerial Surveys Business Overview
Table 127. Keystone Aerial Surveys Drone Aerial Mapping Services Product
Table 128. Keystone Aerial Surveys Revenue in Drone Aerial Mapping Services Business (US$ Million), 2021–2026
Table 129. Keystone Aerial Surveys Recent Development
Table 130. Leading Edge LS Company Details
Table 131. Leading Edge LS Business Overview
Table 132. Leading Edge LS Drone Aerial Mapping Services Product
Table 133. Leading Edge LS Revenue in Drone Aerial Mapping Services Business (US$ Million), 2021–2026
Table 134. Leading Edge LS Recent Development
Table 135. Microdrones Company Details
Table 136. Microdrones Business Overview
Table 137. Microdrones Drone Aerial Mapping Services Product
Table 138. Microdrones Revenue in Drone Aerial Mapping Services Business (US$ Million), 2021–2026
Table 139. Microdrones Recent Development
Table 140. Montana Drone Company Company Details
Table 141. Montana Drone Company Business Overview
Table 142. Montana Drone Company Drone Aerial Mapping Services Product
Table 143. Montana Drone Company Revenue in Drone Aerial Mapping Services Business (US$ Million), 2021–2026
Table 144. Montana Drone Company Recent Development
Table 145. ProAerial Media Company Details
Table 146. ProAerial Media Business Overview
Table 147. ProAerial Media Drone Aerial Mapping Services Product
Table 148. ProAerial Media Revenue in Drone Aerial Mapping Services Business (US$ Million), 2021–2026
Table 149. ProAerial Media Recent Development
Table 150. Propeller Company Details
Table 151. Propeller Business Overview
Table 152. Propeller Drone Aerial Mapping Services Product
Table 153. Propeller Revenue in Drone Aerial Mapping Services Business (US$ Million), 2021–2026
Table 154. Propeller Recent Development
Table 155. RaSmith Company Details
Table 156. RaSmith Business Overview
Table 157. RaSmith Drone Aerial Mapping Services Product
Table 158. RaSmith Revenue in Drone Aerial Mapping Services Business (US$ Million), 2021–2026
Table 159. RaSmith Recent Development
Table 160. Recon Aerial Company Details
Table 161. Recon Aerial Business Overview
Table 162. Recon Aerial Drone Aerial Mapping Services Product
Table 163. Recon Aerial Revenue in Drone Aerial Mapping Services Business (US$ Million), 2021–2026
Table 164. Recon Aerial Recent Development
Table 165. SmartDrone Company Details
Table 166. SmartDrone Business Overview
Table 167. SmartDrone Drone Aerial Mapping Services Product
Table 168. SmartDrone Revenue in Drone Aerial Mapping Services Business (US$ Million), 2021–2026
Table 169. SmartDrone Recent Development
Table 170. Team UAV Company Details
Table 171. Team UAV Business Overview
Table 172. Team UAV Drone Aerial Mapping Services Product
Table 173. Team UAV Revenue in Drone Aerial Mapping Services Business (US$ Million), 2021–2026
Table 174. Team UAV Recent Development
Table 175. Research Programs/Design for This Report
Table 176. Key Data Information from Secondary Sources
Table 177. Key Data Information from Primary Sources
Table 178. Authors List of This Report
List of Figures
Figure 1. Drone Aerial Mapping Services Picture
Figure 2. Global Drone Aerial Mapping Services Market Size Comparison by Type (US$ Million), 2021–2032
Figure 3. Global Drone Aerial Mapping Services Market Share by Type: 2025 vs 2032
Figure 4. Hyperspectral Aerial Mapping Features
Figure 5. Multispectral Aerial Survey Features
Figure 6. Thermal Infrared Aerial Survey Features
Figure 7. Laser Scanning Aerial Survey Features
Figure 8. Synthetic Aperture Radar Aerial Survey Features
Figure 9. Others Features
Figure 10. Global Drone Aerial Mapping Services Market Size by Application (US$ Million), 2021–2032
Figure 11. Global Drone Aerial Mapping Services Market Share by Application: 2025 vs 2032
Figure 12. Agriculture Case Studies
Figure 13. Forestry Case Studies
Figure 14. Emergency Response Case Studies
Figure 15. Urban Planning Case Studies
Figure 16. Others Case Studies
Figure 17. Drone Aerial Mapping Services Report Years Considered
Figure 18. Global Drone Aerial Mapping Services Market Size (US$ Million), Year-over-Year: 2021–2032
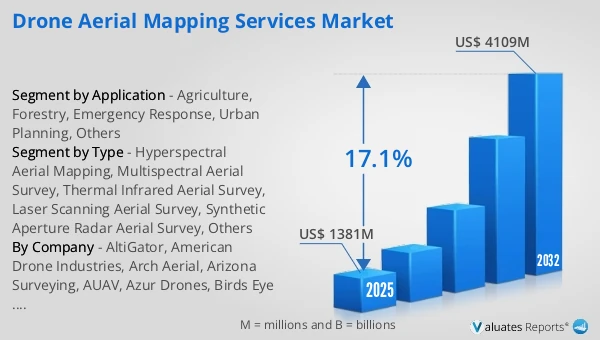
Figure 19. Global Drone Aerial Mapping Services Market Size, (US$ Million), 2021 vs 2025 vs 2032
Figure 20. Global Drone Aerial Mapping Services Market Share by Region: 2025 vs 2032
Figure 21. Global Drone Aerial Mapping Services Market Share by Players in 2025
Figure 22. Global Drone Aerial Mapping Services Market Share by Company Type (Tier 1, Tier 2, and Tier 3)
Figure 23. The Top 10 and 5 Players Market Share by Drone Aerial Mapping Services Revenue in 2025
Figure 24. North America Drone Aerial Mapping Services Market Size YoY Growth (US$ Million), 2021–2032
Figure 25. North America Drone Aerial Mapping Services Market Share by Country (2021–2032)
Figure 26. United States Drone Aerial Mapping Services Market Size YoY Growth (US$ Million), 2021–2032
Figure 27. Canada Drone Aerial Mapping Services Market Size YoY Growth (US$ Million), 2021–2032
Figure 28. Europe Drone Aerial Mapping Services Market Size YoY Growth (US$ Million), 2021–2032
Figure 29. Europe Drone Aerial Mapping Services Market Share by Country (2021–2032)
Figure 30. Germany Drone Aerial Mapping Services Market Size YoY Growth (US$ Million), 2021–2032
Figure 31. France Drone Aerial Mapping Services Market Size YoY Growth (US$ Million), 2021–2032
Figure 32. U.K. Drone Aerial Mapping Services Market Size YoY Growth (US$ Million), 2021–2032
Figure 33. Italy Drone Aerial Mapping Services Market Size YoY Growth (US$ Million), 2021–2032
Figure 34. Russia Drone Aerial Mapping Services Market Size YoY Growth (US$ Million), 2021–2032
Figure 35. Ireland Drone Aerial Mapping Services Market Size YoY Growth (US$ Million), 2021–2032
Figure 36. Asia-Pacific Drone Aerial Mapping Services Market Size YoY Growth (US$ Million), 2021–2032
Figure 37. Asia-Pacific Drone Aerial Mapping Services Market Share by Region (2021–2032)
Figure 38. China Drone Aerial Mapping Services Market Size YoY Growth (US$ Million), 2021–2032
Figure 39. Japan Drone Aerial Mapping Services Market Size YoY Growth (US$ Million), 2021–2032
Figure 40. South Korea Drone Aerial Mapping Services Market Size YoY Growth (US$ Million), 2021–2032
Figure 41. Southeast Asia Drone Aerial Mapping Services Market Size YoY Growth (US$ Million), 2021–2032
Figure 42. India Drone Aerial Mapping Services Market Size YoY Growth (US$ Million), 2021–2032
Figure 43. Australia & New Zealand Drone Aerial Mapping Services Market Size YoY Growth (US$ Million), 2021–2032
Figure 44. Latin America Drone Aerial Mapping Services Market Size YoY Growth (US$ Million), 2021–2032
Figure 45. Latin America Drone Aerial Mapping Services Market Share by Country (2021–2032)
Figure 46. Mexico Drone Aerial Mapping Services Market Size YoY Growth (US$ Million), 2021–2032
Figure 47. Brazil Drone Aerial Mapping Services Market Size YoY Growth (US$ Million), 2021–2032
Figure 48. Middle East & Africa Drone Aerial Mapping Services Market Size YoY Growth (US$ Million), 2021–2032
Figure 49. Middle East & Africa Drone Aerial Mapping Services Market Share by Country (2021–2032)
Figure 50. Israel Drone Aerial Mapping Services Market Size YoY Growth (US$ Million), 2021–2032
Figure 51. Saudi Arabia Drone Aerial Mapping Services Market Size YoY Growth (US$ Million), 2021–2032
Figure 52. UAE Drone Aerial Mapping Services Market Size YoY Growth (US$ Million), 2021–2032
Figure 53. AltiGator Revenue Growth Rate in Drone Aerial Mapping Services Business (2021–2026)
Figure 54. American Drone Industries Revenue Growth Rate in Drone Aerial Mapping Services Business (2021–2026)
Figure 55. Arch Aerial Revenue Growth Rate in Drone Aerial Mapping Services Business (2021–2026)
Figure 56. Arizona Surveying Revenue Growth Rate in Drone Aerial Mapping Services Business (2021–2026)
Figure 57. AUAV Revenue Growth Rate in Drone Aerial Mapping Services Business (2021–2026)
Figure 58. Azur Drones Revenue Growth Rate in Drone Aerial Mapping Services Business (2021–2026)
Figure 59. Birds Eye Aerial Drones Revenue Growth Rate in Drone Aerial Mapping Services Business (2021–2026)
Figure 60. Bryant Associates Revenue Growth Rate in Drone Aerial Mapping Services Business (2021–2026)
Figure 61. Charlotte UAV Revenue Growth Rate in Drone Aerial Mapping Services Business (2021–2026)
Figure 62. Chattanooga Land Surveying Revenue Growth Rate in Drone Aerial Mapping Services Business (2021–2026)
Figure 63. Chris Nelson & Associates Revenue Growth Rate in Drone Aerial Mapping Services Business (2021–2026)
Figure 64. Drone Services Ireland Revenue Growth Rate in Drone Aerial Mapping Services Business (2021–2026)
Figure 65. Florida Aerial Survey Technologies Revenue Growth Rate in Drone Aerial Mapping Services Business (2021–2026)
Figure 66. FlyGuys Revenue Growth Rate in Drone Aerial Mapping Services Business (2021–2026)
Figure 67. Goldsmith Engineering Revenue Growth Rate in Drone Aerial Mapping Services Business (2021–2026)
Figure 68. Keystone Aerial Surveys Revenue Growth Rate in Drone Aerial Mapping Services Business (2021–2026)
Figure 69. Leading Edge LS Revenue Growth Rate in Drone Aerial Mapping Services Business (2021–2026)
Figure 70. Microdrones Revenue Growth Rate in Drone Aerial Mapping Services Business (2021–2026)
Figure 71. Montana Drone Company Revenue Growth Rate in Drone Aerial Mapping Services Business (2021–2026)
Figure 72. ProAerial Media Revenue Growth Rate in Drone Aerial Mapping Services Business (2021–2026)
Figure 73. Propeller Revenue Growth Rate in Drone Aerial Mapping Services Business (2021–2026)
Figure 74. RaSmith Revenue Growth Rate in Drone Aerial Mapping Services Business (2021–2026)
Figure 75. Recon Aerial Revenue Growth Rate in Drone Aerial Mapping Services Business (2021–2026)
Figure 76. SmartDrone Revenue Growth Rate in Drone Aerial Mapping Services Business (2021–2026)
Figure 77. Team UAV Revenue Growth Rate in Drone Aerial Mapping Services Business (2021–2026)
Figure 78. Bottom-up and Top-down Approaches for This Report
Figure 79. Data Triangulation
Figure 80. Key Executives Interviewed