0
U.S. (TOLL FREE)
+1 (315) 215-3225
Automative

0
U.S. (TOLL FREE)
+1 (315) 215-3225
Global Pressure Swing Adsorption (PSA) Separation Technology Market Research Report 2025
Published Date: April 2025
|
Report Code: QYRE-Auto-37I12683
Home | Market Reports | Science
Global Pressure Swing Adsorption PSA Separation Technology Market Research Report 2022
BUY CHAPTERS

Global Pressure Swing Adsorption (PSA) Separation Technology Market Research Report 2025

Code: QYRE-Auto-37I12683
Report
April 2025
Pages:106
QYResearch
Buy Now with 15% Discount
DESCRIPTION
TABLE OF CONTENT
TABLES & FIGURES

Pressure Swing Adsorption (PSA) Separation Technology Market Size

The global market for Pressure Swing Adsorption (PSA) Separation Technology was valued at US$ 3131 million in the year 2024 and is projected to reach a revised size of US$ 4614 million by 2031, growing at a CAGR of 5.7% during the forecast period.

Pressure Swing Adsorption (PSA) Separation Technology Market

Pressure Swing Adsorption (PSA) Separation Technology Market

Pressure swing adsorption (PSA) is a technique used to separate some gas species from a mixture of gases (typically air) under pressure according to the species' molecular characteristics and affinity for an adsorbent material. It operates at near-ambient temperature and significantly differs from the cryogenic distillation commonly used to separate gases. Selective adsorbent materials (e.g., zeolites, (aka molecular sieves), activated carbon, etc.) are used as trapping material, preferentially adsorbing the target gas species at high pressure. The process then swings to low pressure to desorb the adsorbed gas.
When producing nitrogen, it is important to know and understand the purity level you want to achieve. Some applications require low purity levels (between 90 and 99%), such as tire inflation and fire prevention, while others, such as applications in the food and beverage industry or plastic molding, require high levels (from 97 to 99.999%). In these cases PSA technology is the ideal and easiest way to go. The burgeoning hydrogen economy, particularly for applications like fuel cells and refineries, is a major catalyst. The rising adoption of PSA technology in various industries, including semiconductor manufacturing, the production of synthetic ammonia and methanol, and powder metallurgy, contributes significantly to market expansion. Furthermore, stringent environmental regulations promoting cleaner production methods are driving the adoption of energy-efficient PSA systems for gas separation and purification. Technological advancements leading to improved adsorption materials and enhanced system designs further enhance market prospects.
This report aims to provide a comprehensive presentation of the global market for Pressure Swing Adsorption (PSA) Separation Technology, with both quantitative and qualitative analysis, to help readers develop business/growth strategies, assess the market competitive situation, analyze their position in the current marketplace, and make informed business decisions regarding Pressure Swing Adsorption (PSA) Separation Technology.
The Pressure Swing Adsorption (PSA) Separation Technology market size, estimations, and forecasts are provided in terms of and revenue ($ millions), considering 2024 as the base year, with history and forecast data for the period from 2020 to 2031. This report segments the global Pressure Swing Adsorption (PSA) Separation Technology market comprehensively. Regional market sizes, concerning products by Type, by Application, and by players, are also provided.
For a more in-depth understanding of the market, the report provides profiles of the competitive landscape, key competitors, and their respective market ranks. The report also discusses technological trends and new product developments.
The report will help the Pressure Swing Adsorption (PSA) Separation Technology companies, new entrants, and industry chain related companies in this market with information on the revenues for the overall market and the sub-segments across the different segments, by company, by Type, by Application, and by regions.
Market Segmentation

Scope of Pressure Swing Adsorption (PSA) Separation Technology Market Report

Report Metric Details
Report Name Pressure Swing Adsorption (PSA) Separation Technology Market
Accounted market size in year US$ 3131 million
Forecasted market size in 2031 US$ 4614 million
CAGR 5.7%
Base Year year
Forecasted years 2025 - 2031
Segment by Type
  • Nitrogen
  • Oxygen
  • Hydrogen
  • Others
Segment by Application
By Region
  • North America (United States, Canada)
  • Europe (Germany, France, UK, Italy, Russia) Rest of Europe
  • Nordic Countries
  • Asia-Pacific (China, Japan, South Korea)
  • Southeast Asia (India, Australia)
  • Rest of Asia
  • Latin America (Mexico, Brazil)
  • Rest of Latin America
  • Middle East & Africa (Turkey, Saudi Arabia, UAE, Rest of MEA)
By Company Linde, Air Products, Honeywell (UOP), Air Liquide, Siemens, Hanxing Energy, Zeochem, Xebec Adsorption Inc., Samson Technologies, Peak Scientific, Universal Industrial Gases, Inc, BOGE, CALORIC, Isolcell, Bauer Compressors, Lummus Technology, Ivys (Xebec), Parker Hannifin, SUMITOMO SEIKA, Ally Hi-Tech, Sepmem, Peking University Pioneer Technology, Zhengda Air Separation Equipment, Rich Gas Technology
Forecast units USD million in value
Report coverage Revenue and volume forecast, company share, competitive landscape, growth factors and trends

Chapter Outline

  • Chapter 1: Introduces the report scope of the report, executive summary of different market segments (by Type, by Application, etc), including the market size of each market segment, future development potential, and so on. It offers a high-level view of the current state of the market and its likely evolution in the short to mid-term, and long term.
  • Chapter 2: Introduces executive summary of global market size, regional market size, this section also introduces the market dynamics, latest developments of the market, the driving factors and restrictive factors of the market, the challenges and risks faced by companies in the industry, and the analysis of relevant policies in the industry.
  • Chapter 3: Detailed analysis of Pressure Swing Adsorption (PSA) Separation Technology company competitive landscape, revenue market share, latest development plan, merger, and acquisition information, etc.
  • Chapter 4: Provides the analysis of various market segments by Type, covering the market size and development potential of each market segment, to help readers find the blue ocean market in different market segments.
  • Chapter 5: Provides the analysis of various market segments by Application, covering the market size and development potential of each market segment, to help readers find the blue ocean market in different downstream markets.
  • Chapter 6, 7, 8, 9, 10: North America, Europe, Asia Pacific, Latin America, Middle East and Africa segment by country. It provides a quantitative analysis of the market size and development potential of each region and its main countries and introduces the market development, future development prospects, market space, and capacity of each country in the world.
  • Chapter 11: Provides profiles of key players, introducing the basic situation of the main companies in the market in detail, including product sales, revenue, price, gross margin, product introduction, recent development, etc.
  • Chapter 12: The main points and conclusions of the report.

FAQ for this report

How fast is Pressure Swing Adsorption (PSA) Separation Technology Market growing?

Ans: The Pressure Swing Adsorption (PSA) Separation Technology Market witnessing a CAGR of 5.7% during the forecast period 2025-2031.

What is the Pressure Swing Adsorption (PSA) Separation Technology Market size in 2031?

Ans: The Pressure Swing Adsorption (PSA) Separation Technology Market size in 2031 will be US$ 4614 million.

Who are the main players in the Pressure Swing Adsorption (PSA) Separation Technology Market report?

Ans: The main players in the Pressure Swing Adsorption (PSA) Separation Technology Market are Linde, Air Products, Honeywell (UOP), Air Liquide, Siemens, Hanxing Energy, Zeochem, Xebec Adsorption Inc., Samson Technologies, Peak Scientific, Universal Industrial Gases, Inc, BOGE, CALORIC, Isolcell, Bauer Compressors, Lummus Technology, Ivys (Xebec), Parker Hannifin, SUMITOMO SEIKA, Ally Hi-Tech, Sepmem, Peking University Pioneer Technology, Zhengda Air Separation Equipment, Rich Gas Technology

What are the Application segmentation covered in the Pressure Swing Adsorption (PSA) Separation Technology Market report?

Ans: The Applications covered in the Pressure Swing Adsorption (PSA) Separation Technology Market report are Petroleum and Chemical Industry, Metal Smelting, Medical, Food and Beverage, Industrial Manufacturing, Others

What are the Type segmentation covered in the Pressure Swing Adsorption (PSA) Separation Technology Market report?

Ans: The Types covered in the Pressure Swing Adsorption (PSA) Separation Technology Market report are Nitrogen, Oxygen, Hydrogen, Others

Recommended Reports

PSA Gas Generation

Biogas & Purification

Separation Technology

1 Report Overview
1.1 Study Scope
1.2 Market Analysis by Type
1.2.1 Global Pressure Swing Adsorption (PSA) Separation Technology Market Size Growth Rate by Type: 2020 VS 2024 VS 2031
1.2.2 Nitrogen
1.2.3 Oxygen
1.2.4 Hydrogen
1.2.5 Others
1.3 Market by Application
1.3.1 Global Pressure Swing Adsorption (PSA) Separation Technology Market Growth by Application: 2020 VS 2024 VS 2031
1.3.2 Petroleum and Chemical Industry
1.3.3 Metal Smelting
1.3.4 Medical
1.3.5 Food and Beverage
1.3.6 Industrial Manufacturing
1.3.7 Others
1.4 Assumptions and Limitations
1.5 Study Objectives
1.6 Years Considered
2 Global Growth Trends
2.1 Global Pressure Swing Adsorption (PSA) Separation Technology Market Perspective (2020-2031)
2.2 Global Pressure Swing Adsorption (PSA) Separation Technology Growth Trends by Region
2.2.1 Global Pressure Swing Adsorption (PSA) Separation Technology Market Size by Region: 2020 VS 2024 VS 2031
2.2.2 Pressure Swing Adsorption (PSA) Separation Technology Historic Market Size by Region (2020-2025)
2.2.3 Pressure Swing Adsorption (PSA) Separation Technology Forecasted Market Size by Region (2026-2031)
2.3 Pressure Swing Adsorption (PSA) Separation Technology Market Dynamics
2.3.1 Pressure Swing Adsorption (PSA) Separation Technology Industry Trends
2.3.2 Pressure Swing Adsorption (PSA) Separation Technology Market Drivers
2.3.3 Pressure Swing Adsorption (PSA) Separation Technology Market Challenges
2.3.4 Pressure Swing Adsorption (PSA) Separation Technology Market Restraints
3 Competition Landscape by Key Players
3.1 Global Top Pressure Swing Adsorption (PSA) Separation Technology Players by Revenue
3.1.1 Global Top Pressure Swing Adsorption (PSA) Separation Technology Players by Revenue (2020-2025)
3.1.2 Global Pressure Swing Adsorption (PSA) Separation Technology Revenue Market Share by Players (2020-2025)
3.2 Global Top Pressure Swing Adsorption (PSA) Separation Technology Players by Company Type and Market Share by Company Type (Tier 1, Tier 2, and Tier 3)
3.3 Global Key Players Ranking by Pressure Swing Adsorption (PSA) Separation Technology Revenue
3.4 Global Pressure Swing Adsorption (PSA) Separation Technology Market Concentration Ratio
3.4.1 Global Pressure Swing Adsorption (PSA) Separation Technology Market Concentration Ratio (CR5 and HHI)
3.4.2 Global Top 10 and Top 5 Companies by Pressure Swing Adsorption (PSA) Separation Technology Revenue in 2024
3.5 Global Key Players of Pressure Swing Adsorption (PSA) Separation Technology Head office and Area Served
3.6 Global Key Players of Pressure Swing Adsorption (PSA) Separation Technology, Product and Application
3.7 Global Key Players of Pressure Swing Adsorption (PSA) Separation Technology, Date of Enter into This Industry
3.8 Mergers & Acquisitions, Expansion Plans
4 Pressure Swing Adsorption (PSA) Separation Technology Breakdown Data by Type
4.1 Global Pressure Swing Adsorption (PSA) Separation Technology Historic Market Size by Type (2020-2025)
4.2 Global Pressure Swing Adsorption (PSA) Separation Technology Forecasted Market Size by Type (2026-2031)
5 Pressure Swing Adsorption (PSA) Separation Technology Breakdown Data by Application
5.1 Global Pressure Swing Adsorption (PSA) Separation Technology Historic Market Size by Application (2020-2025)
5.2 Global Pressure Swing Adsorption (PSA) Separation Technology Forecasted Market Size by Application (2026-2031)
6 North America
6.1 North America Pressure Swing Adsorption (PSA) Separation Technology Market Size (2020-2031)
6.2 North America Pressure Swing Adsorption (PSA) Separation Technology Market Growth Rate by Country: 2020 VS 2024 VS 2031
6.3 North America Pressure Swing Adsorption (PSA) Separation Technology Market Size by Country (2020-2025)
6.4 North America Pressure Swing Adsorption (PSA) Separation Technology Market Size by Country (2026-2031)
6.5 United States
6.6 Canada
7 Europe
7.1 Europe Pressure Swing Adsorption (PSA) Separation Technology Market Size (2020-2031)
7.2 Europe Pressure Swing Adsorption (PSA) Separation Technology Market Growth Rate by Country: 2020 VS 2024 VS 2031
7.3 Europe Pressure Swing Adsorption (PSA) Separation Technology Market Size by Country (2020-2025)
7.4 Europe Pressure Swing Adsorption (PSA) Separation Technology Market Size by Country (2026-2031)
7.5 Germany
7.6 France
7.7 U.K.
7.8 Italy
7.9 Russia
7.10 Nordic Countries
8 Asia-Pacific
8.1 Asia-Pacific Pressure Swing Adsorption (PSA) Separation Technology Market Size (2020-2031)
8.2 Asia-Pacific Pressure Swing Adsorption (PSA) Separation Technology Market Growth Rate by Region: 2020 VS 2024 VS 2031
8.3 Asia-Pacific Pressure Swing Adsorption (PSA) Separation Technology Market Size by Region (2020-2025)
8.4 Asia-Pacific Pressure Swing Adsorption (PSA) Separation Technology Market Size by Region (2026-2031)
8.5 China
8.6 Japan
8.7 South Korea
8.8 Southeast Asia
8.9 India
8.10 Australia
9 Latin America
9.1 Latin America Pressure Swing Adsorption (PSA) Separation Technology Market Size (2020-2031)
9.2 Latin America Pressure Swing Adsorption (PSA) Separation Technology Market Growth Rate by Country: 2020 VS 2024 VS 2031
9.3 Latin America Pressure Swing Adsorption (PSA) Separation Technology Market Size by Country (2020-2025)
9.4 Latin America Pressure Swing Adsorption (PSA) Separation Technology Market Size by Country (2026-2031)
9.5 Mexico
9.6 Brazil
10 Middle East & Africa
10.1 Middle East & Africa Pressure Swing Adsorption (PSA) Separation Technology Market Size (2020-2031)
10.2 Middle East & Africa Pressure Swing Adsorption (PSA) Separation Technology Market Growth Rate by Country: 2020 VS 2024 VS 2031
10.3 Middle East & Africa Pressure Swing Adsorption (PSA) Separation Technology Market Size by Country (2020-2025)
10.4 Middle East & Africa Pressure Swing Adsorption (PSA) Separation Technology Market Size by Country (2026-2031)
10.5 Turkey
10.6 Saudi Arabia
10.7 UAE
11 Key Players Profiles
11.1 Linde
11.1.1 Linde Company Details
11.1.2 Linde Business Overview
11.1.3 Linde Pressure Swing Adsorption (PSA) Separation Technology Introduction
11.1.4 Linde Revenue in Pressure Swing Adsorption (PSA) Separation Technology Business (2020-2025)
11.1.5 Linde Recent Development
11.2 Air Products
11.2.1 Air Products Company Details
11.2.2 Air Products Business Overview
11.2.3 Air Products Pressure Swing Adsorption (PSA) Separation Technology Introduction
11.2.4 Air Products Revenue in Pressure Swing Adsorption (PSA) Separation Technology Business (2020-2025)
11.2.5 Air Products Recent Development
11.3 Honeywell (UOP)
11.3.1 Honeywell (UOP) Company Details
11.3.2 Honeywell (UOP) Business Overview
11.3.3 Honeywell (UOP) Pressure Swing Adsorption (PSA) Separation Technology Introduction
11.3.4 Honeywell (UOP) Revenue in Pressure Swing Adsorption (PSA) Separation Technology Business (2020-2025)
11.3.5 Honeywell (UOP) Recent Development
11.4 Air Liquide
11.4.1 Air Liquide Company Details
11.4.2 Air Liquide Business Overview
11.4.3 Air Liquide Pressure Swing Adsorption (PSA) Separation Technology Introduction
11.4.4 Air Liquide Revenue in Pressure Swing Adsorption (PSA) Separation Technology Business (2020-2025)
11.4.5 Air Liquide Recent Development
11.5 Siemens
11.5.1 Siemens Company Details
11.5.2 Siemens Business Overview
11.5.3 Siemens Pressure Swing Adsorption (PSA) Separation Technology Introduction
11.5.4 Siemens Revenue in Pressure Swing Adsorption (PSA) Separation Technology Business (2020-2025)
11.5.5 Siemens Recent Development
11.6 Hanxing Energy
11.6.1 Hanxing Energy Company Details
11.6.2 Hanxing Energy Business Overview
11.6.3 Hanxing Energy Pressure Swing Adsorption (PSA) Separation Technology Introduction
11.6.4 Hanxing Energy Revenue in Pressure Swing Adsorption (PSA) Separation Technology Business (2020-2025)
11.6.5 Hanxing Energy Recent Development
11.7 Zeochem
11.7.1 Zeochem Company Details
11.7.2 Zeochem Business Overview
11.7.3 Zeochem Pressure Swing Adsorption (PSA) Separation Technology Introduction
11.7.4 Zeochem Revenue in Pressure Swing Adsorption (PSA) Separation Technology Business (2020-2025)
11.7.5 Zeochem Recent Development
11.8 Xebec Adsorption Inc.
11.8.1 Xebec Adsorption Inc. Company Details
11.8.2 Xebec Adsorption Inc. Business Overview
11.8.3 Xebec Adsorption Inc. Pressure Swing Adsorption (PSA) Separation Technology Introduction
11.8.4 Xebec Adsorption Inc. Revenue in Pressure Swing Adsorption (PSA) Separation Technology Business (2020-2025)
11.8.5 Xebec Adsorption Inc. Recent Development
11.9 Samson Technologies
11.9.1 Samson Technologies Company Details
11.9.2 Samson Technologies Business Overview
11.9.3 Samson Technologies Pressure Swing Adsorption (PSA) Separation Technology Introduction
11.9.4 Samson Technologies Revenue in Pressure Swing Adsorption (PSA) Separation Technology Business (2020-2025)
11.9.5 Samson Technologies Recent Development
11.10 Peak Scientific
11.10.1 Peak Scientific Company Details
11.10.2 Peak Scientific Business Overview
11.10.3 Peak Scientific Pressure Swing Adsorption (PSA) Separation Technology Introduction
11.10.4 Peak Scientific Revenue in Pressure Swing Adsorption (PSA) Separation Technology Business (2020-2025)
11.10.5 Peak Scientific Recent Development
11.11 Universal Industrial Gases, Inc
11.11.1 Universal Industrial Gases, Inc Company Details
11.11.2 Universal Industrial Gases, Inc Business Overview
11.11.3 Universal Industrial Gases, Inc Pressure Swing Adsorption (PSA) Separation Technology Introduction
11.11.4 Universal Industrial Gases, Inc Revenue in Pressure Swing Adsorption (PSA) Separation Technology Business (2020-2025)
11.11.5 Universal Industrial Gases, Inc Recent Development
11.12 BOGE
11.12.1 BOGE Company Details
11.12.2 BOGE Business Overview
11.12.3 BOGE Pressure Swing Adsorption (PSA) Separation Technology Introduction
11.12.4 BOGE Revenue in Pressure Swing Adsorption (PSA) Separation Technology Business (2020-2025)
11.12.5 BOGE Recent Development
11.13 CALORIC
11.13.1 CALORIC Company Details
11.13.2 CALORIC Business Overview
11.13.3 CALORIC Pressure Swing Adsorption (PSA) Separation Technology Introduction
11.13.4 CALORIC Revenue in Pressure Swing Adsorption (PSA) Separation Technology Business (2020-2025)
11.13.5 CALORIC Recent Development
11.14 Isolcell
11.14.1 Isolcell Company Details
11.14.2 Isolcell Business Overview
11.14.3 Isolcell Pressure Swing Adsorption (PSA) Separation Technology Introduction
11.14.4 Isolcell Revenue in Pressure Swing Adsorption (PSA) Separation Technology Business (2020-2025)
11.14.5 Isolcell Recent Development
11.15 Bauer Compressors
11.15.1 Bauer Compressors Company Details
11.15.2 Bauer Compressors Business Overview
11.15.3 Bauer Compressors Pressure Swing Adsorption (PSA) Separation Technology Introduction
11.15.4 Bauer Compressors Revenue in Pressure Swing Adsorption (PSA) Separation Technology Business (2020-2025)
11.15.5 Bauer Compressors Recent Development
11.16 Lummus Technology
11.16.1 Lummus Technology Company Details
11.16.2 Lummus Technology Business Overview
11.16.3 Lummus Technology Pressure Swing Adsorption (PSA) Separation Technology Introduction
11.16.4 Lummus Technology Revenue in Pressure Swing Adsorption (PSA) Separation Technology Business (2020-2025)
11.16.5 Lummus Technology Recent Development
11.17 Ivys (Xebec)
11.17.1 Ivys (Xebec) Company Details
11.17.2 Ivys (Xebec) Business Overview
11.17.3 Ivys (Xebec) Pressure Swing Adsorption (PSA) Separation Technology Introduction
11.17.4 Ivys (Xebec) Revenue in Pressure Swing Adsorption (PSA) Separation Technology Business (2020-2025)
11.17.5 Ivys (Xebec) Recent Development
11.18 Parker Hannifin
11.18.1 Parker Hannifin Company Details
11.18.2 Parker Hannifin Business Overview
11.18.3 Parker Hannifin Pressure Swing Adsorption (PSA) Separation Technology Introduction
11.18.4 Parker Hannifin Revenue in Pressure Swing Adsorption (PSA) Separation Technology Business (2020-2025)
11.18.5 Parker Hannifin Recent Development
11.19 SUMITOMO SEIKA
11.19.1 SUMITOMO SEIKA Company Details
11.19.2 SUMITOMO SEIKA Business Overview
11.19.3 SUMITOMO SEIKA Pressure Swing Adsorption (PSA) Separation Technology Introduction
11.19.4 SUMITOMO SEIKA Revenue in Pressure Swing Adsorption (PSA) Separation Technology Business (2020-2025)
11.19.5 SUMITOMO SEIKA Recent Development
11.20 Ally Hi-Tech
11.20.1 Ally Hi-Tech Company Details
11.20.2 Ally Hi-Tech Business Overview
11.20.3 Ally Hi-Tech Pressure Swing Adsorption (PSA) Separation Technology Introduction
11.20.4 Ally Hi-Tech Revenue in Pressure Swing Adsorption (PSA) Separation Technology Business (2020-2025)
11.20.5 Ally Hi-Tech Recent Development
11.21 Sepmem
11.21.1 Sepmem Company Details
11.21.2 Sepmem Business Overview
11.21.3 Sepmem Pressure Swing Adsorption (PSA) Separation Technology Introduction
11.21.4 Sepmem Revenue in Pressure Swing Adsorption (PSA) Separation Technology Business (2020-2025)
11.21.5 Sepmem Recent Development
11.22 Peking University Pioneer Technology
11.22.1 Peking University Pioneer Technology Company Details
11.22.2 Peking University Pioneer Technology Business Overview
11.22.3 Peking University Pioneer Technology Pressure Swing Adsorption (PSA) Separation Technology Introduction
11.22.4 Peking University Pioneer Technology Revenue in Pressure Swing Adsorption (PSA) Separation Technology Business (2020-2025)
11.22.5 Peking University Pioneer Technology Recent Development
11.23 Zhengda Air Separation Equipment
11.23.1 Zhengda Air Separation Equipment Company Details
11.23.2 Zhengda Air Separation Equipment Business Overview
11.23.3 Zhengda Air Separation Equipment Pressure Swing Adsorption (PSA) Separation Technology Introduction
11.23.4 Zhengda Air Separation Equipment Revenue in Pressure Swing Adsorption (PSA) Separation Technology Business (2020-2025)
11.23.5 Zhengda Air Separation Equipment Recent Development
11.24 Rich Gas Technology
11.24.1 Rich Gas Technology Company Details
11.24.2 Rich Gas Technology Business Overview
11.24.3 Rich Gas Technology Pressure Swing Adsorption (PSA) Separation Technology Introduction
11.24.4 Rich Gas Technology Revenue in Pressure Swing Adsorption (PSA) Separation Technology Business (2020-2025)
11.24.5 Rich Gas Technology Recent Development
12 Analyst's Viewpoints/Conclusions
13 Appendix
13.1 Research Methodology
13.1.1 Methodology/Research Approach
13.1.1.1 Research Programs/Design
13.1.1.2 Market Size Estimation
13.1.1.3 Market Breakdown and Data Triangulation
13.1.2 Data Source
13.1.2.1 Secondary Sources
13.1.2.2 Primary Sources
13.2 Author Details
13.3 Disclaimer
List of Tables
 Table 1. Global Pressure Swing Adsorption (PSA) Separation Technology Market Size Growth Rate by Type (US$ Million): 2020 VS 2024 VS 2031
 Table 2. Key Players of Nitrogen
 Table 3. Key Players of Oxygen
 Table 4. Key Players of Hydrogen
 Table 5. Key Players of Others
 Table 6. Global Pressure Swing Adsorption (PSA) Separation Technology Market Size Growth by Application (US$ Million): 2020 VS 2024 VS 2031
 Table 7. Global Pressure Swing Adsorption (PSA) Separation Technology Market Size by Region (US$ Million): 2020 VS 2024 VS 2031
 Table 8. Global Pressure Swing Adsorption (PSA) Separation Technology Market Size by Region (2020-2025) & (US$ Million)
 Table 9. Global Pressure Swing Adsorption (PSA) Separation Technology Market Share by Region (2020-2025)
 Table 10. Global Pressure Swing Adsorption (PSA) Separation Technology Forecasted Market Size by Region (2026-2031) & (US$ Million)
 Table 11. Global Pressure Swing Adsorption (PSA) Separation Technology Market Share by Region (2026-2031)
 Table 12. Pressure Swing Adsorption (PSA) Separation Technology Market Trends
 Table 13. Pressure Swing Adsorption (PSA) Separation Technology Market Drivers
 Table 14. Pressure Swing Adsorption (PSA) Separation Technology Market Challenges
 Table 15. Pressure Swing Adsorption (PSA) Separation Technology Market Restraints
 Table 16. Global Pressure Swing Adsorption (PSA) Separation Technology Revenue by Players (2020-2025) & (US$ Million)
 Table 17. Global Pressure Swing Adsorption (PSA) Separation Technology Market Share by Players (2020-2025)
 Table 18. Global Top Pressure Swing Adsorption (PSA) Separation Technology Players by Company Type (Tier 1, Tier 2, and Tier 3) & (based on the Revenue in Pressure Swing Adsorption (PSA) Separation Technology as of 2024)
 Table 19. Ranking of Global Top Pressure Swing Adsorption (PSA) Separation Technology Companies by Revenue (US$ Million) in 2024
 Table 20. Global 5 Largest Players Market Share by Pressure Swing Adsorption (PSA) Separation Technology Revenue (CR5 and HHI) & (2020-2025)
 Table 21. Global Key Players of Pressure Swing Adsorption (PSA) Separation Technology, Headquarters and Area Served
 Table 22. Global Key Players of Pressure Swing Adsorption (PSA) Separation Technology, Product and Application
 Table 23. Global Key Players of Pressure Swing Adsorption (PSA) Separation Technology, Date of Enter into This Industry
 Table 24. Mergers & Acquisitions, Expansion Plans
 Table 25. Global Pressure Swing Adsorption (PSA) Separation Technology Market Size by Type (2020-2025) & (US$ Million)
 Table 26. Global Pressure Swing Adsorption (PSA) Separation Technology Revenue Market Share by Type (2020-2025)
 Table 27. Global Pressure Swing Adsorption (PSA) Separation Technology Forecasted Market Size by Type (2026-2031) & (US$ Million)
 Table 28. Global Pressure Swing Adsorption (PSA) Separation Technology Revenue Market Share by Type (2026-2031)
 Table 29. Global Pressure Swing Adsorption (PSA) Separation Technology Market Size by Application (2020-2025) & (US$ Million)
 Table 30. Global Pressure Swing Adsorption (PSA) Separation Technology Revenue Market Share by Application (2020-2025)
 Table 31. Global Pressure Swing Adsorption (PSA) Separation Technology Forecasted Market Size by Application (2026-2031) & (US$ Million)
 Table 32. Global Pressure Swing Adsorption (PSA) Separation Technology Revenue Market Share by Application (2026-2031)
 Table 33. North America Pressure Swing Adsorption (PSA) Separation Technology Market Size Growth Rate by Country (US$ Million): 2020 VS 2024 VS 2031
 Table 34. North America Pressure Swing Adsorption (PSA) Separation Technology Market Size by Country (2020-2025) & (US$ Million)
 Table 35. North America Pressure Swing Adsorption (PSA) Separation Technology Market Size by Country (2026-2031) & (US$ Million)
 Table 36. Europe Pressure Swing Adsorption (PSA) Separation Technology Market Size Growth Rate by Country (US$ Million): 2020 VS 2024 VS 2031
 Table 37. Europe Pressure Swing Adsorption (PSA) Separation Technology Market Size by Country (2020-2025) & (US$ Million)
 Table 38. Europe Pressure Swing Adsorption (PSA) Separation Technology Market Size by Country (2026-2031) & (US$ Million)
 Table 39. Asia-Pacific Pressure Swing Adsorption (PSA) Separation Technology Market Size Growth Rate by Region (US$ Million): 2020 VS 2024 VS 2031
 Table 40. Asia-Pacific Pressure Swing Adsorption (PSA) Separation Technology Market Size by Region (2020-2025) & (US$ Million)
 Table 41. Asia-Pacific Pressure Swing Adsorption (PSA) Separation Technology Market Size by Region (2026-2031) & (US$ Million)
 Table 42. Latin America Pressure Swing Adsorption (PSA) Separation Technology Market Size Growth Rate by Country (US$ Million): 2020 VS 2024 VS 2031
 Table 43. Latin America Pressure Swing Adsorption (PSA) Separation Technology Market Size by Country (2020-2025) & (US$ Million)
 Table 44. Latin America Pressure Swing Adsorption (PSA) Separation Technology Market Size by Country (2026-2031) & (US$ Million)
 Table 45. Middle East & Africa Pressure Swing Adsorption (PSA) Separation Technology Market Size Growth Rate by Country (US$ Million): 2020 VS 2024 VS 2031
 Table 46. Middle East & Africa Pressure Swing Adsorption (PSA) Separation Technology Market Size by Country (2020-2025) & (US$ Million)
 Table 47. Middle East & Africa Pressure Swing Adsorption (PSA) Separation Technology Market Size by Country (2026-2031) & (US$ Million)
 Table 48. Linde Company Details
 Table 49. Linde Business Overview
 Table 50. Linde Pressure Swing Adsorption (PSA) Separation Technology Product
 Table 51. Linde Revenue in Pressure Swing Adsorption (PSA) Separation Technology Business (2020-2025) & (US$ Million)
 Table 52. Linde Recent Development
 Table 53. Air Products Company Details
 Table 54. Air Products Business Overview
 Table 55. Air Products Pressure Swing Adsorption (PSA) Separation Technology Product
 Table 56. Air Products Revenue in Pressure Swing Adsorption (PSA) Separation Technology Business (2020-2025) & (US$ Million)
 Table 57. Air Products Recent Development
 Table 58. Honeywell (UOP) Company Details
 Table 59. Honeywell (UOP) Business Overview
 Table 60. Honeywell (UOP) Pressure Swing Adsorption (PSA) Separation Technology Product
 Table 61. Honeywell (UOP) Revenue in Pressure Swing Adsorption (PSA) Separation Technology Business (2020-2025) & (US$ Million)
 Table 62. Honeywell (UOP) Recent Development
 Table 63. Air Liquide Company Details
 Table 64. Air Liquide Business Overview
 Table 65. Air Liquide Pressure Swing Adsorption (PSA) Separation Technology Product
 Table 66. Air Liquide Revenue in Pressure Swing Adsorption (PSA) Separation Technology Business (2020-2025) & (US$ Million)
 Table 67. Air Liquide Recent Development
 Table 68. Siemens Company Details
 Table 69. Siemens Business Overview
 Table 70. Siemens Pressure Swing Adsorption (PSA) Separation Technology Product
 Table 71. Siemens Revenue in Pressure Swing Adsorption (PSA) Separation Technology Business (2020-2025) & (US$ Million)
 Table 72. Siemens Recent Development
 Table 73. Hanxing Energy Company Details
 Table 74. Hanxing Energy Business Overview
 Table 75. Hanxing Energy Pressure Swing Adsorption (PSA) Separation Technology Product
 Table 76. Hanxing Energy Revenue in Pressure Swing Adsorption (PSA) Separation Technology Business (2020-2025) & (US$ Million)
 Table 77. Hanxing Energy Recent Development
 Table 78. Zeochem Company Details
 Table 79. Zeochem Business Overview
 Table 80. Zeochem Pressure Swing Adsorption (PSA) Separation Technology Product
 Table 81. Zeochem Revenue in Pressure Swing Adsorption (PSA) Separation Technology Business (2020-2025) & (US$ Million)
 Table 82. Zeochem Recent Development
 Table 83. Xebec Adsorption Inc. Company Details
 Table 84. Xebec Adsorption Inc. Business Overview
 Table 85. Xebec Adsorption Inc. Pressure Swing Adsorption (PSA) Separation Technology Product
 Table 86. Xebec Adsorption Inc. Revenue in Pressure Swing Adsorption (PSA) Separation Technology Business (2020-2025) & (US$ Million)
 Table 87. Xebec Adsorption Inc. Recent Development
 Table 88. Samson Technologies Company Details
 Table 89. Samson Technologies Business Overview
 Table 90. Samson Technologies Pressure Swing Adsorption (PSA) Separation Technology Product
 Table 91. Samson Technologies Revenue in Pressure Swing Adsorption (PSA) Separation Technology Business (2020-2025) & (US$ Million)
 Table 92. Samson Technologies Recent Development
 Table 93. Peak Scientific Company Details
 Table 94. Peak Scientific Business Overview
 Table 95. Peak Scientific Pressure Swing Adsorption (PSA) Separation Technology Product
 Table 96. Peak Scientific Revenue in Pressure Swing Adsorption (PSA) Separation Technology Business (2020-2025) & (US$ Million)
 Table 97. Peak Scientific Recent Development
 Table 98. Universal Industrial Gases, Inc Company Details
 Table 99. Universal Industrial Gases, Inc Business Overview
 Table 100. Universal Industrial Gases, Inc Pressure Swing Adsorption (PSA) Separation Technology Product
 Table 101. Universal Industrial Gases, Inc Revenue in Pressure Swing Adsorption (PSA) Separation Technology Business (2020-2025) & (US$ Million)
 Table 102. Universal Industrial Gases, Inc Recent Development
 Table 103. BOGE Company Details
 Table 104. BOGE Business Overview
 Table 105. BOGE Pressure Swing Adsorption (PSA) Separation Technology Product
 Table 106. BOGE Revenue in Pressure Swing Adsorption (PSA) Separation Technology Business (2020-2025) & (US$ Million)
 Table 107. BOGE Recent Development
 Table 108. CALORIC Company Details
 Table 109. CALORIC Business Overview
 Table 110. CALORIC Pressure Swing Adsorption (PSA) Separation Technology Product
 Table 111. CALORIC Revenue in Pressure Swing Adsorption (PSA) Separation Technology Business (2020-2025) & (US$ Million)
 Table 112. CALORIC Recent Development
 Table 113. Isolcell Company Details
 Table 114. Isolcell Business Overview
 Table 115. Isolcell Pressure Swing Adsorption (PSA) Separation Technology Product
 Table 116. Isolcell Revenue in Pressure Swing Adsorption (PSA) Separation Technology Business (2020-2025) & (US$ Million)
 Table 117. Isolcell Recent Development
 Table 118. Bauer Compressors Company Details
 Table 119. Bauer Compressors Business Overview
 Table 120. Bauer Compressors Pressure Swing Adsorption (PSA) Separation Technology Product
 Table 121. Bauer Compressors Revenue in Pressure Swing Adsorption (PSA) Separation Technology Business (2020-2025) & (US$ Million)
 Table 122. Bauer Compressors Recent Development
 Table 123. Lummus Technology Company Details
 Table 124. Lummus Technology Business Overview
 Table 125. Lummus Technology Pressure Swing Adsorption (PSA) Separation Technology Product
 Table 126. Lummus Technology Revenue in Pressure Swing Adsorption (PSA) Separation Technology Business (2020-2025) & (US$ Million)
 Table 127. Lummus Technology Recent Development
 Table 128. Ivys (Xebec) Company Details
 Table 129. Ivys (Xebec) Business Overview
 Table 130. Ivys (Xebec) Pressure Swing Adsorption (PSA) Separation Technology Product
 Table 131. Ivys (Xebec) Revenue in Pressure Swing Adsorption (PSA) Separation Technology Business (2020-2025) & (US$ Million)
 Table 132. Ivys (Xebec) Recent Development
 Table 133. Parker Hannifin Company Details
 Table 134. Parker Hannifin Business Overview
 Table 135. Parker Hannifin Pressure Swing Adsorption (PSA) Separation Technology Product
 Table 136. Parker Hannifin Revenue in Pressure Swing Adsorption (PSA) Separation Technology Business (2020-2025) & (US$ Million)
 Table 137. Parker Hannifin Recent Development
 Table 138. SUMITOMO SEIKA Company Details
 Table 139. SUMITOMO SEIKA Business Overview
 Table 140. SUMITOMO SEIKA Pressure Swing Adsorption (PSA) Separation Technology Product
 Table 141. SUMITOMO SEIKA Revenue in Pressure Swing Adsorption (PSA) Separation Technology Business (2020-2025) & (US$ Million)
 Table 142. SUMITOMO SEIKA Recent Development
 Table 143. Ally Hi-Tech Company Details
 Table 144. Ally Hi-Tech Business Overview
 Table 145. Ally Hi-Tech Pressure Swing Adsorption (PSA) Separation Technology Product
 Table 146. Ally Hi-Tech Revenue in Pressure Swing Adsorption (PSA) Separation Technology Business (2020-2025) & (US$ Million)
 Table 147. Ally Hi-Tech Recent Development
 Table 148. Sepmem Company Details
 Table 149. Sepmem Business Overview
 Table 150. Sepmem Pressure Swing Adsorption (PSA) Separation Technology Product
 Table 151. Sepmem Revenue in Pressure Swing Adsorption (PSA) Separation Technology Business (2020-2025) & (US$ Million)
 Table 152. Sepmem Recent Development
 Table 153. Peking University Pioneer Technology Company Details
 Table 154. Peking University Pioneer Technology Business Overview
 Table 155. Peking University Pioneer Technology Pressure Swing Adsorption (PSA) Separation Technology Product
 Table 156. Peking University Pioneer Technology Revenue in Pressure Swing Adsorption (PSA) Separation Technology Business (2020-2025) & (US$ Million)
 Table 157. Peking University Pioneer Technology Recent Development
 Table 158. Zhengda Air Separation Equipment Company Details
 Table 159. Zhengda Air Separation Equipment Business Overview
 Table 160. Zhengda Air Separation Equipment Pressure Swing Adsorption (PSA) Separation Technology Product
 Table 161. Zhengda Air Separation Equipment Revenue in Pressure Swing Adsorption (PSA) Separation Technology Business (2020-2025) & (US$ Million)
 Table 162. Zhengda Air Separation Equipment Recent Development
 Table 163. Rich Gas Technology Company Details
 Table 164. Rich Gas Technology Business Overview
 Table 165. Rich Gas Technology Pressure Swing Adsorption (PSA) Separation Technology Product
 Table 166. Rich Gas Technology Revenue in Pressure Swing Adsorption (PSA) Separation Technology Business (2020-2025) & (US$ Million)
 Table 167. Rich Gas Technology Recent Development
 Table 168. Research Programs/Design for This Report
 Table 169. Key Data Information from Secondary Sources
 Table 170. Key Data Information from Primary Sources
 Table 171. Authors List of This Report


List of Figures
 Figure 1. Pressure Swing Adsorption (PSA) Separation Technology Picture
 Figure 2. Global Pressure Swing Adsorption (PSA) Separation Technology Market Size Comparison by Type (2020-2031) & (US$ Million)
 Figure 3. Global Pressure Swing Adsorption (PSA) Separation Technology Market Share by Type: 2024 VS 2031
 Figure 4. Nitrogen Features
 Figure 5. Oxygen Features
 Figure 6. Hydrogen Features
 Figure 7. Others Features
 Figure 8. Global Pressure Swing Adsorption (PSA) Separation Technology Market Size by Application (2020-2031) & (US$ Million)
 Figure 9. Global Pressure Swing Adsorption (PSA) Separation Technology Market Share by Application: 2024 VS 2031
 Figure 10. Petroleum and Chemical Industry Case Studies
 Figure 11. Metal Smelting Case Studies
 Figure 12. Medical Case Studies
 Figure 13. Food and Beverage Case Studies
 Figure 14. Industrial Manufacturing Case Studies
 Figure 15. Others Case Studies
 Figure 16. Pressure Swing Adsorption (PSA) Separation Technology Report Years Considered
 Figure 17. Global Pressure Swing Adsorption (PSA) Separation Technology Market Size (US$ Million), Year-over-Year: 2020-2031
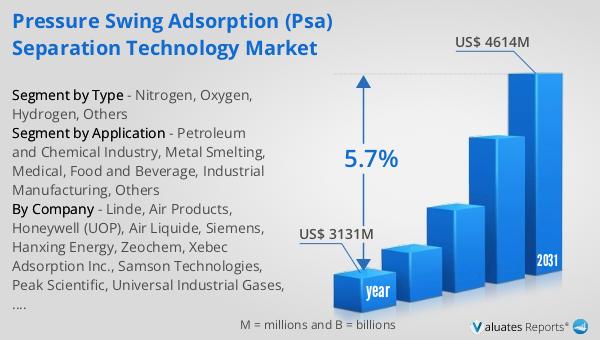
 Figure 18. Global Pressure Swing Adsorption (PSA) Separation Technology Market Size, (US$ Million), 2020 VS 2024 VS 2031
 Figure 19. Global Pressure Swing Adsorption (PSA) Separation Technology Market Share by Region: 2024 VS 2031
 Figure 20. Global Pressure Swing Adsorption (PSA) Separation Technology Market Share by Players in 2024
 Figure 21. Global Pressure Swing Adsorption (PSA) Separation Technology Market Share by Company Type (Tier 1, Tier 2, and Tier 3)
 Figure 22. The Top 10 and 5 Players Market Share by Pressure Swing Adsorption (PSA) Separation Technology Revenue in 2024
 Figure 23. North America Pressure Swing Adsorption (PSA) Separation Technology Market Size YoY Growth (2020-2031) & (US$ Million)
 Figure 24. North America Pressure Swing Adsorption (PSA) Separation Technology Market Share by Country (2020-2031)
 Figure 25. United States Pressure Swing Adsorption (PSA) Separation Technology Market Size YoY Growth (2020-2031) & (US$ Million)
 Figure 26. Canada Pressure Swing Adsorption (PSA) Separation Technology Market Size YoY Growth (2020-2031) & (US$ Million)
 Figure 27. Europe Pressure Swing Adsorption (PSA) Separation Technology Market Size YoY Growth (2020-2031) & (US$ Million)
 Figure 28. Europe Pressure Swing Adsorption (PSA) Separation Technology Market Share by Country (2020-2031)
 Figure 29. Germany Pressure Swing Adsorption (PSA) Separation Technology Market Size YoY Growth (2020-2031) & (US$ Million)
 Figure 30. France Pressure Swing Adsorption (PSA) Separation Technology Market Size YoY Growth (2020-2031) & (US$ Million)
 Figure 31. U.K. Pressure Swing Adsorption (PSA) Separation Technology Market Size YoY Growth (2020-2031) & (US$ Million)
 Figure 32. Italy Pressure Swing Adsorption (PSA) Separation Technology Market Size YoY Growth (2020-2031) & (US$ Million)
 Figure 33. Russia Pressure Swing Adsorption (PSA) Separation Technology Market Size YoY Growth (2020-2031) & (US$ Million)
 Figure 34. Nordic Countries Pressure Swing Adsorption (PSA) Separation Technology Market Size YoY Growth (2020-2031) & (US$ Million)
 Figure 35. Asia-Pacific Pressure Swing Adsorption (PSA) Separation Technology Market Size YoY Growth (2020-2031) & (US$ Million)
 Figure 36. Asia-Pacific Pressure Swing Adsorption (PSA) Separation Technology Market Share by Region (2020-2031)
 Figure 37. China Pressure Swing Adsorption (PSA) Separation Technology Market Size YoY Growth (2020-2031) & (US$ Million)
 Figure 38. Japan Pressure Swing Adsorption (PSA) Separation Technology Market Size YoY Growth (2020-2031) & (US$ Million)
 Figure 39. South Korea Pressure Swing Adsorption (PSA) Separation Technology Market Size YoY Growth (2020-2031) & (US$ Million)
 Figure 40. Southeast Asia Pressure Swing Adsorption (PSA) Separation Technology Market Size YoY Growth (2020-2031) & (US$ Million)
 Figure 41. India Pressure Swing Adsorption (PSA) Separation Technology Market Size YoY Growth (2020-2031) & (US$ Million)
 Figure 42. Australia Pressure Swing Adsorption (PSA) Separation Technology Market Size YoY Growth (2020-2031) & (US$ Million)
 Figure 43. Latin America Pressure Swing Adsorption (PSA) Separation Technology Market Size YoY Growth (2020-2031) & (US$ Million)
 Figure 44. Latin America Pressure Swing Adsorption (PSA) Separation Technology Market Share by Country (2020-2031)
 Figure 45. Mexico Pressure Swing Adsorption (PSA) Separation Technology Market Size YoY Growth (2020-2031) & (US$ Million)
 Figure 46. Brazil Pressure Swing Adsorption (PSA) Separation Technology Market Size YoY Growth (2020-2031) & (US$ Million)
 Figure 47. Middle East & Africa Pressure Swing Adsorption (PSA) Separation Technology Market Size YoY Growth (2020-2031) & (US$ Million)
 Figure 48. Middle East & Africa Pressure Swing Adsorption (PSA) Separation Technology Market Share by Country (2020-2031)
 Figure 49. Turkey Pressure Swing Adsorption (PSA) Separation Technology Market Size YoY Growth (2020-2031) & (US$ Million)
 Figure 50. Saudi Arabia Pressure Swing Adsorption (PSA) Separation Technology Market Size YoY Growth (2020-2031) & (US$ Million)
 Figure 51. UAE Pressure Swing Adsorption (PSA) Separation Technology Market Size YoY Growth (2020-2031) & (US$ Million)
 Figure 52. Linde Revenue Growth Rate in Pressure Swing Adsorption (PSA) Separation Technology Business (2020-2025)
 Figure 53. Air Products Revenue Growth Rate in Pressure Swing Adsorption (PSA) Separation Technology Business (2020-2025)
 Figure 54. Honeywell (UOP) Revenue Growth Rate in Pressure Swing Adsorption (PSA) Separation Technology Business (2020-2025)
 Figure 55. Air Liquide Revenue Growth Rate in Pressure Swing Adsorption (PSA) Separation Technology Business (2020-2025)
 Figure 56. Siemens Revenue Growth Rate in Pressure Swing Adsorption (PSA) Separation Technology Business (2020-2025)
 Figure 57. Hanxing Energy Revenue Growth Rate in Pressure Swing Adsorption (PSA) Separation Technology Business (2020-2025)
 Figure 58. Zeochem Revenue Growth Rate in Pressure Swing Adsorption (PSA) Separation Technology Business (2020-2025)
 Figure 59. Xebec Adsorption Inc. Revenue Growth Rate in Pressure Swing Adsorption (PSA) Separation Technology Business (2020-2025)
 Figure 60. Samson Technologies Revenue Growth Rate in Pressure Swing Adsorption (PSA) Separation Technology Business (2020-2025)
 Figure 61. Peak Scientific Revenue Growth Rate in Pressure Swing Adsorption (PSA) Separation Technology Business (2020-2025)
 Figure 62. Universal Industrial Gases, Inc Revenue Growth Rate in Pressure Swing Adsorption (PSA) Separation Technology Business (2020-2025)
 Figure 63. BOGE Revenue Growth Rate in Pressure Swing Adsorption (PSA) Separation Technology Business (2020-2025)
 Figure 64. CALORIC Revenue Growth Rate in Pressure Swing Adsorption (PSA) Separation Technology Business (2020-2025)
 Figure 65. Isolcell Revenue Growth Rate in Pressure Swing Adsorption (PSA) Separation Technology Business (2020-2025)
 Figure 66. Bauer Compressors Revenue Growth Rate in Pressure Swing Adsorption (PSA) Separation Technology Business (2020-2025)
 Figure 67. Lummus Technology Revenue Growth Rate in Pressure Swing Adsorption (PSA) Separation Technology Business (2020-2025)
 Figure 68. Ivys (Xebec) Revenue Growth Rate in Pressure Swing Adsorption (PSA) Separation Technology Business (2020-2025)
 Figure 69. Parker Hannifin Revenue Growth Rate in Pressure Swing Adsorption (PSA) Separation Technology Business (2020-2025)
 Figure 70. SUMITOMO SEIKA Revenue Growth Rate in Pressure Swing Adsorption (PSA) Separation Technology Business (2020-2025)
 Figure 71. Ally Hi-Tech Revenue Growth Rate in Pressure Swing Adsorption (PSA) Separation Technology Business (2020-2025)
 Figure 72. Sepmem Revenue Growth Rate in Pressure Swing Adsorption (PSA) Separation Technology Business (2020-2025)
 Figure 73. Peking University Pioneer Technology Revenue Growth Rate in Pressure Swing Adsorption (PSA) Separation Technology Business (2020-2025)
 Figure 74. Zhengda Air Separation Equipment Revenue Growth Rate in Pressure Swing Adsorption (PSA) Separation Technology Business (2020-2025)
 Figure 75. Rich Gas Technology Revenue Growth Rate in Pressure Swing Adsorption (PSA) Separation Technology Business (2020-2025)
 Figure 76. Bottom-up and Top-down Approaches for This Report
 Figure 77. Data Triangulation
 Figure 78. Key Executives Interviewed
SELECT A FORMAT
Added to Cart
Electronic (PDF)

$2900

This license allows only one user to access the PDF.
Electronic (PDF)

$4350

This license allows 1 - 5 user to access the PDF, license is suitable for small groups of 5 users working together
Electronic (PDF)

$5800

This license allows users/teams in a same Enterprise to use this report, various departments within an enterpise can use this report
Add to Cart
Buy Now (15% Discount)

OUR CUSTOMER

Strategic Venue Partners

SIMILAR REPORTS