List of Tables
Table 1. Global Market Material Testing Market Size (US$ Million) Comparison by Region 2018 VS 2022 VS 2029
Table 2. Global Material Testing Market Size by Region (2018-2023) & (US$ Million)
Table 3. Global Material Testing Market Size Share by Region (2018-2023)
Table 4. Global Material Testing Forecasted Market Size by Region (2024-2029) & (US$ Million)
Table 5. Global Material Testing Forecasted Market Size Share by Region (2024-2029)
Table 6. Global Material Testing Market Size (US$ Million) by Type: 2018 VS 2022 VS 2029
Table 7. Global Material Testing Market Size by Type (2018-2023) & (US$ Million)
Table 8. Global Material Testing Revenue Market Share by Type (2018-2023)
Table 9. Global Material Testing Forecasted Market Size by Type (2024-2029) & (US$ Million)
Table 10. Global Material Testing Revenue Market Share by Type (2024-2029)
Table 11. North America Material Testing Revenue by Type (2018-2023) & (US$ Million)
Table 12. North America Material Testing Revenue by Type (2024-2029) & (US$ Million)
Table 13. Europe Material Testing Revenue by Type (2018-2023) & (US$ Million)
Table 14. Europe Material Testing Revenue by Type (2024-2029) & (US$ Million)
Table 15. Asia-Pacific Material Testing Revenue by Type (2018-2023) & (US$ Million)
Table 16. Asia-Pacific Material Testing Revenue by Type (2024-2029) & (US$ Million)
Table 17. Latin America Material Testing Revenue by Type (2018-2023) & (US$ Million)
Table 18. Latin America Material Testing Revenue by Type (2024-2029) & (US$ Million)
Table 19. Middle East and Africa Material Testing Revenue by Type (2018-2023) & (US$ Million)
Table 20. Middle East and Africa Material Testing Revenue by Type (2024-2029) & (US$ Million)
Table 21. Global Material Testing Market Size (US$ Million) by Application: 2018 VS 2022 VS 2029
Table 22. Global Material Testing Market Size by Application (2018-2023) & (US$ Million)
Table 23. Global Material Testing Revenue Market Share by Application (2018-2023)
Table 24. Global Material Testing Forecasted Market Size by Application (2024-2029) & (US$ Million)
Table 25. Global Material Testing Revenue Market Share by Application (2024-2029)
Table 26. North America Material Testing Revenue by Application (2018-2023) & (US$ Million)
Table 27. North America Material Testing Revenue by Application (2024-2029) & (US$ Million)
Table 28. Europe Material Testing Revenue by Application (2018-2023) & (US$ Million)
Table 29. Europe Material Testing Revenue by Application (2024-2029) & (US$ Million)
Table 30. Asia-Pacific Material Testing Revenue by Application (2018-2023) & (US$ Million)
Table 31. Asia-Pacific Material Testing Revenue by Application (2024-2029) & (US$ Million)
Table 32. Latin America Material Testing Revenue by Application (2018-2023) & (US$ Million)
Table 33. Latin America Material Testing Revenue by Application (2024-2029) & (US$ Million)
Table 34. Middle East and Africa Material Testing Revenue by Application (2018-2023) & (US$ Million)
Table 35. Middle East and Africa Material Testing Revenue by Application (2024-2029) & (US$ Million)
Table 36. Global Material Testing Revenue (US$ Million) by Players (2018-2023)
Table 37. Global Material Testing Revenue Market Share by Players (2018-2023)
Table 38. Global Top Players Market Share by Company Type (Tier 1, Tier 2 and Tier 3) & (based on the Revenue in Material Testing as of 2022)
Table 39. Date of Key Players Enter into Material Testing Market
Table 40. Global Material Testing Key Players Headquarters and Area Served
Table 41. Material Testing Product Solution and Service
Table 42. Global Material Testing Players Market Concentration Ratio (CR5 and HHI)
Table 43. Mergers & Acquisitions, Expansion Plans
Table 44. Instron Basic Information List
Table 45. Instron Description and Business Overview
Table 46. Instron Material Testing Products, Services and Solutions
Table 47. Revenue (US$ Million) in Material Testing Business of Instron (2018-2023)
Table 48. Instron Recent Developments
Table 49. Zwick Roell Basic Information List
Table 50. Zwick Roell Description and Business Overview
Table 51. Zwick Roell Material Testing Products, Services and Solutions
Table 52. Revenue (US$ Million) in Material Testing Business of Zwick Roell (2018-2023)
Table 53. Zwick Roell Recent Developments
Table 54. Mts Systems Basic Information List
Table 55. Mts Systems Description and Business Overview
Table 56. Mts Systems Material Testing Products, Services and Solutions
Table 57. Revenue (US$ Million) in Material Testing Business of Mts Systems (2018-2023)
Table 58. Mts Systems Recent Developments
Table 59. Shimadzu Basic Information List
Table 60. Shimadzu Description and Business Overview
Table 61. Shimadzu Material Testing Products, Services and Solutions
Table 62. Revenue (US$ Million) in Material Testing Business of Shimadzu (2018-2023)
Table 63. Shimadzu Recent Developments
Table 64. Tinius Olsen Basic Information List
Table 65. Tinius Olsen Description and Business Overview
Table 66. Tinius Olsen Material Testing Products, Services and Solutions
Table 67. Revenue (US$ Million) in Material Testing Business of Tinius Olsen (2018-2023)
Table 68. Tinius Olsen Recent Developments
Table 69. Ametek Basic Information List
Table 70. Ametek Description and Business Overview
Table 71. Ametek Material Testing Products, Services and Solutions
Table 72. Revenue (US$ Million) in Material Testing Business of Ametek (2018-2023)
Table 73. Ametek Recent Developments
Table 74. Admet Basic Information List
Table 75. Admet Description and Business Overview
Table 76. Admet Material Testing Products, Services and Solutions
Table 77. Revenue (US$ Million) in Material Testing Business of Admet (2018-2023)
Table 78. Admet Recent Developments
Table 79. Hegewald & Peschke Basic Information List
Table 80. Hegewald & Peschke Description and Business Overview
Table 81. Hegewald & Peschke Material Testing Products, Services and Solutions
Table 82. Revenue (US$ Million) in Material Testing Business of Hegewald & Peschke (2018-2023)
Table 83. Hegewald & Peschke Recent Developments
Table 84. Applied Test Systems Basic Information List
Table 85. Applied Test Systems Description and Business Overview
Table 86. Applied Test Systems Material Testing Products, Services and Solutions
Table 87. Revenue (US$ Million) in Material Testing Business of Applied Test Systems (2018-2023)
Table 88. Applied Test Systems Recent Developments
Table 89. Mitutoyo Basic Information List
Table 90. Mitutoyo Description and Business Overview
Table 91. Mitutoyo Material Testing Products, Services and Solutions
Table 92. Revenue (US$ Million) in Material Testing Business of Mitutoyo (2018-2023)
Table 93. Mitutoyo Recent Developments
Table 94. Ta Instruments Basic Information List
Table 95. Ta Instruments Description and Business Overview
Table 96. Ta Instruments Material Testing Products, Services and Solutions
Table 97. Revenue (US$ Million) in Material Testing Business of Ta Instruments (2018-2023)
Table 98. Ta Instruments Recent Developments
Table 99. Torontech Basic Information List
Table 100. Torontech Description and Business Overview
Table 101. Torontech Material Testing Products, Services and Solutions
Table 102. Revenue (US$ Million) in Material Testing Business of Torontech (2018-2023)
Table 103. Torontech Recent Developments
Table 104. Qualitest International Basic Information List
Table 105. Qualitest International Description and Business Overview
Table 106. Qualitest International Material Testing Products, Services and Solutions
Table 107. Revenue (US$ Million) in Material Testing Business of Qualitest International (2018-2023)
Table 108. Qualitest International Recent Developments
Table 109. Ets Intarlaken Basic Information List
Table 110. Ets Intarlaken Description and Business Overview
Table 111. Ets Intarlaken Material Testing Products, Services and Solutions
Table 112. Revenue (US$ Million) in Material Testing Business of Ets Intarlaken (2018-2023)
Table 113. Ets Intarlaken Recent Developments
Table 114. Struers Basic Information List
Table 115. Struers Description and Business Overview
Table 116. Struers Material Testing Products, Services and Solutions
Table 117. Revenue (US$ Million) in Material Testing Business of Struers (2018-2023)
Table 118. Struers Recent Developments
Table 119. North America Material Testing Market Size by Country (2018-2023) & (US$ Million)
Table 120. North America Material Testing Market Size by Country (2024-2029) & (US$ Million)
Table 121. Europe Material Testing Market Size by Country (2018-2023) & (US$ Million)
Table 122. Europe Material Testing Market Size by Country (2024-2029) & (US$ Million)
Table 123. Asia-Pacific Material Testing Market Size Growth Rate (CAGR) by Region (US$ Million): 2018 VS 2022 VS 2029
Table 124. Asia-Pacific Material Testing Market Size by Region (2018-2023) & (US$ Million)
Table 125. Asia-Pacific Material Testing Market Size by Region (2024-2029) & (US$ Million)
Table 126. Asia-Pacific Material Testing Market Share by Region (2018-2023)
Table 127. Asia-Pacific Material Testing Market Share by Region (2024-2029)
Table 128. Latin America Material Testing Market Size Growth Rate (CAGR) by Region (US$ Million): 2018 VS 2022 VS 2029
Table 129. Latin America Material Testing Market Size by Country (2018-2023) & (US$ Million)
Table 130. Latin America Material Testing Market Size by Country (2024-2029) & (US$ Million)
Table 131. Middle East & Africa Material Testing Market Size Growth Rate (CAGR) by Region (US$ Million): 2018 VS 2022 VS 2029
Table 132. Middle East & Africa Material Testing Market Size by Country (2018-2023) & (US$ Million)
Table 133. Middle East & Africa Material Testing Market Size by Country (2024-2029) & (US$ Million)
Table 134. Material Testing Market Trends
Table 135. Material Testing Market Drivers
Table 136. Material Testing Market Challenges
Table 137. Material Testing Market Restraints
Table 138. Research Programs/Design for This Report
Table 139. Key Data Information from Secondary Sources
Table 140. Key Data Information from Primary Sources
List of Figures
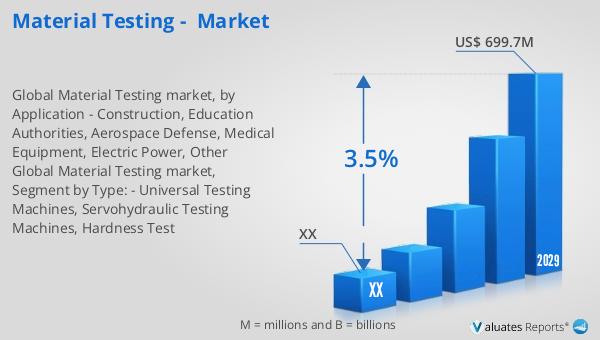
Figure 1. Global Material Testing Market Size Year-over-Year 2018-2029 & (US$ Million)
Figure 2. Global Material Testing Market Size (US$ Million), 2018 VS 2022 VS 2029
Figure 3. Global Material Testing Market Share by Regions: 2022 VS 2029
Figure 4. Global Material Testing Forecasted Market Size Share by Region (2024-2029)
Figure 5. North America Material Testing Market Size Growth Rate (2018-2029) & (US$ Million)
Figure 6. Europe Material Testing Market Size Growth Rate (2018-2029) & (US$ Million)
Figure 7. Asia-Pacific Material Testing Market Size Growth Rate (2018-2029) & (US$ Million)
Figure 8. Latin America Material Testing Market Size Growth Rate (2018-2029) & (US$ Million)
Figure 9. Middle East & Africa Material Testing Market Size Growth Rate (2018-2029) & (US$ Million)
Figure 10. Product Picture of Universal Testing Machines
Figure 11. Global Universal Testing Machines Market Size (US$ Million) & YoY Growth (2018-2029)
Figure 12. Product Picture of Servohydraulic Testing Machines
Figure 13. Global Servohydraulic Testing Machines Market Size (US$ Million) & YoY Growth (2018-2029)
Figure 14. Product Picture of Hardness Test
Figure 15. Global Hardness Test Market Size (US$ Million) & YoY Growth (2018-2029)
Figure 16. Global Material Testing Market Size Share by Type: 2022 & 2029
Figure 17. North America Material Testing Revenue Market Share by Type (2018-2029)
Figure 18. Europe Material Testing Revenue Market Share by Type (2018-2029)
Figure 19. Asia-Pacific Material Testing Revenue Market Share by Type (2018-2029)
Figure 20. Latin America Material Testing Revenue Market Share by Type (2018-2029)
Figure 21. Middle East and Africa Material Testing Revenue Market Share by Type (2018-2029)
Figure 22. Construction Market Size (US$ Million) & YoY Growth (2018-2029)
Figure 23. Education Authorities Market Size (US$ Million) & YoY Growth (2018-2029)
Figure 24. Aerospace Defense Market Size (US$ Million) & YoY Growth (2018-2029)
Figure 25. Medical Equipment Market Size (US$ Million) & YoY Growth (2018-2029)
Figure 26. Electric Power Market Size (US$ Million) & YoY Growth (2018-2029)
Figure 27. Other Market Size (US$ Million) & YoY Growth (2018-2029)
Figure 28. Global Material Testing Market Size Share by Application: 2022 & 2029
Figure 29. North America Material Testing Revenue Market Share by Application (2018-2029)
Figure 30. Europe Material Testing Revenue Market Share by Application (2018-2029)
Figure 31. Asia-Pacific Material Testing Revenue Market Share by Application (2018-2029)
Figure 32. Latin America Material Testing Revenue Market Share by Application (2018-2029)
Figure 33. Middle East and Africa Material Testing Revenue Market Share by Application (2018-2029)
Figure 34. Material Testing Market Share by Company Type (Tier 1, Tier 2 and Tier 3): 2018 VS 2022
Figure 35. Global Top 5 and Top 10 Players Material Testing Market Share in 2022
Figure 36. North America Material Testing Market Share by Country (2018-2029)
Figure 37. U.S. Material Testing Market Size (2018-2029) & (US$ Million)
Figure 38. Canada Material Testing Market Size (2018-2029) & (US$ Million)
Figure 39. Germany Material Testing Market Size (2018-2029) & (US$ Million)
Figure 40. France Material Testing Market Size (2018-2029) & (US$ Million)
Figure 41. U.K. Material Testing Market Size (2018-2029) & (US$ Million)
Figure 42. Italy Material Testing Market Size (2018-2029) & (US$ Million)
Figure 43. Russia Material Testing Market Size (2018-2029) & (US$ Million)
Figure 44. Nordic Countries Material Testing Market Size (2018-2029) & (US$ Million)
Figure 45. Asia-Pacific Material Testing Market Share by Region (2018-2029)
Figure 46. China Material Testing Market Size (2018-2029) & (US$ Million)
Figure 47. Japan Material Testing Market Size (2018-2029) & (US$ Million)
Figure 48. South Korea Material Testing Market Size (2018-2029) & (US$ Million)
Figure 49. Southeast Asia Material Testing Market Size (2018-2029) & (US$ Million)
Figure 50. India Material Testing Market Size (2018-2029) & (US$ Million)
Figure 51. Australia Material Testing Market Size (2018-2029) & (US$ Million)
Figure 52. Latin America Material Testing Market Share by Country (2018-2029)
Figure 53. Mexico Material Testing Market Size (2018-2029) & (US$ Million)
Figure 54. Brazil Material Testing Market Size (2018-2029) & (US$ Million)
Figure 55. Middle East & Africa Material Testing Market Share by Country (2018-2029)
Figure 56. Turkey Material Testing Market Size (2018-2029) & (US$ Million)
Figure 57. Saudi Arabia Material Testing Market Size (2018-2029) & (US$ Million)
Figure 58. UAE Material Testing Market Size (2018-2029) & (US$ Million)
Figure 59. Bottom-up and Top-down Approaches for This Report