List of Tables
Table 1. Laboratory Bottle-Top Dispenser CAGR in Value, India VS Global, 2018 VS 2022 VS 2029
Table 2. Laboratory Bottle-Top Dispenser Market Trends
Table 3. Laboratory Bottle-Top Dispenser Market Drivers
Table 4. Laboratory Bottle-Top Dispenser Market Challenges
Table 5. Laboratory Bottle-Top Dispenser Market Restraints
Table 6. Global Laboratory Bottle-Top Dispenser Sales Growth Rate (CAGR) by Type: 2018 VS 2022 VS 2029 (US$ Million)
Table 7. India Laboratory Bottle-Top Dispenser Sales Growth Rate (CAGR) by Type: 2018 VS 2022 VS 2029 (US$ Million)
Table 8. Global Laboratory Bottle-Top Dispenser Sales Growth Rate (CAGR) by Application: 2018 VS 2022 VS 2029 (US$ Million)
Table 9. India Laboratory Bottle-Top Dispenser Sales Growth Rate (CAGR) by Application: 2018 VS 2022 VS 2029 (US$ Million)
Table 10. Global Key Manufacturers of Laboratory Bottle-Top Dispenser, Ranked by Revenue (2022) & (US$ Million)
Table 11. Global Laboratory Bottle-Top Dispenser Revenue by Manufacturer, (US$ Million), 2018-2023
Table 12. Global Laboratory Bottle-Top Dispenser Revenue Share by Manufacturer, 2018-2023
Table 13. Global Laboratory Bottle-Top Dispenser Sales by Manufacturer, (K Units), 2018-2023
Table 14. Global Laboratory Bottle-Top Dispenser Sales Share by Manufacturer, 2018-2023
Table 15. Global Laboratory Bottle-Top Dispenser Price by Manufacturer (2018-2023) & (USD/Unit)
Table 16. Global Laboratory Bottle-Top Dispenser Manufacturers Market Concentration Ratio (CR5 and HHI)
Table 17. Global Laboratory Bottle-Top Dispenser by Company Type (Tier 1, Tier 2, and Tier 3) & (based on the Revenue in Laboratory Bottle-Top Dispenser as of 2022)
Table 18. Global Key Manufacturers of Laboratory Bottle-Top Dispenser, Manufacturing Base Distribution and Headquarters
Table 19. Global Key Manufacturers of Laboratory Bottle-Top Dispenser, Product Offered and Application
Table 20. Global Key Manufacturers of Laboratory Bottle-Top Dispenser, Date of Enter into This Industry
Table 21. Manufacturers Mergers & Acquisitions, Expansion Plans
Table 22. Key Players of Laboratory Bottle-Top Dispenser in India, Ranked by Revenue (2022) & (US$ million)
Table 23. India Laboratory Bottle-Top Dispenser Revenue by Players, (US$ Million), (2018-2023)
Table 24. India Laboratory Bottle-Top Dispenser Revenue Share by Players, (2018-2023)
Table 25. India Laboratory Bottle-Top Dispenser Sales by Players, (K Units), (2018-2023)
Table 26. India Laboratory Bottle-Top Dispenser Sales Share by Players, (2018-2023)
Table 27. Global Laboratory Bottle-Top Dispenser Market Size Growth Rate (CAGR) by Region (US$ Million): 2018 VS 2022 VS 2029
Table 28. Global Laboratory Bottle-Top Dispenser Sales in Volume by Region (2018-2023) & (K Units)
Table 29. Global Laboratory Bottle-Top Dispenser Sales in Volume Forecast by Region (2024-2029) & (K Units)
Table 30. Global Laboratory Bottle-Top Dispenser Sales in Value by Region (2018-2023) & (US$ Million)
Table 31. Global Laboratory Bottle-Top Dispenser Sales in Value Forecast by Region (2024-2029) & (US$ Million)
Table 32. Americas Laboratory Bottle-Top Dispenser Market Size Growth Rate (CAGR) by Country (US$ Million): 2018 VS 2022 VS 2029
Table 33. Americas Laboratory Bottle-Top Dispenser Sales in Value by Country (2018-2023) & (US$ Million)
Table 34. Americas Laboratory Bottle-Top Dispenser Sales in Value by Country (2024-2029) & (US$ Million)
Table 35. Americas Laboratory Bottle-Top Dispenser Sales in Volume by Country (2018-2023) & (K Units)
Table 36. Americas Laboratory Bottle-Top Dispenser Sales in Volume by Country (2024-2029) & (K Units)
Table 37. EMEA Laboratory Bottle-Top Dispenser Market Size Growth Rate (CAGR) by Country (US$ Million): 2018 VS 2022 VS 2029
Table 38. EMEA Laboratory Bottle-Top Dispenser Sales in Value by Country (2018-2023) & (US$ Million)
Table 39. EMEA Laboratory Bottle-Top Dispenser Sales in Value by Country (2024-2029) & (US$ Million)
Table 40. EMEA Laboratory Bottle-Top Dispenser Sales in Volume by Country (2018-2023) & (K Units)
Table 41. EMEA Laboratory Bottle-Top Dispenser Sales in Volume by Country (2024-2029) & (K Units)
Table 42. APAC Laboratory Bottle-Top Dispenser Market Size Growth Rate (CAGR) by Country (US$ Million): 2018 VS 2022 VS 2029
Table 43. APAC Laboratory Bottle-Top Dispenser Sales in Value by Country (2018-2023) & (US$ Million)
Table 44. APAC Laboratory Bottle-Top Dispenser Sales in Value by Country (2024-2029) & (US$ Million)
Table 45. APAC Laboratory Bottle-Top Dispenser Sales in Volume by Country (2018-2023) & (K Units)
Table 46. APAC Laboratory Bottle-Top Dispenser Sales in Volume by Country (2024-2029) & (K Units)
Table 47. Brand Company Information
Table 48. Brand Description and Business Overview
Table 49. Brand Laboratory Bottle-Top Dispenser Sales (K Units), Revenue (US$ Million), Price (USD/Unit) and Gross Margin (2018-2023)
Table 50. Brand Laboratory Bottle-Top Dispenser Product
Table 51. Brand Recent Development
Table 52. Sartorius Company Information
Table 53. Sartorius Description and Business Overview
Table 54. Sartorius Laboratory Bottle-Top Dispenser Sales (K Units), Revenue (US$ Million), Price (USD/Unit) and Gross Margin (2018-2023)
Table 55. Sartorius Laboratory Bottle-Top Dispenser Product
Table 56. Sartorius Recent Development
Table 57. Eppendorf Company Information
Table 58. Eppendorf Description and Business Overview
Table 59. Eppendorf Laboratory Bottle-Top Dispenser Sales (K Units), Revenue (US$ Million), Price (USD/Unit) and Gross Margin (2018-2023)
Table 60. Eppendorf Laboratory Bottle-Top Dispenser Product
Table 61. Eppendorf Recent Development
Table 62. Hirschmann Company Information
Table 63. Hirschmann Description and Business Overview
Table 64. Hirschmann Laboratory Bottle-Top Dispenser Sales (K Units), Revenue (US$ Million), Price (USD/Unit) and Gross Margin (2018-2023)
Table 65. Hirschmann Laboratory Bottle-Top Dispenser Product
Table 66. Hirschmann Recent Development
Table 67. Thermo Fisher Company Information
Table 68. Thermo Fisher Description and Business Overview
Table 69. Thermo Fisher Laboratory Bottle-Top Dispenser Sales (K Units), Revenue (US$ Million), Price (USD/Unit) and Gross Margin (2018-2023)
Table 70. Thermo Fisher Laboratory Bottle-Top Dispenser Product
Table 71. Thermo Fisher Recent Development
Table 72. VWR Company Information
Table 73. VWR Description and Business Overview
Table 74. VWR Laboratory Bottle-Top Dispenser Sales (K Units), Revenue (US$ Million), Price (USD/Unit) and Gross Margin (2018-2023)
Table 75. VWR Laboratory Bottle-Top Dispenser Product
Table 76. VWR Recent Development
Table 77. Hamilton Company Information
Table 78. Hamilton Description and Business Overview
Table 79. Hamilton Laboratory Bottle-Top Dispenser Sales (K Units), Revenue (US$ Million), Price (USD/Unit) and Gross Margin (2018-2023)
Table 80. Hamilton Laboratory Bottle-Top Dispenser Product
Table 81. Hamilton Recent Development
Table 82. Bibby Scientific Company Information
Table 83. Bibby Scientific Description and Business Overview
Table 84. Bibby Scientific Laboratory Bottle-Top Dispenser Sales (K Units), Revenue (US$ Million), Price (USD/Unit) and Gross Margin (2018-2023)
Table 85. Bibby Scientific Laboratory Bottle-Top Dispenser Product
Table 86. Bibby Scientific Recent Development
Table 87. Kartell Company Information
Table 88. Kartell Description and Business Overview
Table 89. Kartell Laboratory Bottle-Top Dispenser Sales (K Units), Revenue (US$ Million), Price (USD/Unit) and Gross Margin (2018-2023)
Table 90. Kartell Laboratory Bottle-Top Dispenser Product
Table 91. Kartell Recent Development
Table 92. Grifols Company Information
Table 93. Grifols Description and Business Overview
Table 94. Grifols Laboratory Bottle-Top Dispenser Sales (K Units), Revenue (US$ Million), Price (USD/Unit) and Gross Margin (2018-2023)
Table 95. Grifols Laboratory Bottle-Top Dispenser Product
Table 96. Grifols Recent Development
Table 97. DLAB Company Information
Table 98. DLAB Description and Business Overview
Table 99. DLAB Laboratory Bottle-Top Dispenser Sales (K Units), Revenue (US$ Million), Price (USD/Unit) and Gross Margin (2018-2023)
Table 100. DLAB Laboratory Bottle-Top Dispenser Product
Table 101. DLAB Recent Development
Table 102. Socorex Company Information
Table 103. Socorex Description and Business Overview
Table 104. Socorex Laboratory Bottle-Top Dispenser Sales (K Units), Revenue (US$ Million), Price (USD/Unit) and Gross Margin (2018-2023)
Table 105. Socorex Laboratory Bottle-Top Dispenser Product
Table 106. Socorex Recent Development
Table 107. Nichiryo Company Information
Table 108. Nichiryo Description and Business Overview
Table 109. Nichiryo Laboratory Bottle-Top Dispenser Sales (K Units), Revenue (US$ Million), Price (USD/Unit) and Gross Margin (2018-2023)
Table 110. Nichiryo Laboratory Bottle-Top Dispenser Product
Table 111. Nichiryo Recent Development
Table 112. Auxilab Company Information
Table 113. Auxilab Description and Business Overview
Table 114. Auxilab Laboratory Bottle-Top Dispenser Sales (K Units), Revenue (US$ Million), Price (USD/Unit) and Gross Margin (2018-2023)
Table 115. Auxilab Laboratory Bottle-Top Dispenser Product
Table 116. Auxilab Recent Development
Table 117. Assistent Company Information
Table 118. Assistent Description and Business Overview
Table 119. Assistent Laboratory Bottle-Top Dispenser Sales (K Units), Revenue (US$ Million), Price (USD/Unit) and Gross Margin (2018-2023)
Table 120. Assistent Laboratory Bottle-Top Dispenser Product
Table 121. Assistent Recent Development
Table 122. LabSciences Company Information
Table 123. LabSciences Description and Business Overview
Table 124. LabSciences Laboratory Bottle-Top Dispenser Sales (K Units), Revenue (US$ Million), Price (USD/Unit) and Gross Margin (2018-2023)
Table 125. LabSciences Laboratory Bottle-Top Dispenser Product
Table 126. LabSciences Recent Development
Table 127. Key Raw Materials Lists
Table 128. Raw Materials Key Suppliers Lists
Table 129. Laboratory Bottle-Top Dispenser Customers List
Table 130. Laboratory Bottle-Top Dispenser Distributors List
Table 131. Research Programs/Design for This Report
Table 132. Key Data Information from Secondary Sources
Table 133. Key Data Information from Primary Sources
List of Figures
Figure 1. Laboratory Bottle-Top Dispenser Product Picture
Figure 2. Global Laboratory Bottle-Top Dispenser Revenue, (US$ Million), 2018 VS 2022 VS 2029
Figure 3. Global Laboratory Bottle-Top Dispenser Market Size 2018-2029 (US$ Million)
Figure 4. Global Laboratory Bottle-Top Dispenser Sales 2018-2029 (K Units)
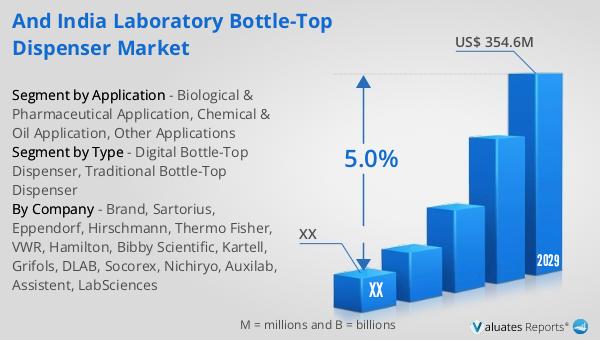
Figure 5. India Laboratory Bottle-Top Dispenser Revenue, (US$ Million), 2018 VS 2022 VS 2029
Figure 6. India Laboratory Bottle-Top Dispenser Market Size 2018-2029 (US$ Million)
Figure 7. India Laboratory Bottle-Top Dispenser Sales 2018-2029 (K Units)
Figure 8. India Laboratory Bottle-Top Dispenser Market Share in Global, in Value (US$ Million) 2018-2029
Figure 9. India Laboratory Bottle-Top Dispenser Market Share in Global, in Volume (K Units) 2018-2029
Figure 10. Laboratory Bottle-Top Dispenser Report Years Considered
Figure 11. Product Picture of Digital Bottle-Top Dispenser
Figure 12. Product Picture of Traditional Bottle-Top Dispenser
Figure 13. Global Laboratory Bottle-Top Dispenser Market Share by Type in 2022 & 2029
Figure 14. Global Laboratory Bottle-Top Dispenser Sales in Value by Type (2018-2029) & (US$ Million)
Figure 15. Global Laboratory Bottle-Top Dispenser Sales Market Share in Value by Type (2018-2029)
Figure 16. Global Laboratory Bottle-Top Dispenser Sales by Type (2018-2029) & (K Units)
Figure 17. Global Laboratory Bottle-Top Dispenser Sales Market Share in Volume by Type (2018-2029)
Figure 18. Global Laboratory Bottle-Top Dispenser Price by Type (2018-2029) & (USD/Unit)
Figure 19. India Laboratory Bottle-Top Dispenser Market Share by Type in 2022 & 2029
Figure 20. India Laboratory Bottle-Top Dispenser Sales in Value by Type (2018-2029) & (US$ Million)
Figure 21. India Laboratory Bottle-Top Dispenser Sales Market Share in Value by Type (2018-2029)
Figure 22. India Laboratory Bottle-Top Dispenser Sales by Type (2018-2029) & (K Units)
Figure 23. India Laboratory Bottle-Top Dispenser Sales Market Share in Volume by Type (2018-2029)
Figure 24. India Laboratory Bottle-Top Dispenser Price by Type (2018-2029) & (USD/Unit)
Figure 25. Product Picture of Biological & Pharmaceutical Application
Figure 26. Product Picture of Chemical & Oil Application
Figure 27. Product Picture of Other Applications
Figure 28. Global Laboratory Bottle-Top Dispenser Market Share by Application in 2022 & 2029
Figure 29. Global Laboratory Bottle-Top Dispenser Sales in Value by Application (2018-2029) & (US$ Million)
Figure 30. Global Laboratory Bottle-Top Dispenser Sales Market Share in Value by Application (2018-2029)
Figure 31. Global Laboratory Bottle-Top Dispenser Sales by Application (2018-2029) & (K Units)
Figure 32. Global Laboratory Bottle-Top Dispenser Sales Market Share in Volume by Application (2018-2029)
Figure 33. Global Laboratory Bottle-Top Dispenser Price by Application (2018-2029) & (USD/Unit)
Figure 34. India Laboratory Bottle-Top Dispenser Market Share by Application in 2022 & 2029
Figure 35. India Laboratory Bottle-Top Dispenser Sales in Value by Application (2018-2029) & (US$ Million)
Figure 36. India Laboratory Bottle-Top Dispenser Sales Market Share in Value by Application (2018-2029)
Figure 37. India Laboratory Bottle-Top Dispenser Sales by Application (2018-2029) & (K Units)
Figure 38. India Laboratory Bottle-Top Dispenser Sales Market Share in Volume by Application (2018-2029)
Figure 39. India Laboratory Bottle-Top Dispenser Price by Application (2018-2029) & (USD/Unit)
Figure 40. Americas Laboratory Bottle-Top Dispenser Sales in Volume Growth Rate 2018-2029 (K Units)
Figure 41. Americas Laboratory Bottle-Top Dispenser Sales in Value Growth Rate 2018-2029 (US$ Million)
Figure 42. Americas Laboratory Bottle-Top Dispenser Sales by Type (2018-2029) & (K Units)
Figure 43. Americas Laboratory Bottle-Top Dispenser Sales Market Share in Volume by Type (2018-2029)
Figure 44. Americas Laboratory Bottle-Top Dispenser Sales by Application (2018-2029) & (K Units)
Figure 45. Americas Laboratory Bottle-Top Dispenser Sales Market Share in Volume by Application (2018-2029)
Figure 46. United States Laboratory Bottle-Top Dispenser Sales in Value Growth Rate (2018-2029) & (US$ Million)
Figure 47. Canada Laboratory Bottle-Top Dispenser Sales in Value Growth Rate (2018-2029) & (US$ Million)
Figure 48. Mexico Laboratory Bottle-Top Dispenser Sales in Value Growth Rate (2018-2029) & (US$ Million)
Figure 49. Brazil Laboratory Bottle-Top Dispenser Sales in Value Growth Rate (2018-2029) & (US$ Million)
Figure 50. EMEA Laboratory Bottle-Top Dispenser Sales in Volume Growth Rate 2018-2029 (K Units)
Figure 51. EMEA Laboratory Bottle-Top Dispenser Sales in Value Growth Rate 2018-2029 (US$ Million)
Figure 52. EMEA Laboratory Bottle-Top Dispenser Sales by Type (2018-2029) & (K Units)
Figure 53. EMEA Laboratory Bottle-Top Dispenser Sales Market Share in Volume by Type (2018-2029)
Figure 54. EMEA Laboratory Bottle-Top Dispenser Sales by Application (2018-2029) & (K Units)
Figure 55. EMEA Laboratory Bottle-Top Dispenser Sales Market Share in Volume by Application (2018-2029)
Figure 56. Europe Laboratory Bottle-Top Dispenser Sales in Value Growth Rate (2018-2029) & (US$ Million)
Figure 57. Middle East Laboratory Bottle-Top Dispenser Sales in Value Growth Rate (2018-2029) & (US$ Million)
Figure 58. Africa Laboratory Bottle-Top Dispenser Sales in Value Growth Rate (2018-2029) & (US$ Million)
Figure 59. China Laboratory Bottle-Top Dispenser Sales in Volume Growth Rate 2018-2029 (K Units)
Figure 60. China Laboratory Bottle-Top Dispenser Sales in Value Growth Rate 2018-2029 (US$ Million)
Figure 61. China Laboratory Bottle-Top Dispenser Sales by Type (2018-2029) & (K Units)
Figure 62. China Laboratory Bottle-Top Dispenser Sales Market Share in Volume by Type (2018-2029)
Figure 63. China Laboratory Bottle-Top Dispenser Sales by Application (2018-2029) & (K Units)
Figure 64. China Laboratory Bottle-Top Dispenser Sales Market Share in Volume by Application (2018-2029)
Figure 65. APAC Laboratory Bottle-Top Dispenser Sales in Volume Growth Rate 2018-2029 (K Units)
Figure 66. APAC Laboratory Bottle-Top Dispenser Sales in Value Growth Rate 2018-2029 (US$ Million)
Figure 67. APAC Laboratory Bottle-Top Dispenser Sales by Type (2018-2029) & (K Units)
Figure 68. APAC Laboratory Bottle-Top Dispenser Sales Market Share in Volume by Type (2018-2029)
Figure 69. APAC Laboratory Bottle-Top Dispenser Sales by Application (2018-2029) & (K Units)
Figure 70. APAC Laboratory Bottle-Top Dispenser Sales Market Share in Volume by Application (2018-2029)
Figure 71. Japan Laboratory Bottle-Top Dispenser Sales in Value Growth Rate (2018-2029) & (US$ Million)
Figure 72. South Korea Laboratory Bottle-Top Dispenser Sales in Value Growth Rate (2018-2029) & (US$ Million)
Figure 73. China Taiwan Laboratory Bottle-Top Dispenser Sales in Value Growth Rate (2018-2029) & (US$ Million)
Figure 74. Southeast Asia Laboratory Bottle-Top Dispenser Sales in Value Growth Rate (2018-2029) & (US$ Million)
Figure 75. India Laboratory Bottle-Top Dispenser Sales in Value Growth Rate (2018-2029) & (US$ Million)
Figure 76. Laboratory Bottle-Top Dispenser Value Chain
Figure 77. Laboratory Bottle-Top Dispenser Production Process
Figure 78. Channels of Distribution
Figure 79. Distributors Profiles
Figure 80. Bottom-up and Top-down Approaches for This Report
Figure 81. Data Triangulation
Figure 82. Key Executives Interviewed