1 Market Overview
1.1 Microdisplay Plane Product Introduction
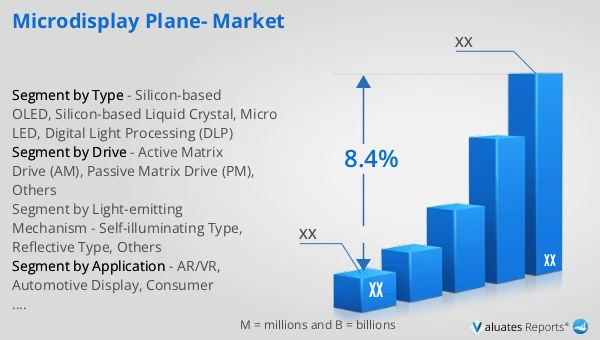
1.2 Global Microdisplay Plane Market Size Forecast
1.2.1 Global Microdisplay Plane Sales Value (2021–2032)
1.2.2 Global Microdisplay Plane Sales Volume (2021–2032)
1.2.3 Global Microdisplay Plane Sales Price (2021–2032)
1.3 Microdisplay Plane Market Trends & Drivers
1.3.1 Microdisplay Plane Industry Trends
1.3.2 Microdisplay Plane Market Drivers & Opportunities
1.3.3 Microdisplay Plane Market Challenges
1.3.4 Microdisplay Plane Market Restraints
1.3.5 Impact of U.S. Tariffs
1.4 Assumptions and Limitations
1.5 Study Objectives
1.6 Years Considered
2 Competitive Analysis by Company
2.1 Global Microdisplay Plane Players Revenue Ranking (2025)
2.2 Global Microdisplay Plane Revenue by Company (2021–2026)
2.3 Global Microdisplay Plane Sales Volume Ranking of Players (2025)
2.4 Global Microdisplay Plane Sales Volume by Company (2021–2026)
2.5 Global Microdisplay Plane Average Price by Company (2021–2026)
2.6 Key Manufacturers Microdisplay Plane Manufacturing Base and Headquarters
2.7 Key Manufacturers Microdisplay Plane Product Offerings
2.8 Key Manufacturers Start of Mass Production of Microdisplay Plane
2.9 Microdisplay Plane Market Competitive Analysis
2.9.1 Microdisplay Plane Market Concentration Rate (2021–2026)
2.9.2 Global 5 and 10 Largest Manufacturers by Microdisplay Plane Revenue in 2025
2.9.3 Global Companies by Tier (Tier 1, Tier 2, Tier 3), based on Microdisplay Plane revenue, 2025
2.10 Mergers & Acquisitions and Expansion
3 Segmentation Microdisplay Plane Market Classification
3.1 Introduction by Type
3.1.1 Silicon-based OLED
3.1.2 Silicon-based Liquid Crystal
3.1.3 Micro LED
3.1.4 Digital Light Processing (DLP)
3.1.5 Global Microdisplay Plane Sales Value by Type
3.1.5.1 Global Microdisplay Plane Sales Value by Type (2021 vs 2025 vs 2032)
3.1.5.2 Global Microdisplay Plane Sales Value, by Type (2021–2032)
3.1.5.3 Global Microdisplay Plane Sales Value, by Type (%), 2021–2032
3.1.6 Global Microdisplay Plane Sales Volume by Type
3.1.6.1 Global Microdisplay Plane Sales Volume by Type (2021 vs 2025 vs 2032)
3.1.6.2 Global Microdisplay Plane Sales Volume, by Type (2021–2032)
3.1.6.3 Global Microdisplay Plane Sales Volume, by Type (%), 2021–2032
3.1.7 Global Microdisplay Plane Average Price by Type (2021–2032)
3.2 Introduction by Drive
3.2.1 Active Matrix Drive (AM)
3.2.2 Passive Matrix Drive (PM)
3.2.3 Others
3.2.4 Global Microdisplay Plane Sales Value by Drive
3.2.4.1 Global Microdisplay Plane Sales Value by Drive (2021 vs 2025 vs 2032)
3.2.4.2 Global Microdisplay Plane Sales Value, by Drive (2021–2032)
3.2.4.3 Global Microdisplay Plane Sales Value, by Drive (%), 2021–2032
3.2.5 Global Microdisplay Plane Sales Volume by Drive
3.2.5.1 Global Microdisplay Plane Sales Volume by Drive (2021 vs 2025 vs 2032)
3.2.5.2 Global Microdisplay Plane Sales Volume, by Drive (2021–2032)
3.2.5.3 Global Microdisplay Plane Sales Volume, by Drive (%), 2021–2032
3.2.6 Global Microdisplay Plane Average Price by Drive (2021–2032)
3.3 Introduction by Light-emitting Mechanism
3.3.1 Self-illuminating Type
3.3.2 Reflective Type
3.3.3 Others
3.3.4 Global Microdisplay Plane Sales Value by Light-emitting Mechanism
3.3.4.1 Global Microdisplay Plane Sales Value by Light-emitting Mechanism (2021 vs 2025 vs 2032)
3.3.4.2 Global Microdisplay Plane Sales Value, by Light-emitting Mechanism (2021–2032)
3.3.4.3 Global Microdisplay Plane Sales Value, by Light-emitting Mechanism (%), 2021–2032
3.3.5 Global Microdisplay Plane Sales Volume by Light-emitting Mechanism
3.3.5.1 Global Microdisplay Plane Sales Volume by Light-emitting Mechanism (2021 vs 2025 vs 2032)
3.3.5.2 Global Microdisplay Plane Sales Volume, by Light-emitting Mechanism (2021–2032)
3.3.5.3 Global Microdisplay Plane Sales Volume, by Light-emitting Mechanism (%), 2021–2032
3.3.6 Global Microdisplay Plane Average Price by Light-emitting Mechanism (2021–2032)
4 Segmentation by Application
4.1 Introduction by Application
4.1.1 AR/VR
4.1.2 Automotive Display
4.1.3 Consumer Electronics
4.1.4 Others
4.2 Global Microdisplay Plane Sales Value by Application
4.2.1 Global Microdisplay Plane Sales Value by Application (2021 vs 2025 vs 2032)
4.2.2 Global Microdisplay Plane Sales Value, by Application (2021–2032)
4.2.3 Global Microdisplay Plane Sales Value, by Application (%), 2021–2032
4.3 Global Microdisplay Plane Sales Volume by Application
4.3.1 Global Microdisplay Plane Sales Volume by Application (2021 vs 2025 vs 2032)
4.3.2 Global Microdisplay Plane Sales Volume, by Application (2021–2032)
4.3.3 Global Microdisplay Plane Sales Volume, by Application (%), 2021–2032
4.4 Global Microdisplay Plane Average Price by Application (2021–2032)
5 Segmentation by Region
5.1 Global Microdisplay Plane Sales Value by Region
5.1.1 Global Microdisplay Plane Sales Value by Region: 2021 vs 2025 vs 2032
5.1.2 Global Microdisplay Plane Sales Value by Region (2021–2026)
5.1.3 Global Microdisplay Plane Sales Value by Region (2027–2032)
5.1.4 Global Microdisplay Plane Sales Value by Region (%), 2021–2032
5.2 Global Microdisplay Plane Sales Volume by Region
5.2.1 Global Microdisplay Plane Sales Volume by Region: 2021 vs 2025 vs 2032
5.2.2 Global Microdisplay Plane Sales Volume by Region (2021–2026)
5.2.3 Global Microdisplay Plane Sales Volume by Region (2027–2032)
5.2.4 Global Microdisplay Plane Sales Volume by Region (%), 2021–2032
5.3 Global Microdisplay Plane Average Price by Region (2021–2032)
5.4 North America
5.4.1 North America Microdisplay Plane Sales Value, 2021–2032
5.4.2 North America Microdisplay Plane Sales Value by Country (%), 2025 vs 2032
5.5 Europe
5.5.1 Europe Microdisplay Plane Sales Value, 2021–2032
5.5.2 Europe Microdisplay Plane Sales Value by Country (%), 2025 vs 2032
5.6 Asia Pacific
5.6.1 Asia Pacific Microdisplay Plane Sales Value, 2021–2032
5.6.2 Asia Pacific Microdisplay Plane Sales Value by Region (%), 2025 vs 2032
5.7 South America
5.7.1 South America Microdisplay Plane Sales Value, 2021–2032
5.7.2 South America Microdisplay Plane Sales Value by Country (%), 2025 vs 2032
5.8 Middle East & Africa
5.8.1 Middle East & Africa Microdisplay Plane Sales Value, 2021–2032
5.8.2 Middle East & Africa Microdisplay Plane Sales Value by Country (%), 2025 vs 2032
6 Segmentation by Key Countries/Regions
6.1 Key Countries/Regions Microdisplay Plane Sales Value Growth Trends, 2021 vs 2025 vs 2032
6.2 Key Countries/Regions Microdisplay Plane Sales Value and Sales Volume
6.2.1 Key Countries/Regions Microdisplay Plane Sales Value, 2021–2032
6.2.2 Key Countries/Regions Microdisplay Plane Sales Volume, 2021–2032
6.3 United States
6.3.1 United States Microdisplay Plane Sales Value, 2021–2032
6.3.2 United States Microdisplay Plane Sales Value by Type (%), 2025 vs 2032
6.3.3 United States Microdisplay Plane Sales Value by Application, 2025 vs 2032
6.4 Europe
6.4.1 Europe Microdisplay Plane Sales Value, 2021–2032
6.4.2 Europe Microdisplay Plane Sales Value by Type (%), 2025 vs 2032
6.4.3 Europe Microdisplay Plane Sales Value by Application, 2025 vs 2032
6.5 China
6.5.1 China Microdisplay Plane Sales Value, 2021–2032
6.5.2 China Microdisplay Plane Sales Value by Type (%), 2025 vs 2032
6.5.3 China Microdisplay Plane Sales Value by Application, 2025 vs 2032
6.6 Japan
6.6.1 Japan Microdisplay Plane Sales Value, 2021–2032
6.6.2 Japan Microdisplay Plane Sales Value by Type (%), 2025 vs 2032
6.6.3 Japan Microdisplay Plane Sales Value by Application, 2025 vs 2032
6.7 South Korea
6.7.1 South Korea Microdisplay Plane Sales Value, 2021–2032
6.7.2 South Korea Microdisplay Plane Sales Value by Type (%), 2025 vs 2032
6.7.3 South Korea Microdisplay Plane Sales Value by Application, 2025 vs 2032
6.8 Southeast Asia
6.8.1 Southeast Asia Microdisplay Plane Sales Value, 2021–2032
6.8.2 Southeast Asia Microdisplay Plane Sales Value by Type (%), 2025 vs 2032
6.8.3 Southeast Asia Microdisplay Plane Sales Value by Application, 2025 vs 2032
6.9 India
6.9.1 India Microdisplay Plane Sales Value, 2021–2032
6.9.2 India Microdisplay Plane Sales Value by Type (%), 2025 vs 2032
6.9.3 India Microdisplay Plane Sales Value by Application, 2025 vs 2032
7 Company Profiles
7.1 Sony
7.1.1 Sony Company Information
7.1.2 Sony Introduction and Business Overview
7.1.3 Sony Microdisplay Plane Sales, Revenue, Price and Gross Margin (2021–2026)
7.1.4 Sony Microdisplay Plane Product Offerings
7.1.5 Sony Recent Developments
7.2 Samsung Display
7.2.1 Samsung Display Company Information
7.2.2 Samsung Display Introduction and Business Overview
7.2.3 Samsung Display Microdisplay Plane Sales, Revenue, Price and Gross Margin (2021–2026)
7.2.4 Samsung Display Microdisplay Plane Product Offerings
7.2.5 Samsung Display Recent Developments
7.3 Epson
7.3.1 Epson Company Information
7.3.2 Epson Introduction and Business Overview
7.3.3 Epson Microdisplay Plane Sales, Revenue, Price and Gross Margin (2021–2026)
7.3.4 Epson Microdisplay Plane Product Offerings
7.3.5 Epson Recent Developments
7.4 MicroOLED
7.4.1 MicroOLED Company Information
7.4.2 MicroOLED Introduction and Business Overview
7.4.3 MicroOLED Microdisplay Plane Sales, Revenue, Price and Gross Margin (2021–2026)
7.4.4 MicroOLED Microdisplay Plane Product Offerings
7.4.5 MicroOLED Recent Developments
7.5 Himax Technologies
7.5.1 Himax Technologies Company Information
7.5.2 Himax Technologies Introduction and Business Overview
7.5.3 Himax Technologies Microdisplay Plane Sales, Revenue, Price and Gross Margin (2021–2026)
7.5.4 Himax Technologies Microdisplay Plane Product Offerings
7.5.5 Himax Technologies Recent Developments
7.6 eMagin
7.6.1 eMagin Company Information
7.6.2 eMagin Introduction and Business Overview
7.6.3 eMagin Microdisplay Plane Sales, Revenue, Price and Gross Margin (2021–2026)
7.6.4 eMagin Microdisplay Plane Product Offerings
7.6.5 eMagin Recent Developments
7.7 Kopin Corporation
7.7.1 Kopin Corporation Company Information
7.7.2 Kopin Corporation Introduction and Business Overview
7.7.3 Kopin Corporation Microdisplay Plane Sales, Revenue, Price and Gross Margin (2021–2026)
7.7.4 Kopin Corporation Microdisplay Plane Product Offerings
7.7.5 Kopin Corporation Recent Developments
7.8 MICLEDI Microdisplays
7.8.1 MICLEDI Microdisplays Company Information
7.8.2 MICLEDI Microdisplays Introduction and Business Overview
7.8.3 MICLEDI Microdisplays Microdisplay Plane Sales, Revenue, Price and Gross Margin (2021–2026)
7.8.4 MICLEDI Microdisplays Microdisplay Plane Product Offerings
7.8.5 MICLEDI Microdisplays Recent Developments
7.9 Raontech
7.9.1 Raontech Company Information
7.9.2 Raontech Introduction and Business Overview
7.9.3 Raontech Microdisplay Plane Sales, Revenue, Price and Gross Margin (2021–2026)
7.9.4 Raontech Microdisplay Plane Product Offerings
7.9.5 Raontech Recent Developments
7.10 JBD (Jade Bird Display)
7.10.1 JBD (Jade Bird Display) Company Information
7.10.2 JBD (Jade Bird Display) Introduction and Business Overview
7.10.3 JBD (Jade Bird Display) Microdisplay Plane Sales, Revenue, Price and Gross Margin (2021–2026)
7.10.4 JBD (Jade Bird Display) Microdisplay Plane Product Offerings
7.10.5 JBD (Jade Bird Display) Recent Developments
7.11 SeeYA Technology
7.11.1 SeeYA Technology Company Information
7.11.2 SeeYA Technology Introduction and Business Overview
7.11.3 SeeYA Technology Microdisplay Plane Sales, Revenue, Price and Gross Margin (2021–2026)
7.11.4 SeeYA Technology Microdisplay Plane Product Offerings
7.11.5 SeeYA Technology Recent Developments
7.12 BOE Technology Group
7.12.1 BOE Technology Group Company Information
7.12.2 BOE Technology Group Introduction and Business Overview
7.12.3 BOE Technology Group Microdisplay Plane Sales, Revenue, Price and Gross Margin (2021–2026)
7.12.4 BOE Technology Group Microdisplay Plane Product Offerings
7.12.5 BOE Technology Group Recent Developments
7.13 Fraunhofer IPMS
7.13.1 Fraunhofer IPMS Company Information
7.13.2 Fraunhofer IPMS Introduction and Business Overview
7.13.3 Fraunhofer IPMS Microdisplay Plane Sales, Revenue, Price and Gross Margin (2021–2026)
7.13.4 Fraunhofer IPMS Microdisplay Plane Product Offerings
7.13.5 Fraunhofer IPMS Recent Developments
7.14 Yunnan OLiGHTEK
7.14.1 Yunnan OLiGHTEK Company Information
7.14.2 Yunnan OLiGHTEK Introduction and Business Overview
7.14.3 Yunnan OLiGHTEK Microdisplay Plane Sales, Revenue, Price and Gross Margin (2021–2026)
7.14.4 Yunnan OLiGHTEK Microdisplay Plane Product Offerings
7.14.5 Yunnan OLiGHTEK Recent Developments
7.15 Texas Instruments
7.15.1 Texas Instruments Company Information
7.15.2 Texas Instruments Introduction and Business Overview
7.15.3 Texas Instruments Microdisplay Plane Sales, Revenue, Price and Gross Margin (2021–2026)
7.15.4 Texas Instruments Microdisplay Plane Product Offerings
7.15.5 Texas Instruments Recent Developments
8 Industry Chain Analysis
8.1 Microdisplay Plane Industrial Chain
8.2 Microdisplay Plane Upstream Analysis
8.2.1 Key Raw Materials
8.2.2 Key Suppliers of Raw Materials
8.2.3 Manufacturing Cost Structure
8.3 Midstream Analysis
8.4 Downstream Analysis (Customer Analysis)
8.5 Sales Model and Sales Channelss
8.5.1 Microdisplay Plane Sales Model
8.5.2 Sales Channels
8.5.3 Microdisplay Plane Distributors
9 Research Findings and Conclusion
10 Appendix
10.1 Research Methodology
10.1.1 Methodology/Research Approach
10.1.1.1 Research Programs/Design
10.1.1.2 Market Size Estimation
10.1.1.3 Market Breakdown and Data Triangulation
10.1.2 Data Source
10.1.2.1 Secondary Sources
10.1.2.2 Primary Sources
10.2 Author Details
10.3 Disclaimer