0
U.S. (TOLL FREE)
+1 (315) 215-3225
Automative

0
U.S. (TOLL FREE)
+1 (315) 215-3225
Global Bus Services Market Insights, Forecast to 2030
Published Date: December 2024
|
Report Code: QYRE-Auto-37O5862
Home | Market Reports | Travel| Bus & Rail
Global Bus Services Market Insights and Forecast to 2028
BUY CHAPTERS

Global Bus Services Market Insights, Forecast to 2030

Code: QYRE-Auto-37O5862
Report
December 2024
Pages:129
QYResearch
Buy Now with 15% Discount
DESCRIPTION
TABLE OF CONTENT
TABLES & FIGURES

Bus Services Market Size

The global Bus Services market is projected to grow from US$ 20840 million in 2024 to US$ 24170 million by 2030, at a Compound Annual Growth Rate (CAGR) of 2.5% during the forecast period.

Bus Services Market

Bus Services Market

Bus Services are generally based on regular operation of transit buses along a route calling at agreed bus stops according to a published public transport timetable.
Market Analysis and Insights: Global Bus Services Market
After experiencing the COVID-19 epidemic, the bus service market has gradually recovered. The market in 2022 will be approximately US$154 billion, and the market in 2023 will be approximately US$20.8 billion. Among them, China accounts for the largest share, with revenue of approximately US$4.8 billion. From the perspective of ticket sales channels, online sales revenue has grown the fastest, gradually surpassing offline sales.
Report Covers:
This report presents an overview of global market for Bus Services market size. Analyses of the global market trends, with historic market revenue data for 2019 - 2023, estimates for 2024, and projections of CAGR through 2030.
This report researches the key producers of Bus Services, also provides the revenue of main regions and countries. Highlights of the upcoming market potential for Bus Services, and key regions/countries of focus to forecast this market into various segments and sub-segments. Country specific data and market value analysis for the U.S., Canada, Mexico, Brazil, China, Japan, South Korea, Southeast Asia, India, Germany, the U.K., Italy, Middle East, Africa, and Other Countries.
This report focuses on the Bus Services revenue, market share and industry ranking of main companies, data from 2019 to 2024. Identification of the major stakeholders in the global Bus Services market, and analysis of their competitive landscape and market positioning based on recent developments and segmental revenues. This report will help stakeholders to understand the competitive landscape and gain more insights and position their businesses and market strategies in a better way.
This report analyzes the segments data by Type and by Application, revenue, and growth rate, from 2019 to 2030. Evaluation and forecast the market size for Bus Services revenue, projected growth trends, production technology, application and end-user industry.
Market Segmentation

Scope of Bus Services Market Report

Report Metric Details
Report Name Bus Services Market
Accounted market size in 2024 US$ 20840 million
Forecasted market size in 2030 US$ 24170 million
CAGR 2.5
Base Year 2024
Forecasted years 2025 - 2030
Segment by Type
Segment by Application
By Region
  • North America (United States, Canada)
  • Europe (Germany, France, UK, Italy, Russia) Rest of Europe
  • Nordic Countries
  • Asia-Pacific (China, Japan, South Korea)
  • Southeast Asia (India, Australia)
  • Rest of Asia
  • Latin America (Mexico, Brazil)
  • Rest of Latin America
  • Middle East & Africa (Turkey, Saudi Arabia, UAE, Rest of MEA)
By Company FlixBus, Transdev, DB Regio Bus, Big Bus Tours, RATP Dev Transit, City Sightseeing, Eurolines, Golden Arrow Bus Services, Greyhound, Adirondack Trailways, Jefferson Lines, RedCoach, Barons bus, Coast Mountain Bus Company, ALSA, Viacao Cometa, Abhibus, Tornado Bus Company, Shunxiang Bus, Shenzhen Bus Group
Forecast units USD million in value
Report coverage Revenue and volume forecast, company share, competitive landscape, growth factors and trends

Chapter Outline

  • Chapter 1: Introduces the report scope of the report, executive summary of different market segments (product type, application, etc), including the market size of each market segment, future development potential, and so on. It offers a high-level view of the current state of the market and its likely evolution in the short to mid-term, and long term.
  • Chapter 2: Revenue of Bus Services in global and regional level. It provides a quantitative analysis of the market size and development potential of each region and its main countries and introduces the market development, future development prospects, market space, and capacity of each country in the world. This section also introduces the market dynamics, latest developments of the market, the driving factors and restrictive factors of the market, the challenges and risks faced by companies in the industry, and the analysis of relevant policies in the industry.
  • Chapter 3: Detailed analysis of Bus Services companies’ competitive landscape, revenue, market share and industry ranking, latest development plan, merger, and acquisition information, etc.
  • Chapter 4: Provides the analysis of various market segments by Type, covering the revenue, and development potential of each market segment, to help readers find the blue ocean market in different market segments.
  • Chapter 5: Provides the analysis of various market segments by Application, covering the revenue, and development potential of each market segment, to help readers find the blue ocean market in different downstream markets.
  • Chapter 6: North America (US & Canada) by Type, by Application and by country, revenue for each segment.
  • Chapter 7: Europe by Type, by Application and by country, revenue for each segment.
  • Chapter 8: China by Type, and by Application, revenue for each segment.
  • Chapter 9: Asia (excluding China) by Type, by Application and by region, revenue for each segment.
  • Chapter 10: Middle East, Africa, and Latin America by Type, by Application and by country, revenue for each segment.
  • Chapter 11: Provides profiles of key companies, introducing the basic situation of the main companies in the market in detail, including product descriptions and specifications, Bus Services revenue, gross margin, and recent development, etc.
  • Chapter 12: Analyst's Viewpoints/Conclusions

FAQ for this report

How fast is Bus Services Market growing?

Ans: The Bus Services Market witnessing a CAGR of 2.5 during the forecast period 2025-2030.

What is the Bus Services Market size in 2030?

Ans: The Bus Services Market size in 2030 will be US$ 24170 million.

Who are the main players in the Bus Services Market report?

Ans: The main players in the Bus Services Market are FlixBus, Transdev, DB Regio Bus, Big Bus Tours, RATP Dev Transit, City Sightseeing, Eurolines, Golden Arrow Bus Services, Greyhound, Adirondack Trailways, Jefferson Lines, RedCoach, Barons bus, Coast Mountain Bus Company, ALSA, Viacao Cometa, Abhibus, Tornado Bus Company, Shunxiang Bus, Shenzhen Bus Group

What are the Application segmentation covered in the Bus Services Market report?

Ans: The Applications covered in the Bus Services Market report are Urban Transport, Long Distance Transport, Specialist Services

What are the Type segmentation covered in the Bus Services Market report?

Ans: The Types covered in the Bus Services Market report are Light and Medium Type, Large Type

Recommended Reports

Bus Market & Equipment

Bus Services & Operations

Transport & Mobility Services

1 Report Overview
1.1 Study Scope
1.2 Market Analysis by Type
1.2.1 Global Bus Services Market Size Growth Rate by Type, 2019 VS 2023 VS 2030
1.2.2 Light and Medium Type
1.2.3 Large Type
1.3 Market by Application
1.3.1 Global Bus Services Market Size Growth Rate by Application, 2019 VS 2023 VS 2030
1.3.2 Urban Transport
1.3.3 Long Distance Transport
1.3.4 Specialist Services
1.4 Assumptions and Limitations
1.5 Study Objectives
1.6 Years Considered
2 Global Growth Trends
2.1 Global Bus Services Market Perspective (2019-2030)
2.2 Global Bus Services Growth Trends by Region
2.2.1 Bus Services Market Size by Region: 2019 VS 2023 VS 2030
2.2.2 Bus Services Historic Market Size by Region (2019-2024)
2.2.3 Bus Services Forecasted Market Size by Region (2025-2030)
2.3 Bus Services Market Dynamics
2.3.1 Bus Services Industry Trends
2.3.2 Bus Services Market Drivers
2.3.3 Bus Services Market Challenges
2.3.4 Bus Services Market Restraints
3 Competition Landscape by Key Players
3.1 Global Revenue Bus Services by Players
3.1.1 Global Bus Services Revenue by Players (2019-2024)
3.1.2 Global Bus Services Revenue Market Share by Players (2019-2024)
3.2 Global Bus Services Market Share by Company Type (Tier 1, Tier 2, and Tier 3)
3.3 Global Key Players of Bus Services, Ranking by Revenue, 2022 VS 2023 VS 2024
3.4 Global Bus Services Market Concentration Ratio
3.4.1 Global Bus Services Market Concentration Ratio (CR5 and HHI)
3.4.2 Global Top 10 and Top 5 Companies by Bus Services Revenue in 2023
3.5 Global Key Players of Bus Services Head office and Area Served
3.6 Global Key Players of Bus Services, Product and Application
3.7 Global Key Players of Bus Services, Date of Enter into This Industry
3.8 Mergers & Acquisitions, Expansion Plans
4 Bus Services Breakdown Data by Type
4.1 Global Bus Services Historic Market Size by Type (2019-2024)
4.2 Global Bus Services Forecasted Market Size by Type (2025-2030)
5 Bus Services Breakdown Data by Application
5.1 Global Bus Services Historic Market Size by Application (2019-2024)
5.2 Global Bus Services Forecasted Market Size by Application (2025-2030)
6 North America
6.1 North America Bus Services Market Size (2019-2030)
6.2 North America Bus Services Market Size by Type
6.2.1 North America Bus Services Market Size by Type (2019-2024)
6.2.2 North America Bus Services Market Size by Type (2025-2030)
6.2.3 North America Bus Services Market Share by Type (2019-2030)
6.3 North America Bus Services Market Size by Application
6.3.1 North America Bus Services Market Size by Application (2019-2024)
6.3.2 North America Bus Services Market Size by Application (2025-2030)
6.3.3 North America Bus Services Market Share by Application (2019-2030)
6.4 North America Bus Services Market Size by Country
6.4.1 North America Bus Services Market Size by Country: 2019 VS 2023 VS 2030
6.4.2 North America Bus Services Market Size by Country (2019-2024)
6.4.3 North America Bus Services Market Size by Country (2025-2030)
6.4.4 U.S.
6.4.5 Canada
7 Europe
7.1 Europe Bus Services Market Size (2019-2030)
7.2 Europe Bus Services Market Size by Type
7.2.1 Europe Bus Services Market Size by Type (2019-2024)
7.2.2 Europe Bus Services Market Size by Type (2025-2030)
7.2.3 Europe Bus Services Market Share by Type (2019-2030)
7.3 Europe Bus Services Market Size by Application
7.3.1 Europe Bus Services Market Size by Application (2019-2024)
7.3.2 Europe Bus Services Market Size by Application (2025-2030)
7.3.3 Europe Bus Services Market Share by Application (2019-2030)
7.4 Europe Bus Services Market Size by Country
7.4.1 Europe Bus Services Market Size by Country: 2019 VS 2023 VS 2030
7.4.2 Europe Bus Services Market Size by Country (2019-2024)
7.4.3 Europe Bus Services Market Size by Country (2025-2030)
7.4.3 Germany
7.4.4 France
7.4.5 U.K.
7.4.6 Italy
7.4.7 Russia
7.4.8 Nordic Countries
8 China
8.1 China Bus Services Market Size (2019-2030)
8.2 China Bus Services Market Size by Type
8.2.1 China Bus Services Market Size by Type (2019-2024)
8.2.2 China Bus Services Market Size by Type (2025-2030)
8.2.3 China Bus Services Market Share by Type (2019-2030)
8.3 China Bus Services Market Size by Application
8.3.1 China Bus Services Market Size by Application (2019-2024)
8.3.2 China Bus Services Market Size by Application (2025-2030)
8.3.3 China Bus Services Market Share by Application (2019-2030)
9 Asia (excluding China)
9.1 Asia Bus Services Market Size (2019-2030)
9.2 Asia Bus Services Market Size by Type
9.2.1 Asia Bus Services Market Size by Type (2019-2024)
9.2.2 Asia Bus Services Market Size by Type (2025-2030)
9.2.3 Asia Bus Services Market Share by Type (2019-2030)
9.3 Asia Bus Services Market Size by Application
9.3.1 Asia Bus Services Market Size by Application (2019-2024)
9.3.2 Asia Bus Services Market Size by Application (2025-2030)
9.3.3 Asia Bus Services Market Share by Application (2019-2030)
9.4 Asia Bus Services Market Size by Region
9.4.1 Asia Bus Services Market Size by Region: 2019 VS 2023 VS 2030
9.4.2 Asia Bus Services Market Size by Region (2019-2024)
9.4.3 Asia Bus Services Market Size by Region (2025-2030)
9.4.4 Japan
9.4.5 South Korea
9.4.6 China Taiwan
9.4.7 Southeast Asia
9.4.8 India
9.4.9 Australia
10 Middle East, Africa, and Latin America
10.1 Middle East, Africa, and Latin America Bus Services Market Size (2019-2030)
10.2 Middle East, Africa, and Latin America Bus Services Market Size by Type
10.2.1 Middle East, Africa, and Latin America Bus Services Market Size by Type (2019-2024)
10.2.2 Middle East, Africa, and Latin America Bus Services Market Size by Type (2025-2030)
10.2.3 Middle East, Africa, and Latin America Bus Services Market Share by Type (2019-2030)
10.3 Middle East, Africa, and Latin America Bus Services Market Size by Application
10.3.1 Middle East, Africa, and Latin America Bus Services Market Size by Application (2019-2024)
10.3.2 Middle East, Africa, and Latin America Bus Services Market Size by Application (2025-2030)
10.3.3 Middle East, Africa, and Latin America Bus Services Market Share by Application (2019-2030)
10.4 Middle East, Africa, and Latin America Bus Services Market Size by Country
10.4.1 Middle East, Africa, and Latin America Bus Services Market Size by Country: 2019 VS 2023 VS 2030
10.4.2 Middle East, Africa, and Latin America Bus Services Market Size by Country (2019-2024)
10.4.3 Middle East, Africa, and Latin America Bus Services Market Size by Country (2025-2030)
10.4.4 Brazil
10.4.5 Mexico
10.4.6 Turkey
10.4.7 Saudi Arabia
10.4.8 Israel
10.4.9 GCC Countries
11 Key Players Profiles
11.1 FlixBus
11.1.1 FlixBus Company Details
11.1.2 FlixBus Business Overview
11.1.3 FlixBus Bus Services Introduction
11.1.4 FlixBus Revenue in Bus Services Business (2019-2024)
11.1.5 FlixBus Recent Developments
11.2 Transdev
11.2.1 Transdev Company Details
11.2.2 Transdev Business Overview
11.2.3 Transdev Bus Services Introduction
11.2.4 Transdev Revenue in Bus Services Business (2019-2024)
11.2.5 Transdev Recent Developments
11.3 DB Regio Bus
11.3.1 DB Regio Bus Company Details
11.3.2 DB Regio Bus Business Overview
11.3.3 DB Regio Bus Bus Services Introduction
11.3.4 DB Regio Bus Revenue in Bus Services Business (2019-2024)
11.3.5 DB Regio Bus Recent Developments
11.4 Big Bus Tours
11.4.1 Big Bus Tours Company Details
11.4.2 Big Bus Tours Business Overview
11.4.3 Big Bus Tours Bus Services Introduction
11.4.4 Big Bus Tours Revenue in Bus Services Business (2019-2024)
11.4.5 Big Bus Tours Recent Developments
11.5 RATP Dev Transit
11.5.1 RATP Dev Transit Company Details
11.5.2 RATP Dev Transit Business Overview
11.5.3 RATP Dev Transit Bus Services Introduction
11.5.4 RATP Dev Transit Revenue in Bus Services Business (2019-2024)
11.5.5 RATP Dev Transit Recent Developments
11.6 City Sightseeing
11.6.1 City Sightseeing Company Details
11.6.2 City Sightseeing Business Overview
11.6.3 City Sightseeing Bus Services Introduction
11.6.4 City Sightseeing Revenue in Bus Services Business (2019-2024)
11.6.5 City Sightseeing Recent Developments
11.7 Eurolines
11.7.1 Eurolines Company Details
11.7.2 Eurolines Business Overview
11.7.3 Eurolines Bus Services Introduction
11.7.4 Eurolines Revenue in Bus Services Business (2019-2024)
11.7.5 Eurolines Recent Developments
11.8 Golden Arrow Bus Services
11.8.1 Golden Arrow Bus Services Company Details
11.8.2 Golden Arrow Bus Services Business Overview
11.8.3 Golden Arrow Bus Services Bus Services Introduction
11.8.4 Golden Arrow Bus Services Revenue in Bus Services Business (2019-2024)
11.8.5 Golden Arrow Bus Services Recent Developments
11.9 Greyhound
11.9.1 Greyhound Company Details
11.9.2 Greyhound Business Overview
11.9.3 Greyhound Bus Services Introduction
11.9.4 Greyhound Revenue in Bus Services Business (2019-2024)
11.9.5 Greyhound Recent Developments
11.10 Adirondack Trailways
11.10.1 Adirondack Trailways Company Details
11.10.2 Adirondack Trailways Business Overview
11.10.3 Adirondack Trailways Bus Services Introduction
11.10.4 Adirondack Trailways Revenue in Bus Services Business (2019-2024)
11.10.5 Adirondack Trailways Recent Developments
11.11 Jefferson Lines
11.11.1 Jefferson Lines Company Details
11.11.2 Jefferson Lines Business Overview
11.11.3 Jefferson Lines Bus Services Introduction
11.11.4 Jefferson Lines Revenue in Bus Services Business (2019-2024)
11.11.5 Jefferson Lines Recent Developments
11.12 RedCoach
11.12.1 RedCoach Company Details
11.12.2 RedCoach Business Overview
11.12.3 RedCoach Bus Services Introduction
11.12.4 RedCoach Revenue in Bus Services Business (2019-2024)
11.12.5 RedCoach Recent Developments
11.13 Barons bus
11.13.1 Barons bus Company Details
11.13.2 Barons bus Business Overview
11.13.3 Barons bus Bus Services Introduction
11.13.4 Barons bus Revenue in Bus Services Business (2019-2024)
11.13.5 Barons bus Recent Developments
11.14 Coast Mountain Bus Company
11.14.1 Coast Mountain Bus Company Company Details
11.14.2 Coast Mountain Bus Company Business Overview
11.14.3 Coast Mountain Bus Company Bus Services Introduction
11.14.4 Coast Mountain Bus Company Revenue in Bus Services Business (2019-2024)
11.14.5 Coast Mountain Bus Company Recent Developments
11.15 ALSA
11.15.1 ALSA Company Details
11.15.2 ALSA Business Overview
11.15.3 ALSA Bus Services Introduction
11.15.4 ALSA Revenue in Bus Services Business (2019-2024)
11.15.5 ALSA Recent Developments
11.16 Viacao Cometa
11.16.1 Viacao Cometa Company Details
11.16.2 Viacao Cometa Business Overview
11.16.3 Viacao Cometa Bus Services Introduction
11.16.4 Viacao Cometa Revenue in Bus Services Business (2019-2024)
11.16.5 Viacao Cometa Recent Developments
11.17 Abhibus
11.17.1 Abhibus Company Details
11.17.2 Abhibus Business Overview
11.17.3 Abhibus Bus Services Introduction
11.17.4 Abhibus Revenue in Bus Services Business (2019-2024)
11.17.5 Abhibus Recent Developments
11.18 Tornado Bus Company
11.18.1 Tornado Bus Company Company Details
11.18.2 Tornado Bus Company Business Overview
11.18.3 Tornado Bus Company Bus Services Introduction
11.18.4 Tornado Bus Company Revenue in Bus Services Business (2019-2024)
11.18.5 Tornado Bus Company Recent Developments
11.19 Shunxiang Bus
11.19.1 Shunxiang Bus Company Details
11.19.2 Shunxiang Bus Business Overview
11.19.3 Shunxiang Bus Bus Services Introduction
11.19.4 Shunxiang Bus Revenue in Bus Services Business (2019-2024)
11.19.5 Shunxiang Bus Recent Developments
11.20 Shenzhen Bus Group
11.20.1 Shenzhen Bus Group Company Details
11.20.2 Shenzhen Bus Group Business Overview
11.20.3 Shenzhen Bus Group Bus Services Introduction
11.20.4 Shenzhen Bus Group Revenue in Bus Services Business (2019-2024)
11.20.5 Shenzhen Bus Group Recent Developments
12 Analyst's Viewpoints/Conclusions
13 Appendix
13.1 Research Methodology
13.1.1 Methodology/Research Approach
13.1.2 Data Source
13.2 Disclaimer
13.3 Author Details
List of Tables
    Table 1. Global Bus Services Market Size Growth Rate by Type (US$ Million), 2019 VS 2023 VS 2030
    Table 2. Key Players of Light and Medium Type
    Table 3. Key Players of Large Type
    Table 4. Global Bus Services Market Size Growth Rate by Application (US$ Million), 2019 VS 2023 VS 2030
    Table 5. Global Bus Services Market Size Growth Rate (CAGR) by Region (US$ Million): 2019 VS 2023 VS 2030
    Table 6. Global Bus Services Market Size by Region (2019-2024) & (US$ Million)
    Table 7. Global Bus Services Market Share by Region (2019-2024)
    Table 8. Global Bus Services Forecasted Market Size by Region (2025-2030) & (US$ Million)
    Table 9. Global Bus Services Market Share by Region (2025-2030)
    Table 10. Bus Services Market Trends
    Table 11. Bus Services Market Drivers
    Table 12. Bus Services Market Challenges
    Table 13. Bus Services Market Restraints
    Table 14. Global Bus Services Revenue by Players (2019-2024) & (US$ Million)
    Table 15. Global Bus Services Revenue Share by Players (2019-2024)
    Table 16. Global Top Bus Services by Company Type (Tier 1, Tier 2, and Tier 3) & (based on the Revenue in Bus Services as of 2023)
    Table 17. Global Bus Services Industry Ranking 2022 VS 2023 VS 2024
    Table 18. Global 5 Largest Players Market Share by Bus Services Revenue (CR5 and HHI) & (2019-2024)
    Table 19. Global Key Players of Bus Services, Headquarters and Area Served
    Table 20. Global Key Players of Bus Services, Product and Application
    Table 21. Global Key Players of Bus Services, Product and Application
    Table 22. Mergers & Acquisitions, Expansion Plans
    Table 23. Global Bus Services Market Size by Type (2019-2024) & (US$ Million)
    Table 24. Global Bus Services Revenue Market Share by Type (2019-2024)
    Table 25. Global Bus Services Forecasted Market Size by Type (2025-2030) & (US$ Million)
    Table 26. Global Bus Services Revenue Market Share by Type (2025-2030)
    Table 27. Global Bus Services Market Size by Application (2019-2024) & (US$ Million)
    Table 28. Global Bus Services Revenue Share by Application (2019-2024)
    Table 29. Global Bus Services Forecasted Market Size by Application (2025-2030) & (US$ Million)
    Table 30. Global Bus Services Revenue Share by Application (2025-2030)
    Table 31. North America Bus Services Market Size by Type (2019-2024) & (US$ Million)
    Table 32. North America Bus Services Market Size by Type (2025-2030) & (US$ Million)
    Table 33. North America Bus Services Market Size by Application (2019-2024) & (US$ Million)
    Table 34. North America Bus Services Market Size by Application (2025-2030) & (US$ Million)
    Table 35. North America Bus Services Growth Rate (CAGR) by Country (US$ Million): 2019 VS 2023 VS 2030
    Table 36. North America Bus Services Market Size by Country (2019-2024) & (US$ Million)
    Table 37. North America Bus Services Market Size by Country (2025-2030) & (US$ Million)
    Table 38. Europe Bus Services Market Size by Type (2019-2024) & (US$ Million)
    Table 39. Europe Bus Services Market Size by Type (2025-2030) & (US$ Million)
    Table 40. Europe Bus Services Market Size by Application (2019-2024) & (US$ Million)
    Table 41. Europe Bus Services Market Size by Application (2025-2030) & (US$ Million)
    Table 42. Europe Bus Services Growth Rate (CAGR) by Country (US$ Million): 2019 VS 2023 VS 2030
    Table 43. Europe Bus Services Market Size by Country (2019-2024) & (US$ Million)
    Table 44. Europe Bus Services Market Size by Country (2025-2030) & (US$ Million)
    Table 45. China Bus Services Market Size by Type (2019-2024) & (US$ Million)
    Table 46. China Bus Services Market Size by Type (2025-2030) & (US$ Million)
    Table 47. China Bus Services Market Size by Application (2019-2024) & (US$ Million)
    Table 48. China Bus Services Market Size by Application (2025-2030) & (US$ Million)
    Table 49. Asia Bus Services Market Size by Type (2019-2024) & (US$ Million)
    Table 50. Asia Bus Services Market Size by Type (2025-2030) & (US$ Million)
    Table 51. Asia Bus Services Market Size by Application (2019-2024) & (US$ Million)
    Table 52. Asia Bus Services Market Size by Application (2025-2030) & (US$ Million)
    Table 53. Asia Bus Services Growth Rate (CAGR) by Region (US$ Million): 2019 VS 2023 VS 2030
    Table 54. Asia Bus Services Market Size by Region (2019-2024) & (US$ Million)
    Table 55. Asia Bus Services Market Size by Region (2025-2030) & (US$ Million)
    Table 56. Middle East, Africa, and Latin America Bus Services Market Size by Type (2019-2024) & (US$ Million)
    Table 57. Middle East, Africa, and Latin America Bus Services Market Size by Type (2025-2030) & (US$ Million)
    Table 58. Middle East, Africa, and Latin America Bus Services Market Size by Application (2019-2024) & (US$ Million)
    Table 59. Middle East, Africa, and Latin America Bus Services Market Size by Application (2025-2030) & (US$ Million)
    Table 60. Middle East, Africa, and Latin America Bus Services Growth Rate (CAGR) by Country (US$ Million): 2019 VS 2023 VS 2030
    Table 61. Middle East, Africa, and Latin America Bus Services Market Size by Country (2019-2024) & (US$ Million)
    Table 62. Middle East, Africa, and Latin America Bus Services Market Size by Country (2025-2030) & (US$ Million)
    Table 63. FlixBus Company Details
    Table 64. FlixBus Business Overview
    Table 65. FlixBus Bus Services Product
    Table 66. FlixBus Revenue in Bus Services Business (2019-2024) & (US$ Million)
    Table 67. FlixBus Recent Developments
    Table 68. Transdev Company Details
    Table 69. Transdev Business Overview
    Table 70. Transdev Bus Services Product
    Table 71. Transdev Revenue in Bus Services Business (2019-2024) & (US$ Million)
    Table 72. Transdev Recent Developments
    Table 73. DB Regio Bus Company Details
    Table 74. DB Regio Bus Business Overview
    Table 75. DB Regio Bus Bus Services Product
    Table 76. DB Regio Bus Revenue in Bus Services Business (2019-2024) & (US$ Million)
    Table 77. DB Regio Bus Recent Developments
    Table 78. Big Bus Tours Company Details
    Table 79. Big Bus Tours Business Overview
    Table 80. Big Bus Tours Bus Services Product
    Table 81. Big Bus Tours Revenue in Bus Services Business (2019-2024) & (US$ Million)
    Table 82. Big Bus Tours Recent Developments
    Table 83. RATP Dev Transit Company Details
    Table 84. RATP Dev Transit Business Overview
    Table 85. RATP Dev Transit Bus Services Product
    Table 86. RATP Dev Transit Revenue in Bus Services Business (2019-2024) & (US$ Million)
    Table 87. RATP Dev Transit Recent Developments
    Table 88. City Sightseeing Company Details
    Table 89. City Sightseeing Business Overview
    Table 90. City Sightseeing Bus Services Product
    Table 91. City Sightseeing Revenue in Bus Services Business (2019-2024) & (US$ Million)
    Table 92. City Sightseeing Recent Developments
    Table 93. Eurolines Company Details
    Table 94. Eurolines Business Overview
    Table 95. Eurolines Bus Services Product
    Table 96. Eurolines Revenue in Bus Services Business (2019-2024) & (US$ Million)
    Table 97. Eurolines Recent Developments
    Table 98. Golden Arrow Bus Services Company Details
    Table 99. Golden Arrow Bus Services Business Overview
    Table 100. Golden Arrow Bus Services Bus Services Product
    Table 101. Golden Arrow Bus Services Revenue in Bus Services Business (2019-2024) & (US$ Million)
    Table 102. Golden Arrow Bus Services Recent Developments
    Table 103. Greyhound Company Details
    Table 104. Greyhound Business Overview
    Table 105. Greyhound Bus Services Product
    Table 106. Greyhound Revenue in Bus Services Business (2019-2024) & (US$ Million)
    Table 107. Greyhound Recent Developments
    Table 108. Adirondack Trailways Company Details
    Table 109. Adirondack Trailways Business Overview
    Table 110. Adirondack Trailways Bus Services Product
    Table 111. Adirondack Trailways Revenue in Bus Services Business (2019-2024) & (US$ Million)
    Table 112. Adirondack Trailways Recent Developments
    Table 113. Jefferson Lines Company Details
    Table 114. Jefferson Lines Business Overview
    Table 115. Jefferson Lines Bus Services Product
    Table 116. Jefferson Lines Revenue in Bus Services Business (2019-2024) & (US$ Million)
    Table 117. Jefferson Lines Recent Developments
    Table 118. RedCoach Company Details
    Table 119. RedCoach Business Overview
    Table 120. RedCoach Bus Services Product
    Table 121. RedCoach Revenue in Bus Services Business (2019-2024) & (US$ Million)
    Table 122. RedCoach Recent Developments
    Table 123. Barons bus Company Details
    Table 124. Barons bus Business Overview
    Table 125. Barons bus Bus Services Product
    Table 126. Barons bus Revenue in Bus Services Business (2019-2024) & (US$ Million)
    Table 127. Barons bus Recent Developments
    Table 128. Coast Mountain Bus Company Company Details
    Table 129. Coast Mountain Bus Company Business Overview
    Table 130. Coast Mountain Bus Company Bus Services Product
    Table 131. Coast Mountain Bus Company Revenue in Bus Services Business (2019-2024) & (US$ Million)
    Table 132. Coast Mountain Bus Company Recent Developments
    Table 133. ALSA Company Details
    Table 134. ALSA Business Overview
    Table 135. ALSA Bus Services Product
    Table 136. ALSA Revenue in Bus Services Business (2019-2024) & (US$ Million)
    Table 137. ALSA Recent Developments
    Table 138. Viacao Cometa Company Details
    Table 139. Viacao Cometa Business Overview
    Table 140. Viacao Cometa Bus Services Product
    Table 141. Viacao Cometa Revenue in Bus Services Business (2019-2024) & (US$ Million)
    Table 142. Viacao Cometa Recent Developments
    Table 143. Abhibus Company Details
    Table 144. Abhibus Business Overview
    Table 145. Abhibus Bus Services Product
    Table 146. Abhibus Revenue in Bus Services Business (2019-2024) & (US$ Million)
    Table 147. Abhibus Recent Developments
    Table 148. Tornado Bus Company Company Details
    Table 149. Tornado Bus Company Business Overview
    Table 150. Tornado Bus Company Bus Services Product
    Table 151. Tornado Bus Company Revenue in Bus Services Business (2019-2024) & (US$ Million)
    Table 152. Tornado Bus Company Recent Developments
    Table 153. Shunxiang Bus Company Details
    Table 154. Shunxiang Bus Business Overview
    Table 155. Shunxiang Bus Bus Services Product
    Table 156. Shunxiang Bus Revenue in Bus Services Business (2019-2024) & (US$ Million)
    Table 157. Shunxiang Bus Recent Developments
    Table 158. Shenzhen Bus Group Company Details
    Table 159. Shenzhen Bus Group Business Overview
    Table 160. Shenzhen Bus Group Bus Services Product
    Table 161. Shenzhen Bus Group Revenue in Bus Services Business (2019-2024) & (US$ Million)
    Table 162. Shenzhen Bus Group Recent Developments
    Table 163. Research Programs/Design for This Report
    Table 164. Key Data Information from Secondary Sources
    Table 165. Key Data Information from Primary Sources
List of Figures
    Figure 1. Global Bus Services Market Size Growth Rate by Type, 2019 VS 2023 VS 2030 (US$ Million)
    Figure 2. Global Bus Services Market Share by Type: 2023 VS 2030
    Figure 3. Light and Medium Type Features
    Figure 4. Large Type Features
    Figure 5. Global Bus Services Market Size Growth Rate by Application, 2019 VS 2023 VS 2030 (US$ Million)
    Figure 6. Global Bus Services Market Share by Application: 2023 VS 2030
    Figure 7. Urban Transport Case Studies
    Figure 8. Long Distance Transport Case Studies
    Figure 9. Specialist Services Case Studies
    Figure 10. Bus Services Report Years Considered
    Figure 11. Global Bus Services Market Size (US$ Million), Year-over-Year: 2019-2030
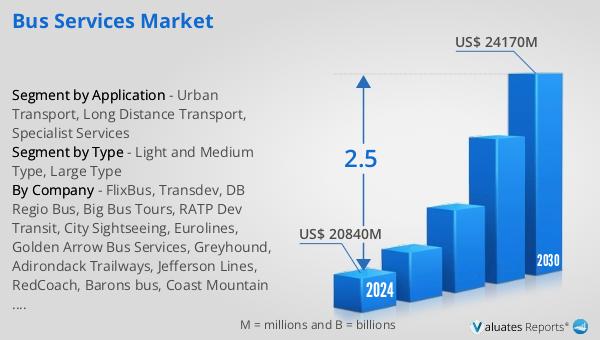
    Figure 12. Global Bus Services Market Size, (US$ Million), 2019 VS 2023 VS 2030
    Figure 13. Global Bus Services Market Share by Region: 2023 VS 2030
    Figure 14. Global Bus Services Market Share by Players in 2023
    Figure 15. Global Top Bus Services Players by Company Type (Tier 1, Tier 2, and Tier 3) & (based on the Revenue in Bus Services as of 2023)
    Figure 16. The Top 10 and 5 Players Market Share by Bus Services Revenue in 2023
    Figure 17. North America Bus Services Market Size YoY Growth (2019-2030) & (US$ Million)
    Figure 18. North America Bus Services Market Share by Type (2019-2030)
    Figure 19. North America Bus Services Market Share by Application (2019-2030)
    Figure 20. North America Bus Services Market Share by Country (2019-2030)
    Figure 21. United States Bus Services Market Size YoY Growth (2019-2030) & (US$ Million)
    Figure 22. Canada Bus Services Market Size YoY Growth (2019-2030) & (US$ Million)
    Figure 23. Europe Bus Services Market Size YoY (2019-2030) & (US$ Million)
    Figure 24. Europe Bus Services Market Share by Type (2019-2030)
    Figure 25. Europe Bus Services Market Share by Application (2019-2030)
    Figure 26. Europe Bus Services Market Share by Country (2019-2030)
    Figure 27. Germany Bus Services Market Size YoY Growth (2019-2030) & (US$ Million)
    Figure 28. France Bus Services Market Size YoY Growth (2019-2030) & (US$ Million)
    Figure 29. U.K. Bus Services Market Size YoY Growth (2019-2030) & (US$ Million)
    Figure 30. Italy Bus Services Market Size YoY Growth (2019-2030) & (US$ Million)
    Figure 31. Russia Bus Services Market Size YoY Growth (2019-2030) & (US$ Million)
    Figure 32. Nordic Countries Bus Services Market Size YoY Growth (2019-2030) & (US$ Million)
    Figure 33. China Bus Services Market Size YoY (2019-2030) & (US$ Million)
    Figure 34. China Bus Services Market Share by Type (2019-2030)
    Figure 35. China Bus Services Market Share by Application (2019-2030)
    Figure 36. Asia Bus Services Market Size YoY (2019-2030) & (US$ Million)
    Figure 37. Asia Bus Services Market Share by Type (2019-2030)
    Figure 38. Asia Bus Services Market Share by Application (2019-2030)
    Figure 39. Asia Bus Services Market Share by Region (2019-2030)
    Figure 40. Japan Bus Services Market Size YoY Growth (2019-2030) & (US$ Million)
    Figure 41. South Korea Bus Services Market Size YoY Growth (2019-2030) & (US$ Million)
    Figure 42. China Taiwan Bus Services Market Size YoY Growth (2019-2030) & (US$ Million)
    Figure 43. Southeast Asia Bus Services Market Size YoY Growth (2019-2030) & (US$ Million)
    Figure 44. India Bus Services Market Size YoY Growth (2019-2030) & (US$ Million)
    Figure 45. Australia Bus Services Market Size YoY Growth (2019-2030) & (US$ Million)
    Figure 46. Middle East, Africa, and Latin America Bus Services Market Size YoY (2019-2030) & (US$ Million)
    Figure 47. Middle East, Africa, and Latin America Bus Services Market Share by Type (2019-2030)
    Figure 48. Middle East, Africa, and Latin America Bus Services Market Share by Application (2019-2030)
    Figure 49. Middle East, Africa, and Latin America Bus Services Market Share by Country (2019-2030)
    Figure 50. Brazil Bus Services Market Size YoY Growth (2019-2030) & (US$ Million)
    Figure 51. Mexico Bus Services Market Size YoY Growth (2019-2030) & (US$ Million)
    Figure 52. Turkey Bus Services Market Size YoY Growth (2019-2030) & (US$ Million)
    Figure 53. Saudi Arabia Bus Services Market Size YoY Growth (2019-2030) & (US$ Million)
    Figure 54. Israel Bus Services Market Size YoY Growth (2019-2030) & (US$ Million)
    Figure 55. GCC Countries Bus Services Market Size YoY Growth (2019-2030) & (US$ Million)
    Figure 56. FlixBus Revenue Growth Rate in Bus Services Business (2019-2024)
    Figure 57. Transdev Revenue Growth Rate in Bus Services Business (2019-2024)
    Figure 58. DB Regio Bus Revenue Growth Rate in Bus Services Business (2019-2024)
    Figure 59. Big Bus Tours Revenue Growth Rate in Bus Services Business (2019-2024)
    Figure 60. RATP Dev Transit Revenue Growth Rate in Bus Services Business (2019-2024)
    Figure 61. City Sightseeing Revenue Growth Rate in Bus Services Business (2019-2024)
    Figure 62. Eurolines Revenue Growth Rate in Bus Services Business (2019-2024)
    Figure 63. Golden Arrow Bus Services Revenue Growth Rate in Bus Services Business (2019-2024)
    Figure 64. Greyhound Revenue Growth Rate in Bus Services Business (2019-2024)
    Figure 65. Adirondack Trailways Revenue Growth Rate in Bus Services Business (2019-2024)
    Figure 66. Jefferson Lines Revenue Growth Rate in Bus Services Business (2019-2024)
    Figure 67. RedCoach Revenue Growth Rate in Bus Services Business (2019-2024)
    Figure 68. Barons bus Revenue Growth Rate in Bus Services Business (2019-2024)
    Figure 69. Coast Mountain Bus Company Revenue Growth Rate in Bus Services Business (2019-2024)
    Figure 70. ALSA Revenue Growth Rate in Bus Services Business (2019-2024)
    Figure 71. Viacao Cometa Revenue Growth Rate in Bus Services Business (2019-2024)
    Figure 72. Abhibus Revenue Growth Rate in Bus Services Business (2019-2024)
    Figure 73. Tornado Bus Company Revenue Growth Rate in Bus Services Business (2019-2024)
    Figure 74. Shunxiang Bus Revenue Growth Rate in Bus Services Business (2019-2024)
    Figure 75. Shenzhen Bus Group Revenue Growth Rate in Bus Services Business (2019-2024)
    Figure 76. Bottom-up and Top-down Approaches for This Report
    Figure 77. Data Triangulation
    Figure 78. Key Executives Interviewed
SELECT A FORMAT
Added to Cart
Electronic (PDF)

$4900

This license allows only one user to access the PDF.
Electronic (PDF)

$7350

This license allows 1 - 5 user to access the PDF, license is suitable for small groups of 5 users working together
Electronic (PDF)

$9800

This license allows users/teams in a same Enterprise to use this report, various departments within an enterpise can use this report
Add to Cart
Buy Now (15% Discount)

OUR CUSTOMER

Accenture