0
U.S. (TOLL FREE)
+1 (315) 215-3225
Automative

0
U.S. (TOLL FREE)
+1 (315) 215-3225
Global 4-Nitrobenzoic Acid Market Insights, Forecast to 2030
Published Date: December 2024
|
Report Code: QYRE-Auto-37P7223
Home | Market Reports | Business & Industrial| Chemicals Industry
Global 4 Nitrobenzoic Acid Market Insights and Forecast to 2028
BUY CHAPTERS

Global 4-Nitrobenzoic Acid Market Insights, Forecast to 2030

Code: QYRE-Auto-37P7223
Report
December 2024
Pages:71
QYResearch
Buy Now with 15% Discount
DESCRIPTION
TABLE OF CONTENT
TABLES & FIGURES

4-Nitrobenzoic Acid Market

4-Nitrobenzoic acid is an organic compound and a precursor to 4-nitrobenzoyl chloride, the precursor to the anesthetic folic acid and procaine.
The global 4-Nitrobenzoic Acid market is projected to grow from US$ million in 2024 to US$ million by 2030, at a Compound Annual Growth Rate (CAGR) of % during the forecast period.
The US & Canada market for 4-Nitrobenzoic Acid is estimated to increase from $ million in 2024 to reach $ million by 2030, at a CAGR of % during the forecast period of 2025 through 2030.
The China market for 4-Nitrobenzoic Acid is estimated to increase from $ million in 2024 to reach $ million by 2030, at a CAGR of % during the forecast period of 2025 through 2030.
The Europe market for 4-Nitrobenzoic Acid is estimated to increase from $ million in 2024 to reach $ million by 2030, at a CAGR of % during the forecast period of 2025 through 2030.
The global key manufacturers of 4-Nitrobenzoic Acid include Xiamen Slsc Biological Technology, Suzhou Jiaye Biotechnology and Hubei YuanCheng Saichuang Technoloy, etc. In 2023, the global top five players had a share approximately % in terms of revenue.
In terms of production side, this report researches the 4-Nitrobenzoic Acid production, growth rate, market share by manufacturers and by region (region level and country level), from 2019 to 2024, and forecast to 2030.
In terms of consumption side, this report focuses on the sales of 4-Nitrobenzoic Acid by region (region level and country level), by company, by Type and by Application. from 2019 to 2024 and forecast to 2030.
Report Covers:
This report presents an overview of global market for 4-Nitrobenzoic Acid, capacity, output, revenue and price. Analyses of the global market trends, with historic market revenue/sales data for 2019 - 2024, estimates for 2024, and projections of CAGR through 2030.
This report researches the key producers of 4-Nitrobenzoic Acid, also provides the consumption of main regions and countries. Highlights of the upcoming market potential for 4-Nitrobenzoic Acid, and key regions/countries of focus to forecast this market into various segments and sub-segments. Country specific data and market value analysis for the U.S., Canada, Mexico, Brazil, China, Japan, South Korea, Southeast Asia, India, Germany, the U.K., Italy, Middle East, Africa, and Other Countries.
This report focuses on the 4-Nitrobenzoic Acid sales, revenue, market share and industry ranking of main manufacturers, data from 2019 to 2024. Identification of the major stakeholders in the global 4-Nitrobenzoic Acid market, and analysis of their competitive landscape and market positioning based on recent developments and segmental revenues. This report will help stakeholders to understand the competitive landscape and gain more insights and position their businesses and market strategies in a better way.
This report analyzes the segments data by Type and by Application, sales, revenue, and price, from 2019 to 2030. Evaluation and forecast the market size for 4-Nitrobenzoic Acid sales, projected growth trends, production technology, application and end-user industry.
Market Segmentation

Scope of 4-Nitrobenzoic Acid Market Report

Report Metric Details
Report Name 4-Nitrobenzoic Acid Market
Segment by Type
Segment by Application
  • Medicine
  • Pigment
  • Other (Sunscreen, etc.)
Production by Region
  • North America
  • Europe
  • China
  • Japan
Sales by Region
  • North America (United States, Canada)
  • Europe (Germany, France, UK, Italy, Russia) Rest of Europe
  • Nordic Countries
  • Asia-Pacific (China, Japan, South Korea)
  • Southeast Asia (India, Australia)
  • Rest of Asia
  • Latin America (Mexico, Brazil)
  • Rest of Latin America
  • Middle East & Africa (Turkey, Saudi Arabia, UAE, Rest of MEA)
By Company Xiamen Slsc Biological Technology, Suzhou Jiaye Biotechnology, Hubei YuanCheng Saichuang Technoloy
Forecast units USD million in value
Report coverage Revenue and volume forecast, company share, competitive landscape, growth factors and trends

Chapter Outline

  • Chapter 1: Introduces the report scope of the report, executive summary of different market segments (by Type and by Application, etc), including the market size of each market segment, future development potential, and so on. It offers a high-level view of the current state of the market and its likely evolution in the short to mid-term, and long term.
  • Chapter 2: 4-Nitrobenzoic Acid production/output of global and key producers (regions/countries). It provides a quantitative analysis of the production, and development potential of each producer in the next six years.
  • Chapter 3: Sales (consumption), revenue of 4-Nitrobenzoic Acid in global, regional level and country level. It provides a quantitative analysis of the market size and development potential of each region and its main countries and introduces the market development, future development prospects, market space of each country in the world.
  • Chapter 4: Detailed analysis of 4-Nitrobenzoic Acid manufacturers competitive landscape, price, sales, revenue, market share and industry ranking, latest development plan, merger, and acquisition information, etc.
  • Chapter 5: Provides the analysis of various market segments by Type, covering the sales, revenue, average price, and development potential of each market segment, to help readers find the blue ocean market in different market segments.
  • Chapter 6: Provides the analysis of various market segments by Application, covering the sales, revenue, average price, and development potential of each market segment, to help readers find the blue ocean market in different downstream markets.
  • Chapter 7: North America (US & Canada) by Type, by Application and by country, sales, and revenue for each segment.
  • Chapter 8: Europe by Type, by Application and by country, sales, and revenue for each segment.
  • Chapter 9: China by Type, and by Application, sales, and revenue for each segment.
  • Chapter 10: Asia (excluding China) by Type, by Application and by region, sales, and revenue for each segment.
  • Chapter 11: Middle East, Africa, Latin America by Type, by Application and by country, sales, and revenue for each segment.
  • Chapter 12: Provides profiles of key manufacturers, introducing the basic situation of the main companies in the market in detail, including product descriptions and specifications, 4-Nitrobenzoic Acid sales, revenue, price, gross margin, and recent development, etc.
  • Chapter 13: Analysis of industrial chain, sales channel, key raw materials, distributors and customers.
  • Chapter 14: Introduces the market dynamics, latest developments of the market, the driving factors and restrictive factors of the market, the challenges and risks faced by manufacturers in the industry, and the analysis of relevant policies in the industry.
  • Chapter 15: The main points and conclusions of the report.

FAQ for this report

Who are the main players in the 4-Nitrobenzoic Acid Market report?

Ans: The main players in the 4-Nitrobenzoic Acid Market are Xiamen Slsc Biological Technology, Suzhou Jiaye Biotechnology, Hubei YuanCheng Saichuang Technoloy

What are the Application segmentation covered in the 4-Nitrobenzoic Acid Market report?

Ans: The Applications covered in the 4-Nitrobenzoic Acid Market report are Medicine, Pigment, Other (Sunscreen, etc.)

What are the Type segmentation covered in the 4-Nitrobenzoic Acid Market report?

Ans: The Types covered in the 4-Nitrobenzoic Acid Market report are Yellow Powder, White Powder

Recommended Reports

Nitrobenzoic Acids

Benzoic & Derivatives

Substituted Organic Acids

1 Study Coverage
1.1 4-Nitrobenzoic Acid Product Introduction
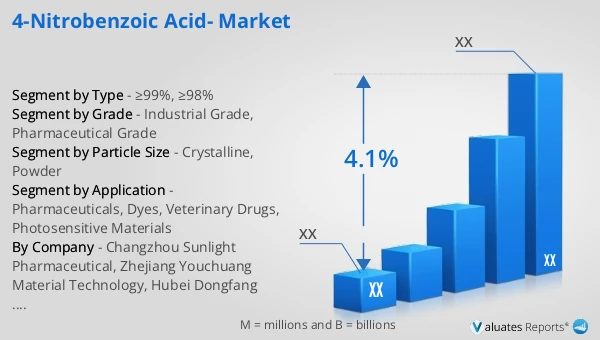
1.2 Market by Type
1.2.1 Global 4-Nitrobenzoic Acid Market Size by Type, 2019 VS 2023 VS 2030
1.2.2 Yellow Powder
1.2.3 White Powder
1.3 Market by Application
1.3.1 Global 4-Nitrobenzoic Acid Market Size by Application, 2019 VS 2023 VS 2030
1.3.2 Medicine
1.3.3 Pigment
1.3.4 Other (Sunscreen, etc.)
1.4 Assumptions and Limitations
1.5 Study Objectives
1.6 Years Considered
2 Global 4-Nitrobenzoic Acid Production
2.1 Global 4-Nitrobenzoic Acid Production Capacity (2019-2030)
2.2 Global 4-Nitrobenzoic Acid Production by Region: 2019 VS 2023 VS 2030
2.3 Global 4-Nitrobenzoic Acid Production by Region
2.3.1 Global 4-Nitrobenzoic Acid Historic Production by Region (2019-2024)
2.3.2 Global 4-Nitrobenzoic Acid Forecasted Production by Region (2025-2030)
2.3.3 Global 4-Nitrobenzoic Acid Production Market Share by Region (2019-2030)
2.4 North America
2.5 Europe
2.6 China
2.7 Japan
3 Executive Summary
3.1 Global 4-Nitrobenzoic Acid Revenue Estimates and Forecasts 2019-2030
3.2 Global 4-Nitrobenzoic Acid Revenue by Region
3.2.1 Global 4-Nitrobenzoic Acid Revenue by Region: 2019 VS 2023 VS 2030
3.2.2 Global 4-Nitrobenzoic Acid Revenue by Region (2019-2024)
3.2.3 Global 4-Nitrobenzoic Acid Revenue by Region (2025-2030)
3.2.4 Global 4-Nitrobenzoic Acid Revenue Market Share by Region (2019-2030)
3.3 Global 4-Nitrobenzoic Acid Sales Estimates and Forecasts 2019-2030
3.4 Global 4-Nitrobenzoic Acid Sales by Region
3.4.1 Global 4-Nitrobenzoic Acid Sales by Region: 2019 VS 2023 VS 2030
3.4.2 Global 4-Nitrobenzoic Acid Sales by Region (2019-2024)
3.4.3 Global 4-Nitrobenzoic Acid Sales by Region (2025-2030)
3.4.4 Global 4-Nitrobenzoic Acid Sales Market Share by Region (2019-2030)
3.5 US & Canada
3.6 Europe
3.7 China
3.8 Asia (excluding China)
3.9 Middle East, Africa and Latin America
4 Competition by Manufactures
4.1 Global 4-Nitrobenzoic Acid Sales by Manufacturers
4.1.1 Global 4-Nitrobenzoic Acid Sales by Manufacturers (2019-2024)
4.1.2 Global 4-Nitrobenzoic Acid Sales Market Share by Manufacturers (2019-2024)
4.1.3 Global Top 10 and Top 5 Largest Manufacturers of 4-Nitrobenzoic Acid in 2023
4.2 Global 4-Nitrobenzoic Acid Revenue by Manufacturers
4.2.1 Global 4-Nitrobenzoic Acid Revenue by Manufacturers (2019-2024)
4.2.2 Global 4-Nitrobenzoic Acid Revenue Market Share by Manufacturers (2019-2024)
4.2.3 Global Top 10 and Top 5 Companies by 4-Nitrobenzoic Acid Revenue in 2023
4.3 Global 4-Nitrobenzoic Acid Sales Price by Manufacturers
4.4 Global Key Players of 4-Nitrobenzoic Acid, Industry Ranking, 2022 VS 2023 VS 2024
4.5 Analysis of Competitive Landscape
4.5.1 Manufacturers Market Concentration Ratio (CR5 and HHI)
4.5.2 Global 4-Nitrobenzoic Acid Market Share by Company Type (Tier 1, Tier 2, and Tier 3)
4.6 Global Key Manufacturers of 4-Nitrobenzoic Acid, Manufacturing Base Distribution and Headquarters
4.7 Global Key Manufacturers of 4-Nitrobenzoic Acid, Product Offered and Application
4.8 Global Key Manufacturers of 4-Nitrobenzoic Acid, Date of Enter into This Industry
4.9 Mergers & Acquisitions, Expansion Plans
5 Market Size by Type
5.1 Global 4-Nitrobenzoic Acid Sales by Type
5.1.1 Global 4-Nitrobenzoic Acid Historical Sales by Type (2019-2024)
5.1.2 Global 4-Nitrobenzoic Acid Forecasted Sales by Type (2025-2030)
5.1.3 Global 4-Nitrobenzoic Acid Sales Market Share by Type (2019-2030)
5.2 Global 4-Nitrobenzoic Acid Revenue by Type
5.2.1 Global 4-Nitrobenzoic Acid Historical Revenue by Type (2019-2024)
5.2.2 Global 4-Nitrobenzoic Acid Forecasted Revenue by Type (2025-2030)
5.2.3 Global 4-Nitrobenzoic Acid Revenue Market Share by Type (2019-2030)
5.3 Global 4-Nitrobenzoic Acid Price by Type
5.3.1 Global 4-Nitrobenzoic Acid Price by Type (2019-2024)
5.3.2 Global 4-Nitrobenzoic Acid Price Forecast by Type (2025-2030)
6 Market Size by Application
6.1 Global 4-Nitrobenzoic Acid Sales by Application
6.1.1 Global 4-Nitrobenzoic Acid Historical Sales by Application (2019-2024)
6.1.2 Global 4-Nitrobenzoic Acid Forecasted Sales by Application (2025-2030)
6.1.3 Global 4-Nitrobenzoic Acid Sales Market Share by Application (2019-2030)
6.2 Global 4-Nitrobenzoic Acid Revenue by Application
6.2.1 Global 4-Nitrobenzoic Acid Historical Revenue by Application (2019-2024)
6.2.2 Global 4-Nitrobenzoic Acid Forecasted Revenue by Application (2025-2030)
6.2.3 Global 4-Nitrobenzoic Acid Revenue Market Share by Application (2019-2030)
6.3 Global 4-Nitrobenzoic Acid Price by Application
6.3.1 Global 4-Nitrobenzoic Acid Price by Application (2019-2024)
6.3.2 Global 4-Nitrobenzoic Acid Price Forecast by Application (2025-2030)
7 US & Canada
7.1 US & Canada 4-Nitrobenzoic Acid Market Size by Type
7.1.1 US & Canada 4-Nitrobenzoic Acid Sales by Type (2019-2030)
7.1.2 US & Canada 4-Nitrobenzoic Acid Revenue by Type (2019-2030)
7.2 US & Canada 4-Nitrobenzoic Acid Market Size by Application
7.2.1 US & Canada 4-Nitrobenzoic Acid Sales by Application (2019-2030)
7.2.2 US & Canada 4-Nitrobenzoic Acid Revenue by Application (2019-2030)
7.3 US & Canada 4-Nitrobenzoic Acid Sales by Country
7.3.1 US & Canada 4-Nitrobenzoic Acid Revenue by Country: 2019 VS 2023 VS 2030
7.3.2 US & Canada 4-Nitrobenzoic Acid Sales by Country (2019-2030)
7.3.3 US & Canada 4-Nitrobenzoic Acid Revenue by Country (2019-2030)
7.3.4 U.S.
7.3.5 Canada
8 Europe
8.1 Europe 4-Nitrobenzoic Acid Market Size by Type
8.1.1 Europe 4-Nitrobenzoic Acid Sales by Type (2019-2030)
8.1.2 Europe 4-Nitrobenzoic Acid Revenue by Type (2019-2030)
8.2 Europe 4-Nitrobenzoic Acid Market Size by Application
8.2.1 Europe 4-Nitrobenzoic Acid Sales by Application (2019-2030)
8.2.2 Europe 4-Nitrobenzoic Acid Revenue by Application (2019-2030)
8.3 Europe 4-Nitrobenzoic Acid Sales by Country
8.3.1 Europe 4-Nitrobenzoic Acid Revenue by Country: 2019 VS 2023 VS 2030
8.3.2 Europe 4-Nitrobenzoic Acid Sales by Country (2019-2030)
8.3.3 Europe 4-Nitrobenzoic Acid Revenue by Country (2019-2030)
8.3.4 Germany
8.3.5 France
8.3.6 U.K.
8.3.7 Italy
8.3.8 Russia
9 China
9.1 China 4-Nitrobenzoic Acid Market Size by Type
9.1.1 China 4-Nitrobenzoic Acid Sales by Type (2019-2030)
9.1.2 China 4-Nitrobenzoic Acid Revenue by Type (2019-2030)
9.2 China 4-Nitrobenzoic Acid Market Size by Application
9.2.1 China 4-Nitrobenzoic Acid Sales by Application (2019-2030)
9.2.2 China 4-Nitrobenzoic Acid Revenue by Application (2019-2030)
10 Asia (excluding China)
10.1 Asia 4-Nitrobenzoic Acid Market Size by Type
10.1.1 Asia 4-Nitrobenzoic Acid Sales by Type (2019-2030)
10.1.2 Asia 4-Nitrobenzoic Acid Revenue by Type (2019-2030)
10.2 Asia 4-Nitrobenzoic Acid Market Size by Application
10.2.1 Asia 4-Nitrobenzoic Acid Sales by Application (2019-2030)
10.2.2 Asia 4-Nitrobenzoic Acid Revenue by Application (2019-2030)
10.3 Asia 4-Nitrobenzoic Acid Sales by Region
10.3.1 Asia 4-Nitrobenzoic Acid Revenue by Region: 2019 VS 2023 VS 2030
10.3.2 Asia 4-Nitrobenzoic Acid Revenue by Region (2019-2030)
10.3.3 Asia 4-Nitrobenzoic Acid Sales by Region (2019-2030)
10.3.4 Japan
10.3.5 South Korea
10.3.6 China Taiwan
10.3.7 Southeast Asia
10.3.8 India
11 Middle East, Africa and Latin America
11.1 Middle East, Africa and Latin America 4-Nitrobenzoic Acid Market Size by Type
11.1.1 Middle East, Africa and Latin America 4-Nitrobenzoic Acid Sales by Type (2019-2030)
11.1.2 Middle East, Africa and Latin America 4-Nitrobenzoic Acid Revenue by Type (2019-2030)
11.2 Middle East, Africa and Latin America 4-Nitrobenzoic Acid Market Size by Application
11.2.1 Middle East, Africa and Latin America 4-Nitrobenzoic Acid Sales by Application (2019-2030)
11.2.2 Middle East, Africa and Latin America 4-Nitrobenzoic Acid Revenue by Application (2019-2030)
11.3 Middle East, Africa and Latin America 4-Nitrobenzoic Acid Sales by Country
11.3.1 Middle East, Africa and Latin America 4-Nitrobenzoic Acid Revenue by Country: 2019 VS 2023 VS 2030
11.3.2 Middle East, Africa and Latin America 4-Nitrobenzoic Acid Revenue by Country (2019-2030)
11.3.3 Middle East, Africa and Latin America 4-Nitrobenzoic Acid Sales by Country (2019-2030)
11.3.4 Brazil
11.3.5 Mexico
11.3.6 Turkey
11.3.7 Israel
11.3.8 GCC Countries
12 Corporate Profiles
12.1 Xiamen Slsc Biological Technology
12.1.1 Xiamen Slsc Biological Technology Company Information
12.1.2 Xiamen Slsc Biological Technology Overview
12.1.3 Xiamen Slsc Biological Technology 4-Nitrobenzoic Acid Capacity, Sales, Price, Revenue and Gross Margin (2019-2024)
12.1.4 Xiamen Slsc Biological Technology 4-Nitrobenzoic Acid Product Model Numbers, Pictures, Descriptions and Specifications
12.1.5 Xiamen Slsc Biological Technology Recent Developments
12.2 Suzhou Jiaye Biotechnology
12.2.1 Suzhou Jiaye Biotechnology Company Information
12.2.2 Suzhou Jiaye Biotechnology Overview
12.2.3 Suzhou Jiaye Biotechnology 4-Nitrobenzoic Acid Capacity, Sales, Price, Revenue and Gross Margin (2019-2024)
12.2.4 Suzhou Jiaye Biotechnology 4-Nitrobenzoic Acid Product Model Numbers, Pictures, Descriptions and Specifications
12.2.5 Suzhou Jiaye Biotechnology Recent Developments
12.3 Hubei YuanCheng Saichuang Technoloy
12.3.1 Hubei YuanCheng Saichuang Technoloy Company Information
12.3.2 Hubei YuanCheng Saichuang Technoloy Overview
12.3.3 Hubei YuanCheng Saichuang Technoloy 4-Nitrobenzoic Acid Capacity, Sales, Price, Revenue and Gross Margin (2019-2024)
12.3.4 Hubei YuanCheng Saichuang Technoloy 4-Nitrobenzoic Acid Product Model Numbers, Pictures, Descriptions and Specifications
12.3.5 Hubei YuanCheng Saichuang Technoloy Recent Developments
13 Industry Chain and Sales Channels Analysis
13.1 4-Nitrobenzoic Acid Industry Chain Analysis
13.2 4-Nitrobenzoic Acid Key Raw Materials
13.2.1 Key Raw Materials
13.2.2 Raw Materials Key Suppliers
13.3 4-Nitrobenzoic Acid Production Mode & Process
13.4 4-Nitrobenzoic Acid Sales and Marketing
13.4.1 4-Nitrobenzoic Acid Sales Channels
13.4.2 4-Nitrobenzoic Acid Distributors
13.5 4-Nitrobenzoic Acid Customers
14 4-Nitrobenzoic Acid Market Dynamics
14.1 4-Nitrobenzoic Acid Industry Trends
14.2 4-Nitrobenzoic Acid Market Drivers
14.3 4-Nitrobenzoic Acid Market Challenges
14.4 4-Nitrobenzoic Acid Market Restraints
15 Key Finding in The Global 4-Nitrobenzoic Acid Study
16 Appendix
16.1 Research Methodology
16.1.1 Methodology/Research Approach
16.1.2 Data Source
16.2 Author Details
16.3 Disclaimer
List of Tables
    Table 1. Global 4-Nitrobenzoic Acid Market Size Growth Rate by Type, 2019 VS 2023 VS 2030 (US$ Million)
    Table 2. Major Manufacturers of Yellow Powder
    Table 3. Major Manufacturers of White Powder
    Table 4. Global 4-Nitrobenzoic Acid Market Size Growth Rate by Application, 2019 VS 2023 VS 2030 (US$ Million)
    Table 5. Global 4-Nitrobenzoic Acid Production by Region: 2019 VS 2023 VS 2030 (Kiloton)
    Table 6. Global 4-Nitrobenzoic Acid Production by Region (2019-2024) & (Kiloton)
    Table 7. Global 4-Nitrobenzoic Acid Production by Region (2025-2030) & (Kiloton)
    Table 8. Global 4-Nitrobenzoic Acid Production Market Share by Region (2019-2024)
    Table 9. Global 4-Nitrobenzoic Acid Production Market Share by Region (2025-2030)
    Table 10. Global 4-Nitrobenzoic Acid Revenue Grow Rate (CAGR) by Region: 2019 VS 2023 VS 2030 (US$ Million)
    Table 11. Global 4-Nitrobenzoic Acid Revenue by Region (2019-2024) & (US$ Million)
    Table 12. Global 4-Nitrobenzoic Acid Revenue by Region (2025-2030) & (US$ Million)
    Table 13. Global 4-Nitrobenzoic Acid Revenue Market Share by Region (2019-2024)
    Table 14. Global 4-Nitrobenzoic Acid Revenue Market Share by Region (2025-2030)
    Table 15. Global 4-Nitrobenzoic Acid Sales Grow Rate (CAGR) by Region: 2019 VS 2023 VS 2030 (US$ Million)
    Table 16. Global 4-Nitrobenzoic Acid Sales by Region (2019-2024) & (Kiloton)
    Table 17. Global 4-Nitrobenzoic Acid Sales by Region (2025-2030) & (Kiloton)
    Table 18. Global 4-Nitrobenzoic Acid Sales Market Share by Region (2019-2024)
    Table 19. Global 4-Nitrobenzoic Acid Sales Market Share by Region (2025-2030)
    Table 20. Global 4-Nitrobenzoic Acid Sales by Manufacturers (2019-2024) & (Kiloton)
    Table 21. Global 4-Nitrobenzoic Acid Sales Share by Manufacturers (2019-2024)
    Table 22. Global 4-Nitrobenzoic Acid Revenue by Manufacturers (2019-2024) & (US$ Million)
    Table 23. Global 4-Nitrobenzoic Acid Revenue Share by Manufacturers (2019-2024)
    Table 24. 4-Nitrobenzoic Acid Price by Manufacturers 2019-2024 (US$/Ton)
    Table 25. Global Key Players of 4-Nitrobenzoic Acid, Industry Ranking, 2022 VS 2023 VS 2024
    Table 26. Global 4-Nitrobenzoic Acid Manufacturers Market Concentration Ratio (CR5 and HHI)
    Table 27. Global 4-Nitrobenzoic Acid by Company Type (Tier 1, Tier 2, and Tier 3) & (based on the Revenue in 4-Nitrobenzoic Acid as of 2023)
    Table 28. Global Key Manufacturers of 4-Nitrobenzoic Acid, Manufacturing Base Distribution and Headquarters
    Table 29. Global Key Manufacturers of 4-Nitrobenzoic Acid, Product Offered and Application
    Table 30. Global Key Manufacturers of 4-Nitrobenzoic Acid, Date of Enter into This Industry
    Table 31. Mergers & Acquisitions, Expansion Plans
    Table 32. Global 4-Nitrobenzoic Acid Sales by Type (2019-2024) & (Kiloton)
    Table 33. Global 4-Nitrobenzoic Acid Sales by Type (2025-2030) & (Kiloton)
    Table 34. Global 4-Nitrobenzoic Acid Sales Share by Type (2019-2024)
    Table 35. Global 4-Nitrobenzoic Acid Sales Share by Type (2025-2030)
    Table 36. Global 4-Nitrobenzoic Acid Revenue by Type (2019-2024) & (US$ Million)
    Table 37. Global 4-Nitrobenzoic Acid Revenue by Type (2025-2030) & (US$ Million)
    Table 38. Global 4-Nitrobenzoic Acid Revenue Share by Type (2019-2024)
    Table 39. Global 4-Nitrobenzoic Acid Revenue Share by Type (2025-2030)
    Table 40. 4-Nitrobenzoic Acid Price by Type (2019-2024) & (US$/Ton)
    Table 41. Global 4-Nitrobenzoic Acid Price Forecast by Type (2025-2030) & (US$/Ton)
    Table 42. Global 4-Nitrobenzoic Acid Sales by Application (2019-2024) & (Kiloton)
    Table 43. Global 4-Nitrobenzoic Acid Sales by Application (2025-2030) & (Kiloton)
    Table 44. Global 4-Nitrobenzoic Acid Sales Share by Application (2019-2024)
    Table 45. Global 4-Nitrobenzoic Acid Sales Share by Application (2025-2030)
    Table 46. Global 4-Nitrobenzoic Acid Revenue by Application (2019-2024) & (US$ Million)
    Table 47. Global 4-Nitrobenzoic Acid Revenue by Application (2025-2030) & (US$ Million)
    Table 48. Global 4-Nitrobenzoic Acid Revenue Share by Application (2019-2024)
    Table 49. Global 4-Nitrobenzoic Acid Revenue Share by Application (2025-2030)
    Table 50. 4-Nitrobenzoic Acid Price by Application (2019-2024) & (US$/Ton)
    Table 51. Global 4-Nitrobenzoic Acid Price Forecast by Application (2025-2030) & (US$/Ton)
    Table 52. US & Canada 4-Nitrobenzoic Acid Sales by Type (2019-2024) & (Kiloton)
    Table 53. US & Canada 4-Nitrobenzoic Acid Sales by Type (2025-2030) & (Kiloton)
    Table 54. US & Canada 4-Nitrobenzoic Acid Revenue by Type (2019-2024) & (US$ Million)
    Table 55. US & Canada 4-Nitrobenzoic Acid Revenue by Type (2025-2030) & (US$ Million)
    Table 56. US & Canada 4-Nitrobenzoic Acid Sales by Application (2019-2024) & (Kiloton)
    Table 57. US & Canada 4-Nitrobenzoic Acid Sales by Application (2025-2030) & (Kiloton)
    Table 58. US & Canada 4-Nitrobenzoic Acid Revenue by Application (2019-2024) & (US$ Million)
    Table 59. US & Canada 4-Nitrobenzoic Acid Revenue by Application (2025-2030) & (US$ Million)
    Table 60. US & Canada 4-Nitrobenzoic Acid Revenue Grow Rate (CAGR) by Country: 2019 VS 2023 VS 2030 (US$ Million)
    Table 61. US & Canada 4-Nitrobenzoic Acid Revenue by Country (2019-2024) & (US$ Million)
    Table 62. US & Canada 4-Nitrobenzoic Acid Revenue by Country (2025-2030) & (US$ Million)
    Table 63. US & Canada 4-Nitrobenzoic Acid Sales by Country (2019-2024) & (Kiloton)
    Table 64. US & Canada 4-Nitrobenzoic Acid Sales by Country (2025-2030) & (Kiloton)
    Table 65. Europe 4-Nitrobenzoic Acid Sales by Type (2019-2024) & (Kiloton)
    Table 66. Europe 4-Nitrobenzoic Acid Sales by Type (2025-2030) & (Kiloton)
    Table 67. Europe 4-Nitrobenzoic Acid Revenue by Type (2019-2024) & (US$ Million)
    Table 68. Europe 4-Nitrobenzoic Acid Revenue by Type (2025-2030) & (US$ Million)
    Table 69. Europe 4-Nitrobenzoic Acid Sales by Application (2019-2024) & (Kiloton)
    Table 70. Europe 4-Nitrobenzoic Acid Sales by Application (2025-2030) & (Kiloton)
    Table 71. Europe 4-Nitrobenzoic Acid Revenue by Application (2019-2024) & (US$ Million)
    Table 72. Europe 4-Nitrobenzoic Acid Revenue by Application (2025-2030) & (US$ Million)
    Table 73. Europe 4-Nitrobenzoic Acid Revenue Grow Rate (CAGR) by Country: 2019 VS 2023 VS 2030 (US$ Million)
    Table 74. Europe 4-Nitrobenzoic Acid Revenue by Country (2019-2024) & (US$ Million)
    Table 75. Europe 4-Nitrobenzoic Acid Revenue by Country (2025-2030) & (US$ Million)
    Table 76. Europe 4-Nitrobenzoic Acid Sales by Country (2019-2024) & (Kiloton)
    Table 77. Europe 4-Nitrobenzoic Acid Sales by Country (2025-2030) & (Kiloton)
    Table 78. China 4-Nitrobenzoic Acid Sales by Type (2019-2024) & (Kiloton)
    Table 79. China 4-Nitrobenzoic Acid Sales by Type (2025-2030) & (Kiloton)
    Table 80. China 4-Nitrobenzoic Acid Revenue by Type (2019-2024) & (US$ Million)
    Table 81. China 4-Nitrobenzoic Acid Revenue by Type (2025-2030) & (US$ Million)
    Table 82. China 4-Nitrobenzoic Acid Sales by Application (2019-2024) & (Kiloton)
    Table 83. China 4-Nitrobenzoic Acid Sales by Application (2025-2030) & (Kiloton)
    Table 84. China 4-Nitrobenzoic Acid Revenue by Application (2019-2024) & (US$ Million)
    Table 85. China 4-Nitrobenzoic Acid Revenue by Application (2025-2030) & (US$ Million)
    Table 86. Asia 4-Nitrobenzoic Acid Sales by Type (2019-2024) & (Kiloton)
    Table 87. Asia 4-Nitrobenzoic Acid Sales by Type (2025-2030) & (Kiloton)
    Table 88. Asia 4-Nitrobenzoic Acid Revenue by Type (2019-2024) & (US$ Million)
    Table 89. Asia 4-Nitrobenzoic Acid Revenue by Type (2025-2030) & (US$ Million)
    Table 90. Asia 4-Nitrobenzoic Acid Sales by Application (2019-2024) & (Kiloton)
    Table 91. Asia 4-Nitrobenzoic Acid Sales by Application (2025-2030) & (Kiloton)
    Table 92. Asia 4-Nitrobenzoic Acid Revenue by Application (2019-2024) & (US$ Million)
    Table 93. Asia 4-Nitrobenzoic Acid Revenue by Application (2025-2030) & (US$ Million)
    Table 94. Asia 4-Nitrobenzoic Acid Revenue Grow Rate (CAGR) by Country: 2019 VS 2023 VS 2030 (US$ Million)
    Table 95. Asia 4-Nitrobenzoic Acid Revenue by Region (2019-2024) & (US$ Million)
    Table 96. Asia 4-Nitrobenzoic Acid Revenue by Region (2025-2030) & (US$ Million)
    Table 97. Asia 4-Nitrobenzoic Acid Sales by Region (2019-2024) & (Kiloton)
    Table 98. Asia 4-Nitrobenzoic Acid Sales by Region (2025-2030) & (Kiloton)
    Table 99. Middle East, Africa and Latin America 4-Nitrobenzoic Acid Sales by Type (2019-2024) & (Kiloton)
    Table 100. Middle East, Africa and Latin America 4-Nitrobenzoic Acid Sales by Type (2025-2030) & (Kiloton)
    Table 101. Middle East, Africa and Latin America 4-Nitrobenzoic Acid Revenue by Type (2019-2024) & (US$ Million)
    Table 102. Middle East, Africa and Latin America 4-Nitrobenzoic Acid Revenue by Type (2025-2030) & (US$ Million)
    Table 103. Middle East, Africa and Latin America 4-Nitrobenzoic Acid Sales by Application (2019-2024) & (Kiloton)
    Table 104. Middle East, Africa and Latin America 4-Nitrobenzoic Acid Sales by Application (2025-2030) & (Kiloton)
    Table 105. Middle East, Africa and Latin America 4-Nitrobenzoic Acid Revenue by Application (2019-2024) & (US$ Million)
    Table 106. Middle East, Africa and Latin America 4-Nitrobenzoic Acid Revenue by Application (2025-2030) & (US$ Million)
    Table 107. Middle East, Africa and Latin America 4-Nitrobenzoic Acid Revenue Grow Rate (CAGR) by Country: 2019 VS 2023 VS 2030 (US$ Million)
    Table 108. Middle East, Africa and Latin America 4-Nitrobenzoic Acid Revenue by Country (2019-2024) & (US$ Million)
    Table 109. Middle East, Africa and Latin America 4-Nitrobenzoic Acid Revenue by Country (2025-2030) & (US$ Million)
    Table 110. Middle East, Africa and Latin America 4-Nitrobenzoic Acid Sales by Country (2019-2024) & (Kiloton)
    Table 111. Middle East, Africa and Latin America 4-Nitrobenzoic Acid Sales by Country (2025-2030) & (Kiloton)
    Table 112. Xiamen Slsc Biological Technology Company Information
    Table 113. Xiamen Slsc Biological Technology Description and Major Businesses
    Table 114. Xiamen Slsc Biological Technology 4-Nitrobenzoic Acid Capacity Sales (Kiloton), Revenue (US$ Million), Price (US$/Ton) and Gross Margin (2019-2024)
    Table 115. Xiamen Slsc Biological Technology 4-Nitrobenzoic Acid Product Model Numbers, Pictures, Descriptions and Specifications
    Table 116. Xiamen Slsc Biological Technology Recent Development
    Table 117. Suzhou Jiaye Biotechnology Company Information
    Table 118. Suzhou Jiaye Biotechnology Description and Major Businesses
    Table 119. Suzhou Jiaye Biotechnology 4-Nitrobenzoic Acid Capacity Sales (Kiloton), Revenue (US$ Million), Price (US$/Ton) and Gross Margin (2019-2024)
    Table 120. Suzhou Jiaye Biotechnology 4-Nitrobenzoic Acid Product Model Numbers, Pictures, Descriptions and Specifications
    Table 121. Suzhou Jiaye Biotechnology Recent Development
    Table 122. Hubei YuanCheng Saichuang Technoloy Company Information
    Table 123. Hubei YuanCheng Saichuang Technoloy Description and Major Businesses
    Table 124. Hubei YuanCheng Saichuang Technoloy 4-Nitrobenzoic Acid Capacity Sales (Kiloton), Revenue (US$ Million), Price (US$/Ton) and Gross Margin (2019-2024)
    Table 125. Hubei YuanCheng Saichuang Technoloy 4-Nitrobenzoic Acid Product Model Numbers, Pictures, Descriptions and Specifications
    Table 126. Hubei YuanCheng Saichuang Technoloy Recent Development
    Table 127. Key Raw Materials Lists
    Table 128. Raw Materials Key Suppliers Lists
    Table 129. 4-Nitrobenzoic Acid Distributors List
    Table 130. 4-Nitrobenzoic Acid Customers List
    Table 131. 4-Nitrobenzoic Acid Market Trends
    Table 132. 4-Nitrobenzoic Acid Market Drivers
    Table 133. 4-Nitrobenzoic Acid Market Challenges
    Table 134. 4-Nitrobenzoic Acid Market Restraints
    Table 135. Research Programs/Design for This Report
    Table 136. Key Data Information from Secondary Sources
    Table 137. Key Data Information from Primary Sources
List of Figures
    Figure 1. 4-Nitrobenzoic Acid Product Picture
    Figure 2. Global 4-Nitrobenzoic Acid Market Size Growth Rate by Type, 2019 VS 2023 VS 2030 (US$ Million)
    Figure 3. Global 4-Nitrobenzoic Acid Market Share by Type in 2023 & 2030
    Figure 4. Yellow Powder Product Picture
    Figure 5. White Powder Product Picture
    Figure 6. Global 4-Nitrobenzoic Acid Market Size Growth Rate by Application, 2019 VS 2023 VS 2030 (US$ Million)
    Figure 7. Global 4-Nitrobenzoic Acid Market Share by Application in 2023 & 2030
    Figure 8. Medicine
    Figure 9. Pigment
    Figure 10. Other (Sunscreen, etc.)
    Figure 11. 4-Nitrobenzoic Acid Report Years Considered
    Figure 12. Global 4-Nitrobenzoic Acid Capacity, Production and Utilization (2019-2030) & (Kiloton)
    Figure 13. Global 4-Nitrobenzoic Acid Production Market Share by Region in Percentage: 2023 Versus 2030
    Figure 14. Global 4-Nitrobenzoic Acid Production Market Share by Region (2019-2030)
    Figure 15. 4-Nitrobenzoic Acid Production Growth Rate in North America (2019-2030) & (Kiloton)
    Figure 16. 4-Nitrobenzoic Acid Production Growth Rate in Europe (2019-2030) & (Kiloton)
    Figure 17. 4-Nitrobenzoic Acid Production Growth Rate in China (2019-2030) & (Kiloton)
    Figure 18. 4-Nitrobenzoic Acid Production Growth Rate in Japan (2019-2030) & (Kiloton)
    Figure 19. Global 4-Nitrobenzoic Acid Revenue, (US$ Million), 2019 VS 2023 VS 2030
    Figure 20. Global 4-Nitrobenzoic Acid Revenue 2019-2030 (US$ Million)
    Figure 21. Global 4-Nitrobenzoic Acid Revenue (CAGR) by Region: 2019 VS 2023 VS 2030 (US$ Million)
    Figure 22. Global 4-Nitrobenzoic Acid Revenue Market Share by Region in Percentage: 2023 Versus 2030
    Figure 23. Global 4-Nitrobenzoic Acid Revenue Market Share by Region (2019-2030)
    Figure 24. Global 4-Nitrobenzoic Acid Sales 2019-2030 ((Kiloton)
    Figure 25. Global 4-Nitrobenzoic Acid Sales (CAGR) by Region: 2019 VS 2023 VS 2030 (Kiloton)
    Figure 26. Global 4-Nitrobenzoic Acid Sales Market Share by Region (2019-2030)
    Figure 27. US & Canada 4-Nitrobenzoic Acid Sales YoY (2019-2030) & (Kiloton)
    Figure 28. US & Canada 4-Nitrobenzoic Acid Revenue YoY (2019-2030) & (US$ Million)
    Figure 29. Europe 4-Nitrobenzoic Acid Sales YoY (2019-2030) & (Kiloton)
    Figure 30. Europe 4-Nitrobenzoic Acid Revenue YoY (2019-2030) & (US$ Million)
    Figure 31. China 4-Nitrobenzoic Acid Sales YoY (2019-2030) & (Kiloton)
    Figure 32. China 4-Nitrobenzoic Acid Revenue YoY (2019-2030) & (US$ Million)
    Figure 33. Asia (excluding China) 4-Nitrobenzoic Acid Sales YoY (2019-2030) & (Kiloton)
    Figure 34. Asia (excluding China) 4-Nitrobenzoic Acid Revenue YoY (2019-2030) & (US$ Million)
    Figure 35. Middle East, Africa and Latin America 4-Nitrobenzoic Acid Sales YoY (2019-2030) & (Kiloton)
    Figure 36. Middle East, Africa and Latin America 4-Nitrobenzoic Acid Revenue YoY (2019-2030) & (US$ Million)
    Figure 37. The 4-Nitrobenzoic Acid Market Share of Top 10 and Top 5 Largest Manufacturers Around the World in 2023
    Figure 38. The Top 5 and 10 Largest Manufacturers of 4-Nitrobenzoic Acid in the World: Market Share by 4-Nitrobenzoic Acid Revenue in 2023
    Figure 39. Global 4-Nitrobenzoic Acid Market Share by Company Type (Tier 1, Tier 2, and Tier 3): 2019 VS 2023
    Figure 40. Global 4-Nitrobenzoic Acid Sales Market Share by Type (2019-2030)
    Figure 41. Global 4-Nitrobenzoic Acid Revenue Market Share by Type (2019-2030)
    Figure 42. Global 4-Nitrobenzoic Acid Sales Market Share by Application (2019-2030)
    Figure 43. Global 4-Nitrobenzoic Acid Revenue Market Share by Application (2019-2030)
    Figure 44. US & Canada 4-Nitrobenzoic Acid Sales Market Share by Type (2019-2030)
    Figure 45. US & Canada 4-Nitrobenzoic Acid Revenue Market Share by Type (2019-2030)
    Figure 46. US & Canada 4-Nitrobenzoic Acid Sales Market Share by Application (2019-2030)
    Figure 47. US & Canada 4-Nitrobenzoic Acid Revenue Market Share by Application (2019-2030)
    Figure 48. US & Canada 4-Nitrobenzoic Acid Revenue Share by Country (2019-2030)
    Figure 49. US & Canada 4-Nitrobenzoic Acid Sales Share by Country (2019-2030)
    Figure 50. U.S. 4-Nitrobenzoic Acid Revenue (2019-2030) & (US$ Million)
    Figure 51. Canada 4-Nitrobenzoic Acid Revenue (2019-2030) & (US$ Million)
    Figure 52. Europe 4-Nitrobenzoic Acid Sales Market Share by Type (2019-2030)
    Figure 53. Europe 4-Nitrobenzoic Acid Revenue Market Share by Type (2019-2030)
    Figure 54. Europe 4-Nitrobenzoic Acid Sales Market Share by Application (2019-2030)
    Figure 55. Europe 4-Nitrobenzoic Acid Revenue Market Share by Application (2019-2030)
    Figure 56. Europe 4-Nitrobenzoic Acid Revenue Share by Country (2019-2030)
    Figure 57. Europe 4-Nitrobenzoic Acid Sales Share by Country (2019-2030)
    Figure 58. Germany 4-Nitrobenzoic Acid Revenue (2019-2030) & (US$ Million)
    Figure 59. France 4-Nitrobenzoic Acid Revenue (2019-2030) & (US$ Million)
    Figure 60. U.K. 4-Nitrobenzoic Acid Revenue (2019-2030) & (US$ Million)
    Figure 61. Italy 4-Nitrobenzoic Acid Revenue (2019-2030) & (US$ Million)
    Figure 62. Russia 4-Nitrobenzoic Acid Revenue (2019-2030) & (US$ Million)
    Figure 63. China 4-Nitrobenzoic Acid Sales Market Share by Type (2019-2030)
    Figure 64. China 4-Nitrobenzoic Acid Revenue Market Share by Type (2019-2030)
    Figure 65. China 4-Nitrobenzoic Acid Sales Market Share by Application (2019-2030)
    Figure 66. China 4-Nitrobenzoic Acid Revenue Market Share by Application (2019-2030)
    Figure 67. Asia 4-Nitrobenzoic Acid Sales Market Share by Type (2019-2030)
    Figure 68. Asia 4-Nitrobenzoic Acid Revenue Market Share by Type (2019-2030)
    Figure 69. Asia 4-Nitrobenzoic Acid Sales Market Share by Application (2019-2030)
    Figure 70. Asia 4-Nitrobenzoic Acid Revenue Market Share by Application (2019-2030)
    Figure 71. Asia 4-Nitrobenzoic Acid Revenue Share by Region (2019-2030)
    Figure 72. Asia 4-Nitrobenzoic Acid Sales Share by Region (2019-2030)
    Figure 73. Japan 4-Nitrobenzoic Acid Revenue (2019-2030) & (US$ Million)
    Figure 74. South Korea 4-Nitrobenzoic Acid Revenue (2019-2030) & (US$ Million)
    Figure 75. China Taiwan 4-Nitrobenzoic Acid Revenue (2019-2030) & (US$ Million)
    Figure 76. Southeast Asia 4-Nitrobenzoic Acid Revenue (2019-2030) & (US$ Million)
    Figure 77. India 4-Nitrobenzoic Acid Revenue (2019-2030) & (US$ Million)
    Figure 78. Middle East, Africa and Latin America 4-Nitrobenzoic Acid Sales Market Share by Type (2019-2030)
    Figure 79. Middle East, Africa and Latin America 4-Nitrobenzoic Acid Revenue Market Share by Type (2019-2030)
    Figure 80. Middle East, Africa and Latin America 4-Nitrobenzoic Acid Sales Market Share by Application (2019-2030)
    Figure 81. Middle East, Africa and Latin America 4-Nitrobenzoic Acid Revenue Market Share by Application (2019-2030)
    Figure 82. Middle East, Africa and Latin America 4-Nitrobenzoic Acid Revenue Share by Country (2019-2030)
    Figure 83. Middle East, Africa and Latin America 4-Nitrobenzoic Acid Sales Share by Country (2019-2030)
    Figure 84. Brazil 4-Nitrobenzoic Acid Revenue (2019-2030) & (US$ Million)
    Figure 85. Mexico 4-Nitrobenzoic Acid Revenue (2019-2030) & (US$ Million)
    Figure 86. Turkey 4-Nitrobenzoic Acid Revenue (2019-2030) & (US$ Million)
    Figure 87. Israel 4-Nitrobenzoic Acid Revenue (2019-2030) & (US$ Million)
    Figure 88. GCC Countries 4-Nitrobenzoic Acid Revenue (2019-2030) & (US$ Million)
    Figure 89. 4-Nitrobenzoic Acid Value Chain
    Figure 90. 4-Nitrobenzoic Acid Production Process
    Figure 91. Channels of Distribution
    Figure 92. Distributors Profiles
    Figure 93. Bottom-up and Top-down Approaches for This Report
    Figure 94. Data Triangulation
    Figure 95. Key Executives Interviewed
SELECT A FORMAT
Added to Cart
Electronic (PDF)

$4900

This license allows only one user to access the PDF.
Electronic (PDF)

$7350

This license allows 1 - 5 user to access the PDF, license is suitable for small groups of 5 users working together
Electronic (PDF)

$9800

This license allows users/teams in a same Enterprise to use this report, various departments within an enterpise can use this report
Add to Cart
Buy Now (15% Discount)

OUR CUSTOMER

Strategic Venue Partners