Table of Contents
1 Report Overview
1.1 Study Scope
1.2 Market Analysis by Type
1.2.1 Global Human Capital Management (HCM) Market Size Growth Rate by Type, 2019 VS 2023 VS 2030
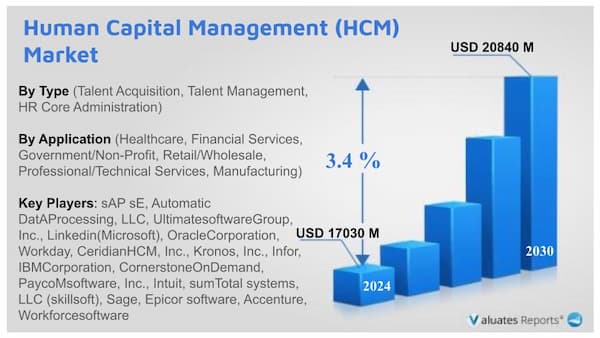
1.2.2 Talent Acquisition
1.2.3 Talent Management
1.2.4 HR Core Administration
1.3 Market by Application
1.3.1 Global Human Capital Management (HCM) Market Size Growth Rate by Application, 2019 VS 2023 VS 2030
1.3.2 Healthcare
1.3.3 Financial Services
1.3.4 Government/Non-Profit
1.3.5 Retail/Wholesale
1.3.6 Professional/Technical Services
1.3.7 Manufacturing
1.4 Assumptions and Limitations
1.5 Study Objectives
1.6 Years Considered
2 Global Growth Trends
2.1 Global Human Capital Management (HCM) Market Perspective (2019-2030)
2.2 Global Human Capital Management (HCM) Growth Trends by Region
2.2.1 Human Capital Management (HCM) Market Size by Region: 2019 VS 2023 VS 2030
2.2.2 Human Capital Management (HCM) Historic Market Size by Region (2019-2024)
2.2.3 Human Capital Management (HCM) Forecasted Market Size by Region (2025-2030)
2.3 Human Capital Management (HCM) Market Dynamics
2.3.1 Human Capital Management (HCM) Industry Trends
2.3.2 Human Capital Management (HCM) Market Drivers
2.3.3 Human Capital Management (HCM) Market Challenges
2.3.4 Human Capital Management (HCM) Market Restraints
3 Competition Landscape by Key Players
3.1 Global Revenue Human Capital Management (HCM) by Players
3.1.1 Global Human Capital Management (HCM) Revenue by Players (2019-2024)
3.1.2 Global Human Capital Management (HCM) Revenue Market Share by Players (2019-2024)
3.2 Global Human Capital Management (HCM) Market Share by Company Type (Tier 1, Tier 2, and Tier 3)
3.3 Global Key Players of Human Capital Management (HCM), Ranking by Revenue, 2022 VS 2023 VS 2024
3.4 Global Human Capital Management (HCM) Market Concentration Ratio
3.4.1 Global Human Capital Management (HCM) Market Concentration Ratio (CR5 and HHI)
3.4.2 Global Top 10 and Top 5 Companies by Human Capital Management (HCM) Revenue in 2023
3.5 Global Key Players of Human Capital Management (HCM) Head office and Area Served
3.6 Global Key Players of Human Capital Management (HCM), Product and Application
3.7 Global Key Players of Human Capital Management (HCM), Date of Enter into This Industry
3.8 Mergers & Acquisitions, Expansion Plans
4 Human Capital Management (HCM) Breakdown Data by Type
4.1 Global Human Capital Management (HCM) Historic Market Size by Type (2019-2024)
4.2 Global Human Capital Management (HCM) Forecasted Market Size by Type (2025-2030)
5 Human Capital Management (HCM) Breakdown Data by Application
5.1 Global Human Capital Management (HCM) Historic Market Size by Application (2019-2024)
5.2 Global Human Capital Management (HCM) Forecasted Market Size by Application (2025-2030)
6 North America
6.1 North America Human Capital Management (HCM) Market Size (2019-2030)
6.2 North America Human Capital Management (HCM) Market Size by Type
6.2.1 North America Human Capital Management (HCM) Market Size by Type (2019-2024)
6.2.2 North America Human Capital Management (HCM) Market Size by Type (2025-2030)
6.2.3 North America Human Capital Management (HCM) Market Share by Type (2019-2030)
6.3 North America Human Capital Management (HCM) Market Size by Application
6.3.1 North America Human Capital Management (HCM) Market Size by Application (2019-2024)
6.3.2 North America Human Capital Management (HCM) Market Size by Application (2025-2030)
6.3.3 North America Human Capital Management (HCM) Market Share by Application (2019-2030)
6.4 North America Human Capital Management (HCM) Market Size by Country
6.4.1 North America Human Capital Management (HCM) Market Size by Country: 2019 VS 2023 VS 2030
6.4.2 North America Human Capital Management (HCM) Market Size by Country (2019-2024)
6.4.3 North America Human Capital Management (HCM) Market Size by Country (2025-2030)
6.4.4 U.S.
6.4.5 Canada
7 Europe
7.1 Europe Human Capital Management (HCM) Market Size (2019-2030)
7.2 Europe Human Capital Management (HCM) Market Size by Type
7.2.1 Europe Human Capital Management (HCM) Market Size by Type (2019-2024)
7.2.2 Europe Human Capital Management (HCM) Market Size by Type (2025-2030)
7.2.3 Europe Human Capital Management (HCM) Market Share by Type (2019-2030)
7.3 Europe Human Capital Management (HCM) Market Size by Application
7.3.1 Europe Human Capital Management (HCM) Market Size by Application (2019-2024)
7.3.2 Europe Human Capital Management (HCM) Market Size by Application (2025-2030)
7.3.3 Europe Human Capital Management (HCM) Market Share by Application (2019-2030)
7.4 Europe Human Capital Management (HCM) Market Size by Country
7.4.1 Europe Human Capital Management (HCM) Market Size by Country: 2019 VS 2023 VS 2030
7.4.2 Europe Human Capital Management (HCM) Market Size by Country (2019-2024)
7.4.3 Europe Human Capital Management (HCM) Market Size by Country (2025-2030)
7.4.3 Germany
7.4.4 France
7.4.5 U.K.
7.4.6 Italy
7.4.7 Russia
7.4.8 Nordic Countries
8 China
8.1 China Human Capital Management (HCM) Market Size (2019-2030)
8.2 China Human Capital Management (HCM) Market Size by Type
8.2.1 China Human Capital Management (HCM) Market Size by Type (2019-2024)
8.2.2 China Human Capital Management (HCM) Market Size by Type (2025-2030)
8.2.3 China Human Capital Management (HCM) Market Share by Type (2019-2030)
8.3 China Human Capital Management (HCM) Market Size by Application
8.3.1 China Human Capital Management (HCM) Market Size by Application (2019-2024)
8.3.2 China Human Capital Management (HCM) Market Size by Application (2025-2030)
8.3.3 China Human Capital Management (HCM) Market Share by Application (2019-2030)
9 Asia (excluding China)
9.1 Asia Human Capital Management (HCM) Market Size (2019-2030)
9.2 Asia Human Capital Management (HCM) Market Size by Type
9.2.1 Asia Human Capital Management (HCM) Market Size by Type (2019-2024)
9.2.2 Asia Human Capital Management (HCM) Market Size by Type (2025-2030)
9.2.3 Asia Human Capital Management (HCM) Market Share by Type (2019-2030)
9.3 Asia Human Capital Management (HCM) Market Size by Application
9.3.1 Asia Human Capital Management (HCM) Market Size by Application (2019-2024)
9.3.2 Asia Human Capital Management (HCM) Market Size by Application (2025-2030)
9.3.3 Asia Human Capital Management (HCM) Market Share by Application (2019-2030)
9.4 Asia Human Capital Management (HCM) Market Size by Region
9.4.1 Asia Human Capital Management (HCM) Market Size by Region: 2019 VS 2023 VS 2030
9.4.2 Asia Human Capital Management (HCM) Market Size by Region (2019-2024)
9.4.3 Asia Human Capital Management (HCM) Market Size by Region (2025-2030)
9.4.4 Japan
9.4.5 South Korea
9.4.6 China Taiwan
9.4.7 Southeast Asia
9.4.8 India
9.4.9 Australia
10 Middle East, Africa, and Latin America
10.1 Middle East, Africa, and Latin America Human Capital Management (HCM) Market Size (2019-2030)
10.2 Middle East, Africa, and Latin America Human Capital Management (HCM) Market Size by Type
10.2.1 Middle East, Africa, and Latin America Human Capital Management (HCM) Market Size by Type (2019-2024)
10.2.2 Middle East, Africa, and Latin America Human Capital Management (HCM) Market Size by Type (2025-2030)
10.2.3 Middle East, Africa, and Latin America Human Capital Management (HCM) Market Share by Type (2019-2030)
10.3 Middle East, Africa, and Latin America Human Capital Management (HCM) Market Size by Application
10.3.1 Middle East, Africa, and Latin America Human Capital Management (HCM) Market Size by Application (2019-2024)
10.3.2 Middle East, Africa, and Latin America Human Capital Management (HCM) Market Size by Application (2025-2030)
10.3.3 Middle East, Africa, and Latin America Human Capital Management (HCM) Market Share by Application (2019-2030)
10.4 Middle East, Africa, and Latin America Human Capital Management (HCM) Market Size by Country
10.4.1 Middle East, Africa, and Latin America Human Capital Management (HCM) Market Size by Country: 2019 VS 2023 VS 2030
10.4.2 Middle East, Africa, and Latin America Human Capital Management (HCM) Market Size by Country (2019-2024)
10.4.3 Middle East, Africa, and Latin America Human Capital Management (HCM) Market Size by Country (2025-2030)
10.4.4 Brazil
10.4.5 Mexico
10.4.6 Turkey
10.4.7 Saudi Arabia
10.4.8 Israel
10.4.9 GCC Countries
11 Key Players Profiles
11.1 sAP sE
11.1.1 sAP sE Company Details
11.1.2 sAP sE Business Overview
11.1.3 sAP sE Human Capital Management (HCM) Introduction
11.1.4 sAP sE Revenue in Human Capital Management (HCM) Business (2019-2024)
11.1.5 sAP sE Recent Developments
11.2 Automatic DatAProcessing, LLC
11.2.1 Automatic DatAProcessing, LLC Company Details
11.2.2 Automatic DatAProcessing, LLC Business Overview
11.2.3 Automatic DatAProcessing, LLC Human Capital Management (HCM) Introduction
11.2.4 Automatic DatAProcessing, LLC Revenue in Human Capital Management (HCM) Business (2019-2024)
11.2.5 Automatic DatAProcessing, LLC Recent Developments
11.3 UltimatesoftwareGroup, Inc.
11.3.1 UltimatesoftwareGroup, Inc. Company Details
11.3.2 UltimatesoftwareGroup, Inc. Business Overview
11.3.3 UltimatesoftwareGroup, Inc. Human Capital Management (HCM) Introduction
11.3.4 UltimatesoftwareGroup, Inc. Revenue in Human Capital Management (HCM) Business (2019-2024)
11.3.5 UltimatesoftwareGroup, Inc. Recent Developments
11.4 Linkedin(Microsoft)
11.4.1 Linkedin(Microsoft) Company Details
11.4.2 Linkedin(Microsoft) Business Overview
11.4.3 Linkedin(Microsoft) Human Capital Management (HCM) Introduction
11.4.4 Linkedin(Microsoft) Revenue in Human Capital Management (HCM) Business (2019-2024)
11.4.5 Linkedin(Microsoft) Recent Developments
11.5 OracleCorporation
11.5.1 OracleCorporation Company Details
11.5.2 OracleCorporation Business Overview
11.5.3 OracleCorporation Human Capital Management (HCM) Introduction
11.5.4 OracleCorporation Revenue in Human Capital Management (HCM) Business (2019-2024)
11.5.5 OracleCorporation Recent Developments
11.6 Workday
11.6.1 Workday Company Details
11.6.2 Workday Business Overview
11.6.3 Workday Human Capital Management (HCM) Introduction
11.6.4 Workday Revenue in Human Capital Management (HCM) Business (2019-2024)
11.6.5 Workday Recent Developments
11.7 CeridianHCM, Inc.
11.7.1 CeridianHCM, Inc. Company Details
11.7.2 CeridianHCM, Inc. Business Overview
11.7.3 CeridianHCM, Inc. Human Capital Management (HCM) Introduction
11.7.4 CeridianHCM, Inc. Revenue in Human Capital Management (HCM) Business (2019-2024)
11.7.5 CeridianHCM, Inc. Recent Developments
11.8 Kronos, Inc.
11.8.1 Kronos, Inc. Company Details
11.8.2 Kronos, Inc. Business Overview
11.8.3 Kronos, Inc. Human Capital Management (HCM) Introduction
11.8.4 Kronos, Inc. Revenue in Human Capital Management (HCM) Business (2019-2024)
11.8.5 Kronos, Inc. Recent Developments
11.9 Infor
11.9.1 Infor Company Details
11.9.2 Infor Business Overview
11.9.3 Infor Human Capital Management (HCM) Introduction
11.9.4 Infor Revenue in Human Capital Management (HCM) Business (2019-2024)
11.9.5 Infor Recent Developments
11.10 IBMCorporation
11.10.1 IBMCorporation Company Details
11.10.2 IBMCorporation Business Overview
11.10.3 IBMCorporation Human Capital Management (HCM) Introduction
11.10.4 IBMCorporation Revenue in Human Capital Management (HCM) Business (2019-2024)
11.10.5 IBMCorporation Recent Developments
11.11 CornerstoneOnDemand
11.11.1 CornerstoneOnDemand Company Details
11.11.2 CornerstoneOnDemand Business Overview
11.11.3 CornerstoneOnDemand Human Capital Management (HCM) Introduction
11.11.4 CornerstoneOnDemand Revenue in Human Capital Management (HCM) Business (2019-2024)
11.11.5 CornerstoneOnDemand Recent Developments
11.12 PaycoMsoftware, Inc.
11.12.1 PaycoMsoftware, Inc. Company Details
11.12.2 PaycoMsoftware, Inc. Business Overview
11.12.3 PaycoMsoftware, Inc. Human Capital Management (HCM) Introduction
11.12.4 PaycoMsoftware, Inc. Revenue in Human Capital Management (HCM) Business (2019-2024)
11.12.5 PaycoMsoftware, Inc. Recent Developments
11.13 Intuit
11.13.1 Intuit Company Details
11.13.2 Intuit Business Overview
11.13.3 Intuit Human Capital Management (HCM) Introduction
11.13.4 Intuit Revenue in Human Capital Management (HCM) Business (2019-2024)
11.13.5 Intuit Recent Developments
11.14 sumTotal systems, LLC (skillsoft)
11.14.1 sumTotal systems, LLC (skillsoft) Company Details
11.14.2 sumTotal systems, LLC (skillsoft) Business Overview
11.14.3 sumTotal systems, LLC (skillsoft) Human Capital Management (HCM) Introduction
11.14.4 sumTotal systems, LLC (skillsoft) Revenue in Human Capital Management (HCM) Business (2019-2024)
11.14.5 sumTotal systems, LLC (skillsoft) Recent Developments
11.15 Sage
11.15.1 Sage Company Details
11.15.2 Sage Business Overview
11.15.3 Sage Human Capital Management (HCM) Introduction
11.15.4 Sage Revenue in Human Capital Management (HCM) Business (2019-2024)
11.15.5 Sage Recent Developments
11.16 Epicor software
11.16.1 Epicor software Company Details
11.16.2 Epicor software Business Overview
11.16.3 Epicor software Human Capital Management (HCM) Introduction
11.16.4 Epicor software Revenue in Human Capital Management (HCM) Business (2019-2024)
11.16.5 Epicor software Recent Developments
11.17 Accenture
11.17.1 Accenture Company Details
11.17.2 Accenture Business Overview
11.17.3 Accenture Human Capital Management (HCM) Introduction
11.17.4 Accenture Revenue in Human Capital Management (HCM) Business (2019-2024)
11.17.5 Accenture Recent Developments
11.18 Workforcesoftware
11.18.1 Workforcesoftware Company Details
11.18.2 Workforcesoftware Business Overview
11.18.3 Workforcesoftware Human Capital Management (HCM) Introduction
11.18.4 Workforcesoftware Revenue in Human Capital Management (HCM) Business (2019-2024)
11.18.5 Workforcesoftware Recent Developments
11.19 Zenefits
11.19.1 Zenefits Company Details
11.19.2 Zenefits Business Overview
11.19.3 Zenefits Human Capital Management (HCM) Introduction
11.19.4 Zenefits Revenue in Human Capital Management (HCM) Business (2019-2024)
11.19.5 Zenefits Recent Developments
11.20 RamcOsystems
11.20.1 RamcOsystems Company Details
11.20.2 RamcOsystems Business Overview
11.20.3 RamcOsystems Human Capital Management (HCM) Introduction
11.20.4 RamcOsystems Revenue in Human Capital Management (HCM) Business (2019-2024)
11.20.5 RamcOsystems Recent Developments
11.21 EPAysystems
11.21.1 EPAysystems Company Details
11.21.2 EPAysystems Business Overview
11.21.3 EPAysystems Human Capital Management (HCM) Introduction
11.21.4 EPAysystems Revenue in Human Capital Management (HCM) Business (2019-2024)
11.21.5 EPAysystems Recent Developments
11.22 Peoplestrategy, Inc.
11.22.1 Peoplestrategy, Inc. Company Details
11.22.2 Peoplestrategy, Inc. Business Overview
11.22.3 Peoplestrategy, Inc. Human Capital Management (HCM) Introduction
11.22.4 Peoplestrategy, Inc. Revenue in Human Capital Management (HCM) Business (2019-2024)
11.22.5 Peoplestrategy, Inc. Recent Developments
12 Analyst's Viewpoints/Conclusions
13 Appendix
13.1 Research Methodology
13.1.1 Methodology/Research Approach
13.1.2 Data Source
13.2 Disclaimer
13.3 Author Details
FEATURED COMPANIES
SAP SE
Automatic Data Processing, LLC
Ultimate Software Group, Inc.
Linkedin (Microsoft)
ORACLE CORPORATION
Workday
Ceridian HCM, Inc.
Kronos
INFOR
IBM Corporation
Cornerstone OnDemand
Paycom Software, Inc.
Intuit
SumTotal Systems, LLC (SkillSoft)
Sage
Epicor Software
Accenture Plc
Workforce Software
Zenefits
Ramco Systems
EPAY Systems
PeopleStrategy
China
SAP
India
Epicor
Microsoft
Table of Figures
List of Tables
Table 1. Global Human Capital Management (HCM) Market Size Growth Rate by Type (US$ Million), 2019 VS 2023 VS 2030
Table 2. Key Players of Talent Acquisition
Table 3. Key Players of Talent Management
Table 4. Key Players of HR Core Administration
Table 5. Global Human Capital Management (HCM) Market Size Growth Rate by Application (US$ Million), 2019 VS 2023 VS 2030
Table 6. Global Human Capital Management (HCM) Market Size Growth Rate (CAGR) by Region (US$ Million): 2019 VS 2023 VS 2030
Table 7. Global Human Capital Management (HCM) Market Size by Region (2019-2024) & (US$ Million)
Table 8. Global Human Capital Management (HCM) Market Share by Region (2019-2024)
Table 9. Global Human Capital Management (HCM) Forecasted Market Size by Region (2025-2030) & (US$ Million)
Table 10. Global Human Capital Management (HCM) Market Share by Region (2025-2030)
Table 11. Human Capital Management (HCM) Market Trends
Table 12. Human Capital Management (HCM) Market Drivers
Table 13. Human Capital Management (HCM) Market Challenges
Table 14. Human Capital Management (HCM) Market Restraints
Table 15. Global Human Capital Management (HCM) Revenue by Players (2019-2024) & (US$ Million)
Table 16. Global Human Capital Management (HCM) Revenue Share by Players (2019-2024)
Table 17. Global Top Human Capital Management (HCM) by Company Type (Tier 1, Tier 2, and Tier 3) & (based on the Revenue in Human Capital Management (HCM) as of 2023)
Table 18. Global Human Capital Management (HCM) Industry Ranking 2022 VS 2023 VS 2024
Table 19. Global 5 Largest Players Market Share by Human Capital Management (HCM) Revenue (CR5 and HHI) & (2019-2024)
Table 20. Global Key Players of Human Capital Management (HCM), Headquarters and Area Served
Table 21. Global Key Players of Human Capital Management (HCM), Product and Application
Table 22. Global Key Players of Human Capital Management (HCM), Product and Application
Table 23. Mergers & Acquisitions, Expansion Plans
Table 24. Global Human Capital Management (HCM) Market Size by Type (2019-2024) & (US$ Million)
Table 25. Global Human Capital Management (HCM) Revenue Market Share by Type (2019-2024)
Table 26. Global Human Capital Management (HCM) Forecasted Market Size by Type (2025-2030) & (US$ Million)
Table 27. Global Human Capital Management (HCM) Revenue Market Share by Type (2025-2030)
Table 28. Global Human Capital Management (HCM) Market Size by Application (2019-2024) & (US$ Million)
Table 29. Global Human Capital Management (HCM) Revenue Share by Application (2019-2024)
Table 30. Global Human Capital Management (HCM) Forecasted Market Size by Application (2025-2030) & (US$ Million)
Table 31. Global Human Capital Management (HCM) Revenue Share by Application (2025-2030)
Table 32. North America Human Capital Management (HCM) Market Size by Type (2019-2024) & (US$ Million)
Table 33. North America Human Capital Management (HCM) Market Size by Type (2025-2030) & (US$ Million)
Table 34. North America Human Capital Management (HCM) Market Size by Application (2019-2024) & (US$ Million)
Table 35. North America Human Capital Management (HCM) Market Size by Application (2025-2030) & (US$ Million)
Table 36. North America Human Capital Management (HCM) Growth Rate (CAGR) by Country (US$ Million): 2019 VS 2023 VS 2030
Table 37. North America Human Capital Management (HCM) Market Size by Country (2019-2024) & (US$ Million)
Table 38. North America Human Capital Management (HCM) Market Size by Country (2025-2030) & (US$ Million)
Table 39. Europe Human Capital Management (HCM) Market Size by Type (2019-2024) & (US$ Million)
Table 40. Europe Human Capital Management (HCM) Market Size by Type (2025-2030) & (US$ Million)
Table 41. Europe Human Capital Management (HCM) Market Size by Application (2019-2024) & (US$ Million)
Table 42. Europe Human Capital Management (HCM) Market Size by Application (2025-2030) & (US$ Million)
Table 43. Europe Human Capital Management (HCM) Growth Rate (CAGR) by Country (US$ Million): 2019 VS 2023 VS 2030
Table 44. Europe Human Capital Management (HCM) Market Size by Country (2019-2024) & (US$ Million)
Table 45. Europe Human Capital Management (HCM) Market Size by Country (2025-2030) & (US$ Million)
Table 46. China Human Capital Management (HCM) Market Size by Type (2019-2024) & (US$ Million)
Table 47. China Human Capital Management (HCM) Market Size by Type (2025-2030) & (US$ Million)
Table 48. China Human Capital Management (HCM) Market Size by Application (2019-2024) & (US$ Million)
Table 49. China Human Capital Management (HCM) Market Size by Application (2025-2030) & (US$ Million)
Table 50. Asia Human Capital Management (HCM) Market Size by Type (2019-2024) & (US$ Million)
Table 51. Asia Human Capital Management (HCM) Market Size by Type (2025-2030) & (US$ Million)
Table 52. Asia Human Capital Management (HCM) Market Size by Application (2019-2024) & (US$ Million)
Table 53. Asia Human Capital Management (HCM) Market Size by Application (2025-2030) & (US$ Million)
Table 54. Asia Human Capital Management (HCM) Growth Rate (CAGR) by Region (US$ Million): 2019 VS 2023 VS 2030
Table 55. Asia Human Capital Management (HCM) Market Size by Region (2019-2024) & (US$ Million)
Table 56. Asia Human Capital Management (HCM) Market Size by Region (2025-2030) & (US$ Million)
Table 57. Middle East, Africa, and Latin America Human Capital Management (HCM) Market Size by Type (2019-2024) & (US$ Million)
Table 58. Middle East, Africa, and Latin America Human Capital Management (HCM) Market Size by Type (2025-2030) & (US$ Million)
Table 59. Middle East, Africa, and Latin America Human Capital Management (HCM) Market Size by Application (2019-2024) & (US$ Million)
Table 60. Middle East, Africa, and Latin America Human Capital Management (HCM) Market Size by Application (2025-2030) & (US$ Million)
Table 61. Middle East, Africa, and Latin America Human Capital Management (HCM) Growth Rate (CAGR) by Country (US$ Million): 2019 VS 2023 VS 2030
Table 62. Middle East, Africa, and Latin America Human Capital Management (HCM) Market Size by Country (2019-2024) & (US$ Million)
Table 63. Middle East, Africa, and Latin America Human Capital Management (HCM) Market Size by Country (2025-2030) & (US$ Million)
Table 64. sAP sE Company Details
Table 65. sAP sE Business Overview
Table 66. sAP sE Human Capital Management (HCM) Product
Table 67. sAP sE Revenue in Human Capital Management (HCM) Business (2019-2024) & (US$ Million)
Table 68. sAP sE Recent Developments
Table 69. Automatic DatAProcessing, LLC Company Details
Table 70. Automatic DatAProcessing, LLC Business Overview
Table 71. Automatic DatAProcessing, LLC Human Capital Management (HCM) Product
Table 72. Automatic DatAProcessing, LLC Revenue in Human Capital Management (HCM) Business (2019-2024) & (US$ Million)
Table 73. Automatic DatAProcessing, LLC Recent Developments
Table 74. UltimatesoftwareGroup, Inc. Company Details
Table 75. UltimatesoftwareGroup, Inc. Business Overview
Table 76. UltimatesoftwareGroup, Inc. Human Capital Management (HCM) Product
Table 77. UltimatesoftwareGroup, Inc. Revenue in Human Capital Management (HCM) Business (2019-2024) & (US$ Million)
Table 78. UltimatesoftwareGroup, Inc. Recent Developments
Table 79. Linkedin(Microsoft) Company Details
Table 80. Linkedin(Microsoft) Business Overview
Table 81. Linkedin(Microsoft) Human Capital Management (HCM) Product
Table 82. Linkedin(Microsoft) Revenue in Human Capital Management (HCM) Business (2019-2024) & (US$ Million)
Table 83. Linkedin(Microsoft) Recent Developments
Table 84. OracleCorporation Company Details
Table 85. OracleCorporation Business Overview
Table 86. OracleCorporation Human Capital Management (HCM) Product
Table 87. OracleCorporation Revenue in Human Capital Management (HCM) Business (2019-2024) & (US$ Million)
Table 88. OracleCorporation Recent Developments
Table 89. Workday Company Details
Table 90. Workday Business Overview
Table 91. Workday Human Capital Management (HCM) Product
Table 92. Workday Revenue in Human Capital Management (HCM) Business (2019-2024) & (US$ Million)
Table 93. Workday Recent Developments
Table 94. CeridianHCM, Inc. Company Details
Table 95. CeridianHCM, Inc. Business Overview
Table 96. CeridianHCM, Inc. Human Capital Management (HCM) Product
Table 97. CeridianHCM, Inc. Revenue in Human Capital Management (HCM) Business (2019-2024) & (US$ Million)
Table 98. CeridianHCM, Inc. Recent Developments
Table 99. Kronos, Inc. Company Details
Table 100. Kronos, Inc. Business Overview
Table 101. Kronos, Inc. Human Capital Management (HCM) Product
Table 102. Kronos, Inc. Revenue in Human Capital Management (HCM) Business (2019-2024) & (US$ Million)
Table 103. Kronos, Inc. Recent Developments
Table 104. Infor Company Details
Table 105. Infor Business Overview
Table 106. Infor Human Capital Management (HCM) Product
Table 107. Infor Revenue in Human Capital Management (HCM) Business (2019-2024) & (US$ Million)
Table 108. Infor Recent Developments
Table 109. IBMCorporation Company Details
Table 110. IBMCorporation Business Overview
Table 111. IBMCorporation Human Capital Management (HCM) Product
Table 112. IBMCorporation Revenue in Human Capital Management (HCM) Business (2019-2024) & (US$ Million)
Table 113. IBMCorporation Recent Developments
Table 114. CornerstoneOnDemand Company Details
Table 115. CornerstoneOnDemand Business Overview
Table 116. CornerstoneOnDemand Human Capital Management (HCM) Product
Table 117. CornerstoneOnDemand Revenue in Human Capital Management (HCM) Business (2019-2024) & (US$ Million)
Table 118. CornerstoneOnDemand Recent Developments
Table 119. PaycoMsoftware, Inc. Company Details
Table 120. PaycoMsoftware, Inc. Business Overview
Table 121. PaycoMsoftware, Inc. Human Capital Management (HCM) Product
Table 122. PaycoMsoftware, Inc. Revenue in Human Capital Management (HCM) Business (2019-2024) & (US$ Million)
Table 123. PaycoMsoftware, Inc. Recent Developments
Table 124. Intuit Company Details
Table 125. Intuit Business Overview
Table 126. Intuit Human Capital Management (HCM) Product
Table 127. Intuit Revenue in Human Capital Management (HCM) Business (2019-2024) & (US$ Million)
Table 128. Intuit Recent Developments
Table 129. sumTotal systems, LLC (skillsoft) Company Details
Table 130. sumTotal systems, LLC (skillsoft) Business Overview
Table 131. sumTotal systems, LLC (skillsoft) Human Capital Management (HCM) Product
Table 132. sumTotal systems, LLC (skillsoft) Revenue in Human Capital Management (HCM) Business (2019-2024) & (US$ Million)
Table 133. sumTotal systems, LLC (skillsoft) Recent Developments
Table 134. Sage Company Details
Table 135. Sage Business Overview
Table 136. Sage Human Capital Management (HCM) Product
Table 137. Sage Revenue in Human Capital Management (HCM) Business (2019-2024) & (US$ Million)
Table 138. Sage Recent Developments
Table 139. Epicor software Company Details
Table 140. Epicor software Business Overview
Table 141. Epicor software Human Capital Management (HCM) Product
Table 142. Epicor software Revenue in Human Capital Management (HCM) Business (2019-2024) & (US$ Million)
Table 143. Epicor software Recent Developments
Table 144. Accenture Company Details
Table 145. Accenture Business Overview
Table 146. Accenture Human Capital Management (HCM) Product
Table 147. Accenture Revenue in Human Capital Management (HCM) Business (2019-2024) & (US$ Million)
Table 148. Accenture Recent Developments
Table 149. Workforcesoftware Company Details
Table 150. Workforcesoftware Business Overview
Table 151. Workforcesoftware Human Capital Management (HCM) Product
Table 152. Workforcesoftware Revenue in Human Capital Management (HCM) Business (2019-2024) & (US$ Million)
Table 153. Workforcesoftware Recent Developments
Table 154. Zenefits Company Details
Table 155. Zenefits Business Overview
Table 156. Zenefits Human Capital Management (HCM) Product
Table 157. Zenefits Revenue in Human Capital Management (HCM) Business (2019-2024) & (US$ Million)
Table 158. Zenefits Recent Developments
Table 159. RamcOsystems Company Details
Table 160. RamcOsystems Business Overview
Table 161. RamcOsystems Human Capital Management (HCM) Product
Table 162. RamcOsystems Revenue in Human Capital Management (HCM) Business (2019-2024) & (US$ Million)
Table 163. RamcOsystems Recent Developments
Table 164. EPAysystems Company Details
Table 165. EPAysystems Business Overview
Table 166. EPAysystems Human Capital Management (HCM) Product
Table 167. EPAysystems Revenue in Human Capital Management (HCM) Business (2019-2024) & (US$ Million)
Table 168. EPAysystems Recent Developments
Table 169. Peoplestrategy, Inc. Company Details
Table 170. Peoplestrategy, Inc. Business Overview
Table 171. Peoplestrategy, Inc. Human Capital Management (HCM) Product
Table 172. Peoplestrategy, Inc. Revenue in Human Capital Management (HCM) Business (2019-2024) & (US$ Million)
Table 173. Peoplestrategy, Inc. Recent Developments
Table 174. Research Programs/Design for This Report
Table 175. Key Data Information from Secondary Sources
Table 176. Key Data Information from Primary Sources
List of Figures
Figure 1. Global Human Capital Management (HCM) Market Size Growth Rate by Type, 2019 VS 2023 VS 2030 (US$ Million)
Figure 2. Global Human Capital Management (HCM) Market Share by Type: 2023 VS 2030
Figure 3. Talent Acquisition Features
Figure 4. Talent Management Features
Figure 5. HR Core Administration Features
Figure 6. Global Human Capital Management (HCM) Market Size Growth Rate by Application, 2019 VS 2023 VS 2030 (US$ Million)
Figure 7. Global Human Capital Management (HCM) Market Share by Application: 2023 VS 2030
Figure 8. Healthcare Case Studies
Figure 9. Financial Services Case Studies
Figure 10. Government/Non-Profit Case Studies
Figure 11. Retail/Wholesale Case Studies
Figure 12. Professional/Technical Services Case Studies
Figure 13. Manufacturing Case Studies
Figure 14. Human Capital Management (HCM) Report Years Considered
Figure 15. Global Human Capital Management (HCM) Market Size (US$ Million), Year-over-Year: 2019-2030
Figure 16. Global Human Capital Management (HCM) Market Size, (US$ Million), 2019 VS 2023 VS 2030
Figure 17. Global Human Capital Management (HCM) Market Share by Region: 2023 VS 2030
Figure 18. Global Human Capital Management (HCM) Market Share by Players in 2023
Figure 19. Global Top Human Capital Management (HCM) Players by Company Type (Tier 1, Tier 2, and Tier 3) & (based on the Revenue in Human Capital Management (HCM) as of 2023)
Figure 20. The Top 10 and 5 Players Market Share by Human Capital Management (HCM) Revenue in 2023
Figure 21. North America Human Capital Management (HCM) Market Size YoY Growth (2019-2030) & (US$ Million)
Figure 22. North America Human Capital Management (HCM) Market Share by Type (2019-2030)
Figure 23. North America Human Capital Management (HCM) Market Share by Application (2019-2030)
Figure 24. North America Human Capital Management (HCM) Market Share by Country (2019-2030)
Figure 25. United States Human Capital Management (HCM) Market Size YoY Growth (2019-2030) & (US$ Million)
Figure 26. Canada Human Capital Management (HCM) Market Size YoY Growth (2019-2030) & (US$ Million)
Figure 27. Europe Human Capital Management (HCM) Market Size YoY (2019-2030) & (US$ Million)
Figure 28. Europe Human Capital Management (HCM) Market Share by Type (2019-2030)
Figure 29. Europe Human Capital Management (HCM) Market Share by Application (2019-2030)
Figure 30. Europe Human Capital Management (HCM) Market Share by Country (2019-2030)
Figure 31. Germany Human Capital Management (HCM) Market Size YoY Growth (2019-2030) & (US$ Million)
Figure 32. France Human Capital Management (HCM) Market Size YoY Growth (2019-2030) & (US$ Million)
Figure 33. U.K. Human Capital Management (HCM) Market Size YoY Growth (2019-2030) & (US$ Million)
Figure 34. Italy Human Capital Management (HCM) Market Size YoY Growth (2019-2030) & (US$ Million)
Figure 35. Russia Human Capital Management (HCM) Market Size YoY Growth (2019-2030) & (US$ Million)
Figure 36. Nordic Countries Human Capital Management (HCM) Market Size YoY Growth (2019-2030) & (US$ Million)
Figure 37. China Human Capital Management (HCM) Market Size YoY (2019-2030) & (US$ Million)
Figure 38. China Human Capital Management (HCM) Market Share by Type (2019-2030)
Figure 39. China Human Capital Management (HCM) Market Share by Application (2019-2030)
Figure 40. Asia Human Capital Management (HCM) Market Size YoY (2019-2030) & (US$ Million)
Figure 41. Asia Human Capital Management (HCM) Market Share by Type (2019-2030)
Figure 42. Asia Human Capital Management (HCM) Market Share by Application (2019-2030)
Figure 43. Asia Human Capital Management (HCM) Market Share by Region (2019-2030)
Figure 44. Japan Human Capital Management (HCM) Market Size YoY Growth (2019-2030) & (US$ Million)
Figure 45. South Korea Human Capital Management (HCM) Market Size YoY Growth (2019-2030) & (US$ Million)
Figure 46. China Taiwan Human Capital Management (HCM) Market Size YoY Growth (2019-2030) & (US$ Million)
Figure 47. Southeast Asia Human Capital Management (HCM) Market Size YoY Growth (2019-2030) & (US$ Million)
Figure 48. India Human Capital Management (HCM) Market Size YoY Growth (2019-2030) & (US$ Million)
Figure 49. Australia Human Capital Management (HCM) Market Size YoY Growth (2019-2030) & (US$ Million)
Figure 50. Middle East, Africa, and Latin America Human Capital Management (HCM) Market Size YoY (2019-2030) & (US$ Million)
Figure 51. Middle East, Africa, and Latin America Human Capital Management (HCM) Market Share by Type (2019-2030)
Figure 52. Middle East, Africa, and Latin America Human Capital Management (HCM) Market Share by Application (2019-2030)
Figure 53. Middle East, Africa, and Latin America Human Capital Management (HCM) Market Share by Country (2019-2030)
Figure 54. Brazil Human Capital Management (HCM) Market Size YoY Growth (2019-2030) & (US$ Million)
Figure 55. Mexico Human Capital Management (HCM) Market Size YoY Growth (2019-2030) & (US$ Million)
Figure 56. Turkey Human Capital Management (HCM) Market Size YoY Growth (2019-2030) & (US$ Million)
Figure 57. Saudi Arabia Human Capital Management (HCM) Market Size YoY Growth (2019-2030) & (US$ Million)
Figure 58. Israel Human Capital Management (HCM) Market Size YoY Growth (2019-2030) & (US$ Million)
Figure 59. GCC Countries Human Capital Management (HCM) Market Size YoY Growth (2019-2030) & (US$ Million)
Figure 60. sAP sE Revenue Growth Rate in Human Capital Management (HCM) Business (2019-2024)
Figure 61. Automatic DatAProcessing, LLC Revenue Growth Rate in Human Capital Management (HCM) Business (2019-2024)
Figure 62. UltimatesoftwareGroup, Inc. Revenue Growth Rate in Human Capital Management (HCM) Business (2019-2024)
Figure 63. Linkedin(Microsoft) Revenue Growth Rate in Human Capital Management (HCM) Business (2019-2024)
Figure 64. OracleCorporation Revenue Growth Rate in Human Capital Management (HCM) Business (2019-2024)
Figure 65. Workday Revenue Growth Rate in Human Capital Management (HCM) Business (2019-2024)
Figure 66. CeridianHCM, Inc. Revenue Growth Rate in Human Capital Management (HCM) Business (2019-2024)
Figure 67. Kronos, Inc. Revenue Growth Rate in Human Capital Management (HCM) Business (2019-2024)
Figure 68. Infor Revenue Growth Rate in Human Capital Management (HCM) Business (2019-2024)
Figure 69. IBMCorporation Revenue Growth Rate in Human Capital Management (HCM) Business (2019-2024)
Figure 70. CornerstoneOnDemand Revenue Growth Rate in Human Capital Management (HCM) Business (2019-2024)
Figure 71. PaycoMsoftware, Inc. Revenue Growth Rate in Human Capital Management (HCM) Business (2019-2024)
Figure 72. Intuit Revenue Growth Rate in Human Capital Management (HCM) Business (2019-2024)
Figure 73. sumTotal systems, LLC (skillsoft) Revenue Growth Rate in Human Capital Management (HCM) Business (2019-2024)
Figure 74. Sage Revenue Growth Rate in Human Capital Management (HCM) Business (2019-2024)
Figure 75. Epicor software Revenue Growth Rate in Human Capital Management (HCM) Business (2019-2024)
Figure 76. Accenture Revenue Growth Rate in Human Capital Management (HCM) Business (2019-2024)
Figure 77. Workforcesoftware Revenue Growth Rate in Human Capital Management (HCM) Business (2019-2024)
Figure 78. Zenefits Revenue Growth Rate in Human Capital Management (HCM) Business (2019-2024)
Figure 79. RamcOsystems Revenue Growth Rate in Human Capital Management (HCM) Business (2019-2024)
Figure 80. EPAysystems Revenue Growth Rate in Human Capital Management (HCM) Business (2019-2024)
Figure 81. Peoplestrategy, Inc. Revenue Growth Rate in Human Capital Management (HCM) Business (2019-2024)
Figure 82. Bottom-up and Top-down Approaches for This Report
Figure 83. Data Triangulation
Figure 84. Key Executives Interviewed