List of Tables
Table 1. Global Wound Cartridge Filter Market Value Comparison by Type (2024 VS 2031) & (US$ Million)
Table 2. Global Wound Cartridge Filter Market Value by Frame Material, (US$ Million) & (2024 VS 2031)
Table 3. Global Wound Cartridge Filter Market Value by Filtering Accuracy, (US$ Million) & (2024 VS 2031)
Table 4. Global Wound Cartridge Filter Market Value by Winding Process, (US$ Million) & (2024 VS 2031)
Table 5. Global Wound Cartridge Filter Market Value by Application (2024 VS 2031) & (US$ Million)
Table 6. Global Wound Cartridge Filter Market Competitive Situation by Manufacturers in 2024
Table 7. Global Wound Cartridge Filter Sales (K Units) of Key Manufacturers (2020-2025)
Table 8. Global Wound Cartridge Filter Sales Market Share by Manufacturers (2020-2025)
Table 9. Global Wound Cartridge Filter Revenue (US$ Million) by Manufacturers (2020-2025)
Table 10. Global Wound Cartridge Filter Revenue Share by Manufacturers (2020-2025)
Table 11. Global Market Wound Cartridge Filter Average Price (US$/Unit) of Key Manufacturers (2020-2025)
Table 12. Global Key Players of Wound Cartridge Filter, Industry Ranking, 2022 VS 2023 VS 2024
Table 13. Global Key Manufacturers of Wound Cartridge Filter, Manufacturing Sites & Headquarters
Table 14. Global Key Manufacturers of Wound Cartridge Filter, Product Type & Application
Table 15. Global Key Manufacturers of Wound Cartridge Filter, Date of Enter into This Industry
Table 16. Global Manufacturers Market Concentration Ratio (CR5 and HHI)
Table 17. Global Wound Cartridge Filter by Company Type (Tier 1, Tier 2, and Tier 3) & (based on the Revenue in Wound Cartridge Filter as of 2024)
Table 18. Manufacturers Mergers & Acquisitions, Expansion Plans
Table 19. Global Wound Cartridge Filter Market Size by Region (US$ Million): 2020 VS 2024 VS 2031
Table 20. Global Wound Cartridge Filter Sales by Region (2020-2025) & (K Units)
Table 21. Global Wound Cartridge Filter Sales Market Share by Region (2020-2025)
Table 22. Global Wound Cartridge Filter Sales by Region (2026-2031) & (K Units)
Table 23. Global Wound Cartridge Filter Sales Market Share by Region (2026-2031)
Table 24. Global Wound Cartridge Filter Revenue by Region (2020-2025) & (US$ Million)
Table 25. Global Wound Cartridge Filter Revenue Market Share by Region (2020-2025)
Table 26. Global Wound Cartridge Filter Revenue by Region (2026-2031) & (US$ Million)
Table 27. Global Wound Cartridge Filter Revenue Market Share by Region (2026-2031)
Table 28. North America Wound Cartridge Filter Revenue by Country: 2020 VS 2024 VS 2031 (US$ Million)
Table 29. North America Wound Cartridge Filter Sales by Country (2020-2025) & (K Units)
Table 30. North America Wound Cartridge Filter Sales by Country (2026-2031) & (K Units)
Table 31. North America Wound Cartridge Filter Revenue by Country (2020-2025) & (US$ Million)
Table 32. North America Wound Cartridge Filter Revenue by Country (2026-2031) & (US$ Million)
Table 33. Europe Wound Cartridge Filter Revenue by Country: 2020 VS 2024 VS 2031 (US$ Million)
Table 34. Europe Wound Cartridge Filter Sales by Country (2020-2025) & (K Units)
Table 35. Europe Wound Cartridge Filter Sales by Country (2026-2031) & (K Units)
Table 36. Europe Wound Cartridge Filter Revenue by Country (2020-2025) & (US$ Million)
Table 37. Europe Wound Cartridge Filter Revenue by Country (2026-2031) & (US$ Million)
Table 38. Asia Pacific Wound Cartridge Filter Revenue by Region: 2020 VS 2024 VS 2031 (US$ Million)
Table 39. Asia Pacific Wound Cartridge Filter Sales by Region (2020-2025) & (K Units)
Table 40. Asia Pacific Wound Cartridge Filter Sales by Region (2026-2031) & (K Units)
Table 41. Asia Pacific Wound Cartridge Filter Revenue by Region (2020-2025) & (US$ Million)
Table 42. Asia Pacific Wound Cartridge Filter Revenue by Region (2026-2031) & (US$ Million)
Table 43. Latin America Wound Cartridge Filter Revenue by Country: 2020 VS 2024 VS 2031 (US$ Million)
Table 44. Latin America Wound Cartridge Filter Sales by Country (2020-2025) & (K Units)
Table 45. Latin America Wound Cartridge Filter Sales by Country (2026-2031) & (K Units)
Table 46. Latin America Wound Cartridge Filter Revenue by Country (2020-2025) & (US$ Million)
Table 47. Latin America Wound Cartridge Filter Revenue by Country (2026-2031) & (US$ Million)
Table 48. Middle East and Africa Wound Cartridge Filter Revenue by Country: 2020 VS 2024 VS 2031 (US$ Million)
Table 49. Middle East and Africa Wound Cartridge Filter Sales by Country (2020-2025) & (K Units)
Table 50. Middle East and Africa Wound Cartridge Filter Sales by Country (2026-2031) & (K Units)
Table 51. Middle East and Africa Wound Cartridge Filter Revenue by Country (2020-2025) & (US$ Million)
Table 52. Middle East and Africa Wound Cartridge Filter Revenue by Country (2026-2031) & (US$ Million)
Table 53. Global Wound Cartridge Filter Sales (K Units) by Type (2020-2025)
Table 54. Global Wound Cartridge Filter Sales (K Units) by Type (2026-2031)
Table 55. Global Wound Cartridge Filter Sales Market Share by Type (2020-2025)
Table 56. Global Wound Cartridge Filter Sales Market Share by Type (2026-2031)
Table 57. Global Wound Cartridge Filter Revenue (US$ Million) by Type (2020-2025)
Table 58. Global Wound Cartridge Filter Revenue (US$ Million) by Type (2026-2031)
Table 59. Global Wound Cartridge Filter Revenue Market Share by Type (2020-2025)
Table 60. Global Wound Cartridge Filter Revenue Market Share by Type (2026-2031)
Table 61. Global Wound Cartridge Filter Price (US$/Unit) by Type (2020-2025)
Table 62. Global Wound Cartridge Filter Price (US$/Unit) by Type (2026-2031)
Table 63. Global Wound Cartridge Filter Sales (K Units) by Application (2020-2025)
Table 64. Global Wound Cartridge Filter Sales (K Units) by Application (2026-2031)
Table 65. Global Wound Cartridge Filter Sales Market Share by Application (2020-2025)
Table 66. Global Wound Cartridge Filter Sales Market Share by Application (2026-2031)
Table 67. Global Wound Cartridge Filter Revenue (US$ Million) by Application (2020-2025)
Table 68. Global Wound Cartridge Filter Revenue (US$ Million) by Application (2026-2031)
Table 69. Global Wound Cartridge Filter Revenue Market Share by Application (2020-2025)
Table 70. Global Wound Cartridge Filter Revenue Market Share by Application (2026-2031)
Table 71. Global Wound Cartridge Filter Price (US$/Unit) by Application (2020-2025)
Table 72. Global Wound Cartridge Filter Price (US$/Unit) by Application (2026-2031)
Table 73. Eaton Company Information
Table 74. Eaton Description and Business Overview
Table 75. Eaton Wound Cartridge Filter Sales (K Units), Revenue (US$ Million), Price (US$/Unit) and Gross Margin (2020-2025)
Table 76. Eaton Wound Cartridge Filter Product
Table 77. Eaton Recent Developments/Updates
Table 78. Pentair Company Information
Table 79. Pentair Description and Business Overview
Table 80. Pentair Wound Cartridge Filter Sales (K Units), Revenue (US$ Million), Price (US$/Unit) and Gross Margin (2020-2025)
Table 81. Pentair Wound Cartridge Filter Product
Table 82. Pentair Recent Developments/Updates
Table 83. Pall Corporation Company Information
Table 84. Pall Corporation Description and Business Overview
Table 85. Pall Corporation Wound Cartridge Filter Sales (K Units), Revenue (US$ Million), Price (US$/Unit) and Gross Margin (2020-2025)
Table 86. Pall Corporation Wound Cartridge Filter Product
Table 87. Pall Corporation Recent Developments/Updates
Table 88. 3M Company Information
Table 89. 3M Description and Business Overview
Table 90. 3M Wound Cartridge Filter Sales (K Units), Revenue (US$ Million), Price (US$/Unit) and Gross Margin (2020-2025)
Table 91. 3M Wound Cartridge Filter Product
Table 92. 3M Recent Developments/Updates
Table 93. Parker Hannifin Corporation Company Information
Table 94. Parker Hannifin Corporation Description and Business Overview
Table 95. Parker Hannifin Corporation Wound Cartridge Filter Sales (K Units), Revenue (US$ Million), Price (US$/Unit) and Gross Margin (2020-2025)
Table 96. Parker Hannifin Corporation Wound Cartridge Filter Product
Table 97. Parker Hannifin Corporation Recent Developments/Updates
Table 98. UFI Company Information
Table 99. UFI Description and Business Overview
Table 100. UFI Wound Cartridge Filter Sales (K Units), Revenue (US$ Million), Price (US$/Unit) and Gross Margin (2020-2025)
Table 101. UFI Wound Cartridge Filter Product
Table 102. UFI Recent Developments/Updates
Table 103. Micron Company Information
Table 104. Micron Description and Business Overview
Table 105. Micron Wound Cartridge Filter Sales (K Units), Revenue (US$ Million), Price (US$/Unit) and Gross Margin (2020-2025)
Table 106. Micron Wound Cartridge Filter Product
Table 107. Micron Recent Developments/Updates
Table 108. Germ Africa Company Information
Table 109. Germ Africa Description and Business Overview
Table 110. Germ Africa Wound Cartridge Filter Sales (K Units), Revenue (US$ Million), Price (US$/Unit) and Gross Margin (2020-2025)
Table 111. Germ Africa Wound Cartridge Filter Product
Table 112. Germ Africa Recent Developments/Updates
Table 113. Germ Group Company Information
Table 114. Germ Group Description and Business Overview
Table 115. Germ Group Wound Cartridge Filter Sales (K Units), Revenue (US$ Million), Price (US$/Unit) and Gross Margin (2020-2025)
Table 116. Germ Group Wound Cartridge Filter Product
Table 117. Germ Group Recent Developments/Updates
Table 118. Cleanflow Company Information
Table 119. Cleanflow Description and Business Overview
Table 120. Cleanflow Wound Cartridge Filter Sales (K Units), Revenue (US$ Million), Price (US$/Unit) and Gross Margin (2020-2025)
Table 121. Cleanflow Wound Cartridge Filter Product
Table 122. Cleanflow Recent Developments/Updates
Table 123. Shelco Filters Company Information
Table 124. Shelco Filters Description and Business Overview
Table 125. Shelco Filters Wound Cartridge Filter Sales (K Units), Revenue (US$ Million), Price (US$/Unit) and Gross Margin (2020-2025)
Table 126. Shelco Filters Wound Cartridge Filter Product
Table 127. Shelco Filters Recent Developments/Updates
Table 128. United Filters International Company Information
Table 129. United Filters International Description and Business Overview
Table 130. United Filters International Wound Cartridge Filter Sales (K Units), Revenue (US$ Million), Price (US$/Unit) and Gross Margin (2020-2025)
Table 131. United Filters International Wound Cartridge Filter Product
Table 132. United Filters International Recent Developments/Updates
Table 133. Brother Filtration Company Information
Table 134. Brother Filtration Description and Business Overview
Table 135. Brother Filtration Wound Cartridge Filter Sales (K Units), Revenue (US$ Million), Price (US$/Unit) and Gross Margin (2020-2025)
Table 136. Brother Filtration Wound Cartridge Filter Product
Table 137. Brother Filtration Recent Developments/Updates
Table 138. Rosedale Products Company Information
Table 139. Rosedale Products Description and Business Overview
Table 140. Rosedale Products Wound Cartridge Filter Sales (K Units), Revenue (US$ Million), Price (US$/Unit) and Gross Margin (2020-2025)
Table 141. Rosedale Products Wound Cartridge Filter Product
Table 142. Rosedale Products Recent Developments/Updates
Table 143. Pure Aqua, Inc. Company Information
Table 144. Pure Aqua, Inc. Description and Business Overview
Table 145. Pure Aqua, Inc. Wound Cartridge Filter Sales (K Units), Revenue (US$ Million), Price (US$/Unit) and Gross Margin (2020-2025)
Table 146. Pure Aqua, Inc. Wound Cartridge Filter Product
Table 147. Pure Aqua, Inc. Recent Developments/Updates
Table 148. Siebec Company Information
Table 149. Siebec Description and Business Overview
Table 150. Siebec Wound Cartridge Filter Sales (K Units), Revenue (US$ Million), Price (US$/Unit) and Gross Margin (2020-2025)
Table 151. Siebec Wound Cartridge Filter Product
Table 152. Siebec Recent Developments/Updates
Table 153. Fluytec Filtration Technologies S.A. Company Information
Table 154. Fluytec Filtration Technologies S.A. Description and Business Overview
Table 155. Fluytec Filtration Technologies S.A. Wound Cartridge Filter Sales (K Units), Revenue (US$ Million), Price (US$/Unit) and Gross Margin (2020-2025)
Table 156. Fluytec Filtration Technologies S.A. Wound Cartridge Filter Product
Table 157. Fluytec Filtration Technologies S.A. Recent Developments/Updates
Table 158. AJR Filtration Company Information
Table 159. AJR Filtration Description and Business Overview
Table 160. AJR Filtration Wound Cartridge Filter Sales (K Units), Revenue (US$ Million), Price (US$/Unit) and Gross Margin (2020-2025)
Table 161. AJR Filtration Wound Cartridge Filter Product
Table 162. AJR Filtration Recent Developments/Updates
Table 163. Filter Factory Inc. Company Information
Table 164. Filter Factory Inc. Description and Business Overview
Table 165. Filter Factory Inc. Wound Cartridge Filter Sales (K Units), Revenue (US$ Million), Price (US$/Unit) and Gross Margin (2020-2025)
Table 166. Filter Factory Inc. Wound Cartridge Filter Product
Table 167. Filter Factory Inc. Recent Developments/Updates
Table 168. Putsch GmbH & Co. KG Company Information
Table 169. Putsch GmbH & Co. KG Description and Business Overview
Table 170. Putsch GmbH & Co. KG Wound Cartridge Filter Sales (K Units), Revenue (US$ Million), Price (US$/Unit) and Gross Margin (2020-2025)
Table 171. Putsch GmbH & Co. KG Wound Cartridge Filter Product
Table 172. Putsch GmbH & Co. KG Recent Developments/Updates
Table 173. Delta Pure Filtration Company Information
Table 174. Delta Pure Filtration Description and Business Overview
Table 175. Delta Pure Filtration Wound Cartridge Filter Sales (K Units), Revenue (US$ Million), Price (US$/Unit) and Gross Margin (2020-2025)
Table 176. Delta Pure Filtration Wound Cartridge Filter Product
Table 177. Delta Pure Filtration Recent Developments/Updates
Table 178. S.E.W. North Filtration A/S Company Information
Table 179. S.E.W. North Filtration A/S Description and Business Overview
Table 180. S.E.W. North Filtration A/S Wound Cartridge Filter Sales (K Units), Revenue (US$ Million), Price (US$/Unit) and Gross Margin (2020-2025)
Table 181. S.E.W. North Filtration A/S Wound Cartridge Filter Product
Table 182. S.E.W. North Filtration A/S Recent Developments/Updates
Table 183. Horizon Water Co., Ltd. Company Information
Table 184. Horizon Water Co., Ltd. Description and Business Overview
Table 185. Horizon Water Co., Ltd. Wound Cartridge Filter Sales (K Units), Revenue (US$ Million), Price (US$/Unit) and Gross Margin (2020-2025)
Table 186. Horizon Water Co., Ltd. Wound Cartridge Filter Product
Table 187. Horizon Water Co., Ltd. Recent Developments/Updates
Table 188. GFS Filtration Pte Ltd Company Information
Table 189. GFS Filtration Pte Ltd Description and Business Overview
Table 190. GFS Filtration Pte Ltd Wound Cartridge Filter Sales (K Units), Revenue (US$ Million), Price (US$/Unit) and Gross Margin (2020-2025)
Table 191. GFS Filtration Pte Ltd Wound Cartridge Filter Product
Table 192. GFS Filtration Pte Ltd Recent Developments/Updates
Table 193. Syntech Fibres (Pvt) Ltd. Company Information
Table 194. Syntech Fibres (Pvt) Ltd. Description and Business Overview
Table 195. Syntech Fibres (Pvt) Ltd. Wound Cartridge Filter Sales (K Units), Revenue (US$ Million), Price (US$/Unit) and Gross Margin (2020-2025)
Table 196. Syntech Fibres (Pvt) Ltd. Wound Cartridge Filter Product
Table 197. Syntech Fibres (Pvt) Ltd. Recent Developments/Updates
Table 198. Lenntech Water Treatment Company Information
Table 199. Lenntech Water Treatment Description and Business Overview
Table 200. Lenntech Water Treatment Wound Cartridge Filter Sales (K Units), Revenue (US$ Million), Price (US$/Unit) and Gross Margin (2020-2025)
Table 201. Lenntech Water Treatment Wound Cartridge Filter Product
Table 202. Lenntech Water Treatment Recent Developments/Updates
Table 203. ML Ball Company, Inc. Company Information
Table 204. ML Ball Company, Inc. Description and Business Overview
Table 205. ML Ball Company, Inc. Wound Cartridge Filter Sales (K Units), Revenue (US$ Million), Price (US$/Unit) and Gross Margin (2020-2025)
Table 206. ML Ball Company, Inc. Wound Cartridge Filter Product
Table 207. ML Ball Company, Inc. Recent Developments/Updates
Table 208. Pure Life Filters Company Information
Table 209. Pure Life Filters Description and Business Overview
Table 210. Pure Life Filters Wound Cartridge Filter Sales (K Units), Revenue (US$ Million), Price (US$/Unit) and Gross Margin (2020-2025)
Table 211. Pure Life Filters Wound Cartridge Filter Product
Table 212. Pure Life Filters Recent Developments/Updates
Table 213. Filtercor Inc. Company Information
Table 214. Filtercor Inc. Description and Business Overview
Table 215. Filtercor Inc. Wound Cartridge Filter Sales (K Units), Revenue (US$ Million), Price (US$/Unit) and Gross Margin (2020-2025)
Table 216. Filtercor Inc. Wound Cartridge Filter Product
Table 217. Filtercor Inc. Recent Developments/Updates
Table 218. Sedifilt Company Information
Table 219. Sedifilt Description and Business Overview
Table 220. Sedifilt Wound Cartridge Filter Sales (K Units), Revenue (US$ Million), Price (US$/Unit) and Gross Margin (2020-2025)
Table 221. Sedifilt Wound Cartridge Filter Product
Table 222. Sedifilt Recent Developments/Updates
Table 223. Feature-Tec Company Information
Table 224. Feature-Tec Description and Business Overview
Table 225. Feature-Tec Wound Cartridge Filter Sales (K Units), Revenue (US$ Million), Price (US$/Unit) and Gross Margin (2020-2025)
Table 226. Feature-Tec Wound Cartridge Filter Product
Table 227. Feature-Tec Recent Developments/Updates
Table 228. Trinity Filtration Technologies Pvt. Ltd. Company Information
Table 229. Trinity Filtration Technologies Pvt. Ltd. Description and Business Overview
Table 230. Trinity Filtration Technologies Pvt. Ltd. Wound Cartridge Filter Sales (K Units), Revenue (US$ Million), Price (US$/Unit) and Gross Margin (2020-2025)
Table 231. Trinity Filtration Technologies Pvt. Ltd. Wound Cartridge Filter Product
Table 232. Trinity Filtration Technologies Pvt. Ltd. Recent Developments/Updates
Table 233. Wellmate Company Information
Table 234. Wellmate Description and Business Overview
Table 235. Wellmate Wound Cartridge Filter Sales (K Units), Revenue (US$ Million), Price (US$/Unit) and Gross Margin (2020-2025)
Table 236. Wellmate Wound Cartridge Filter Product
Table 237. Wellmate Recent Developments/Updates
Table 238. FSI Company Information
Table 239. FSI Description and Business Overview
Table 240. FSI Wound Cartridge Filter Sales (K Units), Revenue (US$ Million), Price (US$/Unit) and Gross Margin (2020-2025)
Table 241. FSI Wound Cartridge Filter Product
Table 242. FSI Recent Developments/Updates
Table 243. Key Raw Materials Lists
Table 244. Raw Materials Key Suppliers Lists
Table 245. Wound Cartridge Filter Distributors List
Table 246. Wound Cartridge Filter Customers List
Table 247. Wound Cartridge Filter Market Trends
Table 248. Wound Cartridge Filter Market Drivers
Table 249. Wound Cartridge Filter Market Challenges
Table 250. Wound Cartridge Filter Market Restraints
Table 251. Research Programs/Design for This Report
Table 252. Key Data Information from Secondary Sources
Table 253. Key Data Information from Primary Sources
Table 254. Authors List of This Report
List of Figures
Figure 1. Product Picture of Wound Cartridge Filter
Figure 2. Global Wound Cartridge Filter Market Value Comparison by Type (2020-2031) & (US$ Million)
Figure 3. Global Wound Cartridge Filter Market Share by Type: 2024 & 2031
Figure 4. Cotton Fiber Product Picture
Figure 5. Linen Fiber Product Picture
Figure 6. Polypropylene (PP) Fiber Product Picture
Figure 7. Polyester (PET) Fiber Product Picture
Figure 8. Nylon (PA) Fiber Product Picture
Figure 9. Glass Fiber Product Picture
Figure 10. Composite Fiber Product Picture
Figure 11. Global Wound Cartridge Filter Market Value by Frame Material, (US$ Million) & (2020-2031)
Figure 12. Global Wound Cartridge Filter Market Share by Frame Material: 2024 VS 2031
Figure 13. Polypropylene (PP) Product Picture
Figure 14. Stainless Steel Product Picture
Figure 15. ABS Product Picture
Figure 16. Fiberglass Reinforced Plastic (FRP) Product Picture
Figure 17. Global Wound Cartridge Filter Market Value by Filtering Accuracy, (US$ Million) & (2020-2031)
Figure 18. Global Wound Cartridge Filter Market Share by Filtering Accuracy: 2024 VS 2031
Figure 19. More than 50μm Product Picture
Figure 20. 10-50μm Product Picture
Figure 21. 1-10μm Product Picture
Figure 22. 0.5-1μm Product Picture
Figure 23. Global Wound Cartridge Filter Market Value by Winding Process, (US$ Million) & (2020-2031)
Figure 24. Global Wound Cartridge Filter Market Share by Winding Process: 2024 VS 2031
Figure 25. Equidistant Winding Product Picture
Figure 26. Gradual Winding Product Picture
Figure 27. Multi-Layer Winding Product Picture
Figure 28. Cross Winding Product Picture
Figure 29. Global Wound Cartridge Filter Market Value by Application (2020-2031) & (US$ Million)
Figure 30. Global Wound Cartridge Filter Market Share by Application: 2024 & 2031
Figure 31. Water Treatment
Figure 32. Chemicals
Figure 33. Food & Beverage
Figure 34. Pharmaceuticals
Figure 35. Electronics
Figure 36. Automotive
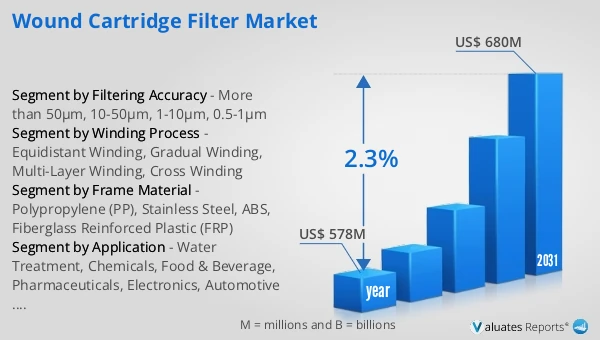
Figure 37. Global Wound Cartridge Filter Revenue, (US$ Million), 2020 VS 2024 VS 2031
Figure 38. Global Wound Cartridge Filter Market Size (2020-2031) & (US$ Million)
Figure 39. Global Wound Cartridge Filter Sales (2020-2031) & (K Units)
Figure 40. Global Wound Cartridge Filter Average Price (US$/Unit) & (2020-2031)
Figure 41. Wound Cartridge Filter Report Years Considered
Figure 42. Wound Cartridge Filter Sales Share by Manufacturers in 2024
Figure 43. Global Wound Cartridge Filter Revenue Share by Manufacturers in 2024
Figure 44. Global 5 and 10 Largest Wound Cartridge Filter Players: Market Share by Revenue in Wound Cartridge Filter in 2024
Figure 45. Wound Cartridge Filter Market Share by Company Type (Tier 1, Tier 2, and Tier 3): 2020 VS 2024
Figure 46. Global Wound Cartridge Filter Market Size by Region (US$ Million): 2020 VS 2024 VS 2031
Figure 47. North America Wound Cartridge Filter Sales Market Share by Country (2020-2031)
Figure 48. North America Wound Cartridge Filter Revenue Market Share by Country (2020-2031)
Figure 49. United States Wound Cartridge Filter Revenue Growth Rate (2020-2031) & (US$ Million)
Figure 50. Canada Wound Cartridge Filter Revenue Growth Rate (2020-2031) & (US$ Million)
Figure 51. Europe Wound Cartridge Filter Sales Market Share by Country (2020-2031)
Figure 52. Europe Wound Cartridge Filter Revenue Market Share by Country (2020-2031)
Figure 53. Germany Wound Cartridge Filter Revenue Growth Rate (2020-2031) & (US$ Million)
Figure 54. France Wound Cartridge Filter Revenue Growth Rate (2020-2031) & (US$ Million)
Figure 55. U.K. Wound Cartridge Filter Revenue Growth Rate (2020-2031) & (US$ Million)
Figure 56. Italy Wound Cartridge Filter Revenue Growth Rate (2020-2031) & (US$ Million)
Figure 57. Russia Wound Cartridge Filter Revenue Growth Rate (2020-2031) & (US$ Million)
Figure 58. Asia Pacific Wound Cartridge Filter Sales Market Share by Region (2020-2031)
Figure 59. Asia Pacific Wound Cartridge Filter Revenue Market Share by Region (2020-2031)
Figure 60. China Wound Cartridge Filter Revenue Growth Rate (2020-2031) & (US$ Million)
Figure 61. Japan Wound Cartridge Filter Revenue Growth Rate (2020-2031) & (US$ Million)
Figure 62. South Korea Wound Cartridge Filter Revenue Growth Rate (2020-2031) & (US$ Million)
Figure 63. India Wound Cartridge Filter Revenue Growth Rate (2020-2031) & (US$ Million)
Figure 64. Australia Wound Cartridge Filter Revenue Growth Rate (2020-2031) & (US$ Million)
Figure 65. China Taiwan Wound Cartridge Filter Revenue Growth Rate (2020-2031) & (US$ Million)
Figure 66. Southeast Asia Wound Cartridge Filter Revenue Growth Rate (2020-2031) & (US$ Million)
Figure 67. Latin America Wound Cartridge Filter Sales Market Share by Country (2020-2031)
Figure 68. Latin America Wound Cartridge Filter Revenue Market Share by Country (2020-2031)
Figure 69. Mexico Wound Cartridge Filter Revenue Growth Rate (2020-2031) & (US$ Million)
Figure 70. Brazil Wound Cartridge Filter Revenue Growth Rate (2020-2031) & (US$ Million)
Figure 71. Argentina Wound Cartridge Filter Revenue Growth Rate (2020-2031) & (US$ Million)
Figure 72. Colombia Wound Cartridge Filter Revenue Growth Rate (2020-2031) & (US$ Million)
Figure 73. Middle East and Africa Wound Cartridge Filter Sales Market Share by Country (2020-2031)
Figure 74. Middle East and Africa Wound Cartridge Filter Revenue Market Share by Country (2020-2031)
Figure 75. Turkey Wound Cartridge Filter Revenue Growth Rate (2020-2031) & (US$ Million)
Figure 76. Saudi Arabia Wound Cartridge Filter Revenue Growth Rate (2020-2031) & (US$ Million)
Figure 77. UAE Wound Cartridge Filter Revenue Growth Rate (2020-2031) & (US$ Million)
Figure 78. Global Sales Market Share of Wound Cartridge Filter by Type (2020-2031)
Figure 79. Global Revenue Market Share of Wound Cartridge Filter by Type (2020-2031)
Figure 80. Global Wound Cartridge Filter Price (US$/Unit) by Type (2020-2031)
Figure 81. Global Sales Market Share of Wound Cartridge Filter by Application (2020-2031)
Figure 82. Global Revenue Market Share of Wound Cartridge Filter by Application (2020-2031)
Figure 83. Global Wound Cartridge Filter Price (US$/Unit) by Application (2020-2031)
Figure 84. Wound Cartridge Filter Value Chain
Figure 85. Channels of Distribution (Direct Vs Distribution)
Figure 86. Bottom-up and Top-down Approaches for This Report
Figure 87. Data Triangulation
Figure 88. Key Executives Interviewed