Extruded Pet Food Products Market Size
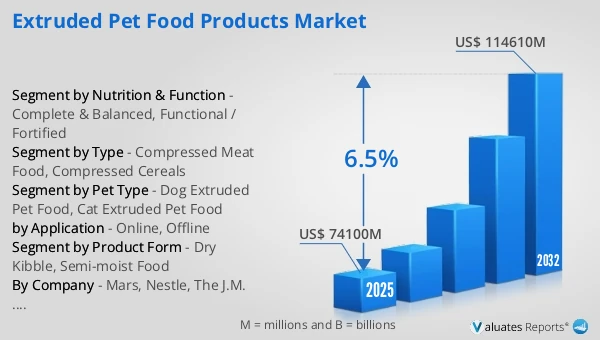
The global Extruded Pet Food Products market was valued at US$ 74100 million in 2025 and is anticipated to reach US$ 114610 million by 2032, at a CAGR of 6.5% from 2026 to 2032.
Extruded Pet Food Products Market
The 2025 U.S. tariff policies introduce profound uncertainty into the global economic landscape. This report critically examines the implications of recent tariff adjustments and international strategic countermeasures on Extruded Pet Food Products competitive dynamics, regional economic interdependencies, and supply chain reconfigurations.
In 2025, global output reached 28.5 million tons, with an average selling price of USD 2.6 per kg, total production capacity of 32 million tons, and a gross margin of 32%.
Extruded pet food products are pet foods manufactured from cereals, meat and by-products, plant proteins, fats, vitamins, and minerals using high-temperature and high-pressure extrusion technology. They are typically produced as dry or semi-moist products and are characterized by uniform nutrition, stable structure, and long shelf life, making them the dominant form of staple food for dogs and cats.
From a global perspective, demand for extruded pet food continues to grow, driven by rising pet ownership, pet humanization, and premiumization of pet food consumption. North America and Europe remain the most mature markets, with a strong focus on branded, functional, and premium products, while the Asia-Pacific region—particularly China and Southeast Asia—shows the fastest growth, supported by expanding production capacity and the parallel development of private-label and branded products.
This report delivers a comprehensive overview of the global Extruded Pet Food Products market, with both quantitative and qualitative analyses, to help readers develop growth strategies, assess the competitive landscape, evaluate their position in the current market, and make informed business decisions regarding Extruded Pet Food Products. The Extruded Pet Food Products market size, estimates, and forecasts are provided in terms of sales volume (K MT) and revenue (US$ millions), with 2025 as the base year and historical and forecast data for 2021–2032.
The report segments the global Extruded Pet Food Products market comprehensively. Regional market sizes by Type, by Application, by Pet Type, and by company are also provided. For deeper insight, the report profiles the competitive landscape, key competitors, and their respective market rankings, and discusses technological trends and new product developments.
This report will assist Extruded Pet Food Products manufacturers, new entrants, and companies across the industry value chain with information on revenues, sales volume, and average prices for the overall market and its sub-segments, by company, by Type, by Application, and by region.
Market Segmentation
Scope of Extruded Pet Food Products Market Report
| Report Metric |
Details |
| Report Name |
Extruded Pet Food Products Market |
| Accounted market size in 2025 |
US$ 74100 million |
| Forecasted market size in 2032 |
US$ 114610 million |
| CAGR |
6.5% |
| Base Year |
2025 |
| Forecasted years |
2026 - 2032 |
| Segment by Type |
- Compressed Meat Food
- Compressed Cereals
|
| Segment by Pet Type |
- Dog Extruded Pet Food
- Cat Extruded Pet Food
|
| Segment by Product Form |
- Dry Kibble
- Semi-moist Food
|
| Segment by Nutrition & Function |
- Complete & Balanced
- Functional / Fortified
|
| by Application |
|
| Consumption by Region |
- North America (United States, Canada)
- Europe (Germany, France, UK, Italy, Russia)
- Asia-Pacific (China, Japan, South Korea, Taiwan)
- Southeast Asia (India)
- Latin America (Mexico, Brazil)
|
| By Company |
Mars, Nestle, The J.M. Smucker Company, United Petfood, Jim Golladay, Blue Buffalo Company |
| Forecast units |
USD million in value |
| Report coverage |
Revenue and volume forecast, company share, competitive landscape, growth factors and trends |
Chapter Outline
- Chapter 1: Defines the scope of the report and presents an executive summary of market segments (by Type, by Application, by Pet Type, etc.), including the size of each segment and its future growth potential. It offers a high-level view of the current market and its likely evolution in the short, medium, and long term.
- Chapter 2: Provides a detailed analysis of the competitive landscape for Extruded Pet Food Products manufacturers, covering pricing, sales and revenue shares, latest development plans, and mergers and acquisitions.
- Chapter 3: Examines Extruded Pet Food Products sales and revenue at the regional and country levels. It quantifies market size and growth potential for each region and its key countries, and outlines market development, outlook, addressable space, and national market size.
- Chapter 4: Analyzes segments by Type, detailing the size and growth potential of each segment to help readers identify “blue ocean” opportunities.
- Chapter 5: Analyzes market segments by Application, covering the size and growth potential of each segment to help readers identify “blue ocean” opportunities in downstream markets.
- Chapter 6: Profiles key players, presenting core information on leading companies, including product sales, revenue, pricing, gross margin, product portfolio/introductions, and recent developments.
- Chapter 7: Reviews the industry value chain, including upstream and downstream segments.
- Chapter 8: Discusses market dynamics and recent developments, including drivers, restraints, challenges and risks for manufacturers, U.S. Tariffs and relevant policy analysis.
- Chapter 9: Summarizes the key findings and conclusions of the report.
FAQ for this report
How fast is Extruded Pet Food Products Market growing?
Ans: The Extruded Pet Food Products Market witnessing a CAGR of 6.5% during the forecast period 2026-2032.
What is the Extruded Pet Food Products Market size in 2032?
Ans: The Extruded Pet Food Products Market size in 2032 will be US$ 114610 million.
Who are the main players in the Extruded Pet Food Products Market report?
Ans: The main players in the Extruded Pet Food Products Market are Mars, Nestle, The J.M. Smucker Company, United Petfood, Jim Golladay, Blue Buffalo Company
What are the Application segmentation covered in the Extruded Pet Food Products Market report?
Ans: The Applications covered in the Extruded Pet Food Products Market report are Online, Offline
What are the Type segmentation covered in the Extruded Pet Food Products Market report?
Ans: The Types covered in the Extruded Pet Food Products Market report are Dog Extruded Pet Food, Cat Extruded Pet Food

