List of Tables
Table 1. Global Ecommerce Price Monitoring Software Market Size Growth Rate by Type (US$ Million): 2020 VS 2024 VS 2031
Table 2. Key Players of Distributed Crawler Architecture
Table 3. Key Players of API Integration Architecture
Table 4. Key Players of Stream Processing Architecture
Table 5. Key Players of Lakeware Architecture
Table 6. Global Ecommerce Price Monitoring Software Market Size Growth Rate by Function-Oriented (US$ Million): 2020 VS 2024 VS 2031
Table 7. Key Players of Real-Time Dynamic Pricing Engine
Table 8. Key Players of Compliance Risk Early Warning System
Table 9. Global Ecommerce Price Monitoring Software Market Size Growth Rate by Deployment Perspective (US$ Million): 2020 VS 2024 VS 2031
Table 10. Key Players of SaaS Cloud Deployment
Table 11. Key Players of Local Server Deployment
Table 12. Key Players of Hybrid Cloud Deployment
Table 13. Key Players of Edge Deployment
Table 14. Global Ecommerce Price Monitoring Software Market Size Growth by Application (US$ Million): 2020 VS 2024 VS 2031
Table 15. Global Ecommerce Price Monitoring Software Market Size by Region (US$ Million): 2020 VS 2024 VS 2031
Table 16. Global Ecommerce Price Monitoring Software Market Size by Region (2020-2025) & (US$ Million)
Table 17. Global Ecommerce Price Monitoring Software Market Share by Region (2020-2025)
Table 18. Global Ecommerce Price Monitoring Software Forecasted Market Size by Region (2026-2031) & (US$ Million)
Table 19. Global Ecommerce Price Monitoring Software Market Share by Region (2026-2031)
Table 20. Ecommerce Price Monitoring Software Market Trends
Table 21. Ecommerce Price Monitoring Software Market Drivers
Table 22. Ecommerce Price Monitoring Software Market Challenges
Table 23. Ecommerce Price Monitoring Software Market Restraints
Table 24. Global Ecommerce Price Monitoring Software Revenue by Players (2020-2025) & (US$ Million)
Table 25. Global Ecommerce Price Monitoring Software Market Share by Players (2020-2025)
Table 26. Global Top Ecommerce Price Monitoring Software Players by Company Type (Tier 1, Tier 2, and Tier 3) & (based on the Revenue in Ecommerce Price Monitoring Software as of 2024)
Table 27. Ranking of Global Top Ecommerce Price Monitoring Software Companies by Revenue (US$ Million) in 2024
Table 28. Global 5 Largest Players Market Share by Ecommerce Price Monitoring Software Revenue (CR5 and HHI) & (2020-2025)
Table 29. Global Key Players of Ecommerce Price Monitoring Software, Headquarters and Area Served
Table 30. Global Key Players of Ecommerce Price Monitoring Software, Product and Application
Table 31. Global Key Players of Ecommerce Price Monitoring Software, Date of Enter into This Industry
Table 32. Mergers & Acquisitions, Expansion Plans
Table 33. Global Ecommerce Price Monitoring Software Market Size by Type (2020-2025) & (US$ Million)
Table 34. Global Ecommerce Price Monitoring Software Revenue Market Share by Type (2020-2025)
Table 35. Global Ecommerce Price Monitoring Software Forecasted Market Size by Type (2026-2031) & (US$ Million)
Table 36. Global Ecommerce Price Monitoring Software Revenue Market Share by Type (2026-2031)
Table 37. Global Ecommerce Price Monitoring Software Market Size by Application (2020-2025) & (US$ Million)
Table 38. Global Ecommerce Price Monitoring Software Revenue Market Share by Application (2020-2025)
Table 39. Global Ecommerce Price Monitoring Software Forecasted Market Size by Application (2026-2031) & (US$ Million)
Table 40. Global Ecommerce Price Monitoring Software Revenue Market Share by Application (2026-2031)
Table 41. North America Ecommerce Price Monitoring Software Market Size Growth Rate by Country (US$ Million): 2020 VS 2024 VS 2031
Table 42. North America Ecommerce Price Monitoring Software Market Size by Country (2020-2025) & (US$ Million)
Table 43. North America Ecommerce Price Monitoring Software Market Size by Country (2026-2031) & (US$ Million)
Table 44. Europe Ecommerce Price Monitoring Software Market Size Growth Rate by Country (US$ Million): 2020 VS 2024 VS 2031
Table 45. Europe Ecommerce Price Monitoring Software Market Size by Country (2020-2025) & (US$ Million)
Table 46. Europe Ecommerce Price Monitoring Software Market Size by Country (2026-2031) & (US$ Million)
Table 47. Asia-Pacific Ecommerce Price Monitoring Software Market Size Growth Rate by Region (US$ Million): 2020 VS 2024 VS 2031
Table 48. Asia-Pacific Ecommerce Price Monitoring Software Market Size by Region (2020-2025) & (US$ Million)
Table 49. Asia-Pacific Ecommerce Price Monitoring Software Market Size by Region (2026-2031) & (US$ Million)
Table 50. Latin America Ecommerce Price Monitoring Software Market Size Growth Rate by Country (US$ Million): 2020 VS 2024 VS 2031
Table 51. Latin America Ecommerce Price Monitoring Software Market Size by Country (2020-2025) & (US$ Million)
Table 52. Latin America Ecommerce Price Monitoring Software Market Size by Country (2026-2031) & (US$ Million)
Table 53. Middle East & Africa Ecommerce Price Monitoring Software Market Size Growth Rate by Country (US$ Million): 2020 VS 2024 VS 2031
Table 54. Middle East & Africa Ecommerce Price Monitoring Software Market Size by Country (2020-2025) & (US$ Million)
Table 55. Middle East & Africa Ecommerce Price Monitoring Software Market Size by Country (2026-2031) & (US$ Million)
Table 56. Prisync Company Details
Table 57. Prisync Business Overview
Table 58. Prisync Ecommerce Price Monitoring Software Product
Table 59. Prisync Revenue in Ecommerce Price Monitoring Software Business (2020-2025) & (US$ Million)
Table 60. Prisync Recent Development
Table 61. Price2Spy Company Details
Table 62. Price2Spy Business Overview
Table 63. Price2Spy Ecommerce Price Monitoring Software Product
Table 64. Price2Spy Revenue in Ecommerce Price Monitoring Software Business (2020-2025) & (US$ Million)
Table 65. Price2Spy Recent Development
Table 66. Repricer Company Details
Table 67. Repricer Business Overview
Table 68. Repricer Ecommerce Price Monitoring Software Product
Table 69. Repricer Revenue in Ecommerce Price Monitoring Software Business (2020-2025) & (US$ Million)
Table 70. Repricer Recent Development
Table 71. Skuuudle Company Details
Table 72. Skuuudle Business Overview
Table 73. Skuuudle Ecommerce Price Monitoring Software Product
Table 74. Skuuudle Revenue in Ecommerce Price Monitoring Software Business (2020-2025) & (US$ Million)
Table 75. Skuuudle Recent Development
Table 76. Minderest Company Details
Table 77. Minderest Business Overview
Table 78. Minderest Ecommerce Price Monitoring Software Product
Table 79. Minderest Revenue in Ecommerce Price Monitoring Software Business (2020-2025) & (US$ Million)
Table 80. Minderest Recent Development
Table 81. Competera Company Details
Table 82. Competera Business Overview
Table 83. Competera Ecommerce Price Monitoring Software Product
Table 84. Competera Revenue in Ecommerce Price Monitoring Software Business (2020-2025) & (US$ Million)
Table 85. Competera Recent Development
Table 86. Dealavo Company Details
Table 87. Dealavo Business Overview
Table 88. Dealavo Ecommerce Price Monitoring Software Product
Table 89. Dealavo Revenue in Ecommerce Price Monitoring Software Business (2020-2025) & (US$ Million)
Table 90. Dealavo Recent Development
Table 91. Intelligence Node Company Details
Table 92. Intelligence Node Business Overview
Table 93. Intelligence Node Ecommerce Price Monitoring Software Product
Table 94. Intelligence Node Revenue in Ecommerce Price Monitoring Software Business (2020-2025) & (US$ Million)
Table 95. Intelligence Node Recent Development
Table 96. Wiser Company Details
Table 97. Wiser Business Overview
Table 98. Wiser Ecommerce Price Monitoring Software Product
Table 99. Wiser Revenue in Ecommerce Price Monitoring Software Business (2020-2025) & (US$ Million)
Table 100. Wiser Recent Development
Table 101. ZenRows Company Details
Table 102. ZenRows Business Overview
Table 103. ZenRows Ecommerce Price Monitoring Software Product
Table 104. ZenRows Revenue in Ecommerce Price Monitoring Software Business (2020-2025) & (US$ Million)
Table 105. ZenRows Recent Development
Table 106. Omnia Company Details
Table 107. Omnia Business Overview
Table 108. Omnia Ecommerce Price Monitoring Software Product
Table 109. Omnia Revenue in Ecommerce Price Monitoring Software Business (2020-2025) & (US$ Million)
Table 110. Omnia Recent Development
Table 111. Bqool Company Details
Table 112. Bqool Business Overview
Table 113. Bqool Ecommerce Price Monitoring Software Product
Table 114. Bqool Revenue in Ecommerce Price Monitoring Software Business (2020-2025) & (US$ Million)
Table 115. Bqool Recent Development
Table 116. PriceShape Company Details
Table 117. PriceShape Business Overview
Table 118. PriceShape Ecommerce Price Monitoring Software Product
Table 119. PriceShape Revenue in Ecommerce Price Monitoring Software Business (2020-2025) & (US$ Million)
Table 120. PriceShape Recent Development
Table 121. Zilliant Company Details
Table 122. Zilliant Business Overview
Table 123. Zilliant Ecommerce Price Monitoring Software Product
Table 124. Zilliant Revenue in Ecommerce Price Monitoring Software Business (2020-2025) & (US$ Million)
Table 125. Zilliant Recent Development
Table 126. MAPP Trap Company Details
Table 127. MAPP Trap Business Overview
Table 128. MAPP Trap Ecommerce Price Monitoring Software Product
Table 129. MAPP Trap Revenue in Ecommerce Price Monitoring Software Business (2020-2025) & (US$ Million)
Table 130. MAPP Trap Recent Development
Table 131. Pricer24 Company Details
Table 132. Pricer24 Business Overview
Table 133. Pricer24 Ecommerce Price Monitoring Software Product
Table 134. Pricer24 Revenue in Ecommerce Price Monitoring Software Business (2020-2025) & (US$ Million)
Table 135. Pricer24 Recent Development
Table 136. PriceRest Company Details
Table 137. PriceRest Business Overview
Table 138. PriceRest Ecommerce Price Monitoring Software Product
Table 139. PriceRest Revenue in Ecommerce Price Monitoring Software Business (2020-2025) & (US$ Million)
Table 140. PriceRest Recent Development
Table 141. PricingBot Company Details
Table 142. PricingBot Business Overview
Table 143. PricingBot Ecommerce Price Monitoring Software Product
Table 144. PricingBot Revenue in Ecommerce Price Monitoring Software Business (2020-2025) & (US$ Million)
Table 145. PricingBot Recent Development
Table 146. Sniffie Company Details
Table 147. Sniffie Business Overview
Table 148. Sniffie Ecommerce Price Monitoring Software Product
Table 149. Sniffie Revenue in Ecommerce Price Monitoring Software Business (2020-2025) & (US$ Million)
Table 150. Sniffie Recent Development
Table 151. BlackCurve Company Details
Table 152. BlackCurve Business Overview
Table 153. BlackCurve Ecommerce Price Monitoring Software Product
Table 154. BlackCurve Revenue in Ecommerce Price Monitoring Software Business (2020-2025) & (US$ Million)
Table 155. BlackCurve Recent Development
Table 156. PriceLab Company Details
Table 157. PriceLab Business Overview
Table 158. PriceLab Ecommerce Price Monitoring Software Product
Table 159. PriceLab Revenue in Ecommerce Price Monitoring Software Business (2020-2025) & (US$ Million)
Table 160. PriceLab Recent Development
Table 161. Research Programs/Design for This Report
Table 162. Key Data Information from Secondary Sources
Table 163. Key Data Information from Primary Sources
Table 164. Authors List of This Report
List of Figures
Figure 1. Ecommerce Price Monitoring Software Picture
Figure 2. Global Ecommerce Price Monitoring Software Market Size Comparison by Type (2020-2031) & (US$ Million)
Figure 3. Global Ecommerce Price Monitoring Software Market Share by Type: 2024 VS 2031
Figure 4. Distributed Crawler Architecture Features
Figure 5. API Integration Architecture Features
Figure 6. Stream Processing Architecture Features
Figure 7. Lakeware Architecture Features
Figure 8. Global Ecommerce Price Monitoring Software Market Size Comparison by Function-Oriented (2020-2031) & (US$ Million)
Figure 9. Real-Time Dynamic Pricing Engine Features
Figure 10. Compliance Risk Early Warning System Features
Figure 11. Global Ecommerce Price Monitoring Software Market Size Comparison by Deployment Perspective (2020-2031) & (US$ Million)
Figure 12. SaaS Cloud Deployment Features
Figure 13. Local Server Deployment Features
Figure 14. Hybrid Cloud Deployment Features
Figure 15. Edge Deployment Features
Figure 16. Global Ecommerce Price Monitoring Software Market Size by Application (2020-2031) & (US$ Million)
Figure 17. Global Ecommerce Price Monitoring Software Market Share by Application: 2024 VS 2031
Figure 18. Financial Industry Case Studies
Figure 19. Biomedicine Case Studies
Figure 20. Smart Manufacturing Case Studies
Figure 21. Other Case Studies
Figure 22. Ecommerce Price Monitoring Software Report Years Considered
Figure 23. Global Ecommerce Price Monitoring Software Market Size (US$ Million), Year-over-Year: 2020-2031
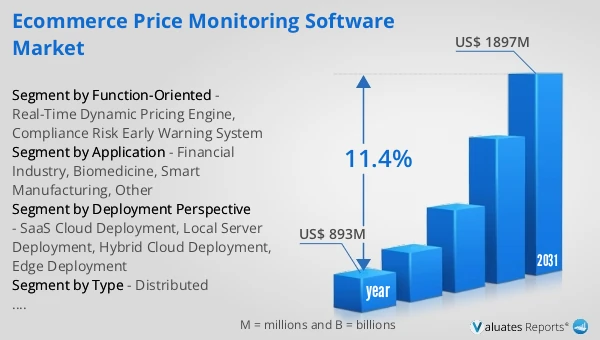
Figure 24. Global Ecommerce Price Monitoring Software Market Size, (US$ Million), 2020 VS 2024 VS 2031
Figure 25. Global Ecommerce Price Monitoring Software Market Share by Region: 2024 VS 2031
Figure 26. Global Ecommerce Price Monitoring Software Market Share by Players in 2024
Figure 27. Global Ecommerce Price Monitoring Software Market Share by Company Type (Tier 1, Tier 2, and Tier 3)
Figure 28. The Top 10 and 5 Players Market Share by Ecommerce Price Monitoring Software Revenue in 2024
Figure 29. North America Ecommerce Price Monitoring Software Market Size YoY Growth (2020-2031) & (US$ Million)
Figure 30. North America Ecommerce Price Monitoring Software Market Share by Country (2020-2031)
Figure 31. United States Ecommerce Price Monitoring Software Market Size YoY Growth (2020-2031) & (US$ Million)
Figure 32. Canada Ecommerce Price Monitoring Software Market Size YoY Growth (2020-2031) & (US$ Million)
Figure 33. Europe Ecommerce Price Monitoring Software Market Size YoY Growth (2020-2031) & (US$ Million)
Figure 34. Europe Ecommerce Price Monitoring Software Market Share by Country (2020-2031)
Figure 35. Germany Ecommerce Price Monitoring Software Market Size YoY Growth (2020-2031) & (US$ Million)
Figure 36. France Ecommerce Price Monitoring Software Market Size YoY Growth (2020-2031) & (US$ Million)
Figure 37. U.K. Ecommerce Price Monitoring Software Market Size YoY Growth (2020-2031) & (US$ Million)
Figure 38. Italy Ecommerce Price Monitoring Software Market Size YoY Growth (2020-2031) & (US$ Million)
Figure 39. Russia Ecommerce Price Monitoring Software Market Size YoY Growth (2020-2031) & (US$ Million)
Figure 40. Ireland Ecommerce Price Monitoring Software Market Size YoY Growth (2020-2031) & (US$ Million)
Figure 41. Asia-Pacific Ecommerce Price Monitoring Software Market Size YoY Growth (2020-2031) & (US$ Million)
Figure 42. Asia-Pacific Ecommerce Price Monitoring Software Market Share by Region (2020-2031)
Figure 43. China Ecommerce Price Monitoring Software Market Size YoY Growth (2020-2031) & (US$ Million)
Figure 44. Japan Ecommerce Price Monitoring Software Market Size YoY Growth (2020-2031) & (US$ Million)
Figure 45. South Korea Ecommerce Price Monitoring Software Market Size YoY Growth (2020-2031) & (US$ Million)
Figure 46. Southeast Asia Ecommerce Price Monitoring Software Market Size YoY Growth (2020-2031) & (US$ Million)
Figure 47. India Ecommerce Price Monitoring Software Market Size YoY Growth (2020-2031) & (US$ Million)
Figure 48. Australia & New Zealand Ecommerce Price Monitoring Software Market Size YoY Growth (2020-2031) & (US$ Million)
Figure 49. Latin America Ecommerce Price Monitoring Software Market Size YoY Growth (2020-2031) & (US$ Million)
Figure 50. Latin America Ecommerce Price Monitoring Software Market Share by Country (2020-2031)
Figure 51. Mexico Ecommerce Price Monitoring Software Market Size YoY Growth (2020-2031) & (US$ Million)
Figure 52. Brazil Ecommerce Price Monitoring Software Market Size YoY Growth (2020-2031) & (US$ Million)
Figure 53. Middle East & Africa Ecommerce Price Monitoring Software Market Size YoY Growth (2020-2031) & (US$ Million)
Figure 54. Middle East & Africa Ecommerce Price Monitoring Software Market Share by Country (2020-2031)
Figure 55. Israel Ecommerce Price Monitoring Software Market Size YoY Growth (2020-2031) & (US$ Million)
Figure 56. Saudi Arabia Ecommerce Price Monitoring Software Market Size YoY Growth (2020-2031) & (US$ Million)
Figure 57. UAE Ecommerce Price Monitoring Software Market Size YoY Growth (2020-2031) & (US$ Million)
Figure 58. Prisync Revenue Growth Rate in Ecommerce Price Monitoring Software Business (2020-2025)
Figure 59. Price2Spy Revenue Growth Rate in Ecommerce Price Monitoring Software Business (2020-2025)
Figure 60. Repricer Revenue Growth Rate in Ecommerce Price Monitoring Software Business (2020-2025)
Figure 61. Skuuudle Revenue Growth Rate in Ecommerce Price Monitoring Software Business (2020-2025)
Figure 62. Minderest Revenue Growth Rate in Ecommerce Price Monitoring Software Business (2020-2025)
Figure 63. Competera Revenue Growth Rate in Ecommerce Price Monitoring Software Business (2020-2025)
Figure 64. Dealavo Revenue Growth Rate in Ecommerce Price Monitoring Software Business (2020-2025)
Figure 65. Intelligence Node Revenue Growth Rate in Ecommerce Price Monitoring Software Business (2020-2025)
Figure 66. Wiser Revenue Growth Rate in Ecommerce Price Monitoring Software Business (2020-2025)
Figure 67. ZenRows Revenue Growth Rate in Ecommerce Price Monitoring Software Business (2020-2025)
Figure 68. Omnia Revenue Growth Rate in Ecommerce Price Monitoring Software Business (2020-2025)
Figure 69. Bqool Revenue Growth Rate in Ecommerce Price Monitoring Software Business (2020-2025)
Figure 70. PriceShape Revenue Growth Rate in Ecommerce Price Monitoring Software Business (2020-2025)
Figure 71. Zilliant Revenue Growth Rate in Ecommerce Price Monitoring Software Business (2020-2025)
Figure 72. MAPP Trap Revenue Growth Rate in Ecommerce Price Monitoring Software Business (2020-2025)
Figure 73. Pricer24 Revenue Growth Rate in Ecommerce Price Monitoring Software Business (2020-2025)
Figure 74. PriceRest Revenue Growth Rate in Ecommerce Price Monitoring Software Business (2020-2025)
Figure 75. PricingBot Revenue Growth Rate in Ecommerce Price Monitoring Software Business (2020-2025)
Figure 76. Sniffie Revenue Growth Rate in Ecommerce Price Monitoring Software Business (2020-2025)
Figure 77. BlackCurve Revenue Growth Rate in Ecommerce Price Monitoring Software Business (2020-2025)
Figure 78. PriceLab Revenue Growth Rate in Ecommerce Price Monitoring Software Business (2020-2025)
Figure 79. Bottom-up and Top-down Approaches for This Report
Figure 80. Data Triangulation
Figure 81. Key Executives Interviewed