
Due to the COVID-19 pandemic, the global Robotics and Automation Actuators market size is estimated to be worth US$ 15500 million in 2022 and is forecast to a readjusted size of US$ 24730 million by 2028 with a CAGR of 8.1% during the review period.
<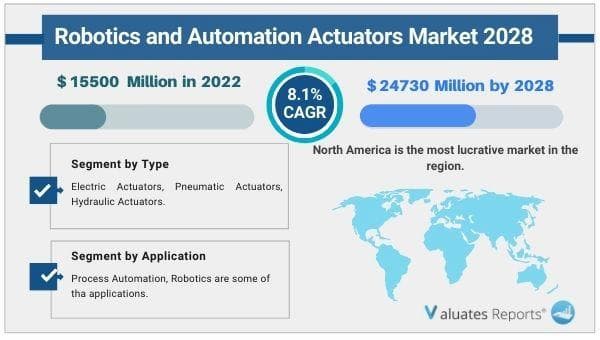
Fully considering the economic change by this health crisis, Electric Actuators accounting for % of the Robotics and Automation Actuators global market in 2021, is projected to value US$ million by 2028, growing at a revised % CAGR in the post-COVID-19 period. While Process Automation segment is altered to an % CAGR throughout this forecast period. A Robotics and Automation Actuator requires a control signal and a source of energy. The control signal is relatively low energy and may be electric voltage or current, pneumatic or hydraulic pressure, or even human power. Its main energy source may be an electric current, hydraulic fluid pressure, or pneumatic pressure. When it receives a control signal, an actuator responds by converting the signal's energy into mechanical motion. In terms of production side, this report researches the Robotics and Automation Actuators capacity, production, growth rate, market share by manufacturers and by region (region level and country level), from 2017 to 2022, and forecast to 2028. In terms of sales side, this report focuses on the sales of Robotics and Automation Actuators by region (region level and country level), by company, by Type and by Application. from 2017 to 2022 and forecast to 2028.
The authors of this research report have explored the key segments: Type and Application. The report offers an in-depth breakdown of type and application segments and their sub-segments. The lucrativeness and growth potential have been looked into by the industry experts in this report. This section of the report also provides sales and revenue forecast data by type and application segments based on sales, price, and revenue for the period 2017-2028. The specialists, to broaden the understanding of the users, have done value chain and raw material analysis in this section.
The authors of this study have enlightened the readers on the rise and effect of the Covid-19 outbreak on the development. They have investigated the changes brought about in the demand/supply side, consumption, supply chain, and production/manufacturing. The readers will get familiar with the measures that have helped the key players to bring the Robotics and Automation Actuators market back to the pre-covid levels.
In this segment of the report, the specialists have delved into the key growth opportunities that are likely to emerge. This will aid the key players to simplify complex issues related to business and framing future strategies to compete in this competitive environment. This section will certainly assist the players to boldly positioning their business.
In this section of the report, the researchers have done a comprehensive analysis of the prominent players operating and the strategies they are focusing on to combat the intense competition. Company profiles and share analysis of the prominent players are also provided in this section. They have also provided reliable sales and revenue data of the manufacturers for the period 2017-2022. With the assistance of this report, key players, stakeholders, and other participants will be able to stay abreast of the recent and upcoming developments in the business, further enabling them to make efficient choices.
|
Report Metric |
Details |
|
Report Name |
Robotics and Automation Actuators Market |
|
The market size in 2022 |
USD 15500 Million |
|
The revenue forecast in 2028 |
USD 24730 Million |
|
Growth Rate |
Compound Annual Growth Rate (CAGR) of 8.1% from 2022 to 2028 |
|
Market size available for years |
2022-2028 |
|
Forecast units |
Value (USD) |
|
Segments covered |
By Type, Application, and Region |
|
Report coverage |
Revenue & volume forecast, company share, competitive landscape, growth factors, and trends |
|
Geographic regions covered |
North America, Europe, Asia Pacific, Latin America, Middle East & Africa |
Ans. The global Robotics and Automation Actuators market size is estimated to be worth US$ 15500 million in 2022 and is forecast to a readjusted size of US$ 24730 million by 2028
2. What is the Robotics and Automation Actuators Market Growth?
Ans. The global Robotics and Automation Actuators market is expected to grow at a compound annual growth rate of 8.1% from 2022 to 2028.
Ans. Some of the major companies are Rotork, ABB, Auma, Flowserve, Emerson, Rockwell Automation, Moog, Curtiss Wright (Exlar), Altra Industrial Motion, SMC, Misumi Group, SKF, DVG Automation, Festo, Harmonic Drive, IAI, Nook Industries, Rotomation, Tolomatic, Venture Mfg, Cedrat Technologies, Kinitics Automation, Chuanyi Automation
Table of Contents
1 Study Coverage
1.1 Robotics and Automation Actuators Product Introduction
1.2 Market by Type
1.2.1 Global Robotics and Autaaomation Actuators Market Size by Type, 2017 VS 2021 VS 2028
1.2.2 Electric Actuators
1.2.3 Pneumatic Actuators
1.2.4 Hydraulic Actuators
1.3 Market by Application
1.3.1 Global Robotics and Automation Actuators Market Size by Application, 2017 VS 2021 VS 2028
1.3.2 Process Automation
1.3.3 Robotics
1.4 Study Objectives
1.5 Years Considered
2 Global Robotics and Automation Actuators Production
2.1 Global Robotics and Automation Actuators Production Capacity (2017-2028)
2.2 Global Robotics and Automation Actuators Production by Region: 2017 VS 2021 VS 2028
2.3 Global Robotics and Automation Actuators Production by Region
2.3.1 Global Robotics and Automation Actuators Historic Production by Region (2017-2022)
2.3.2 Global Robotics and Automation Actuators Forecasted Production by Region (2023-2028)
2.4 North America
2.5 Europe
2.6 China
2.7 Japan
3 Global Robotics and Automation Actuators Sales in Volume & Value Estimates and Forecasts
3.1 Global Robotics and Automation Actuators Sales Estimates and Forecasts 2017-2028
3.2 Global Robotics and Automation Actuators Revenue Estimates and Forecasts 2017-2028
3.3 Global Robotics and Automation Actuators Revenue by Region: 2017 VS 2021 VS 2028
3.4 Global Robotics and Automation Actuators Sales by Region
3.4.1 Global Robotics and Automation Actuators Sales by Region (2017-2022)
3.4.2 Global Sales Robotics and Automation Actuators by Region (2023-2028)
3.5 Global Robotics and Automation Actuators Revenue by Region
3.5.1 Global Robotics and Automation Actuators Revenue by Region (2017-2022)
3.5.2 Global Robotics and Automation Actuators Revenue by Region (2023-2028)
3.6 North America
3.7 Europe
3.8 Asia-Pacific
3.9 Latin America
3.10 Middle East & Africa
4 Competition by Manufactures
4.1 Global Robotics and Automation Actuators Production Capacity by Manufacturers
4.2 Global Robotics and Automation Actuators Sales by Manufacturers
4.2.1 Global Robotics and Automation Actuators Sales by Manufacturers (2017-2022)
4.2.2 Global Robotics and Automation Actuators Sales Market Share by Manufacturers (2017-2022)
4.2.3 Global Top 10 and Top 5 Largest Manufacturers of Robotics and Automation Actuators in 2021
4.3 Global Robotics and Automation Actuators Revenue by Manufacturers
4.3.1 Global Robotics and Automation Actuators Revenue by Manufacturers (2017-2022)
4.3.2 Global Robotics and Automation Actuators Revenue Market Share by Manufacturers (2017-2022)
4.3.3 Global Top 10 and Top 5 Companies by Robotics and Automation Actuators Revenue in 2021
4.4 Global Robotics and Automation Actuators Sales Price by Manufacturers
4.5 Analysis of Competitive Landscape
4.5.1 Manufacturers Market Concentration Ratio (CR5 and HHI)
4.5.2 Global Robotics and Automation Actuators Market Share by Company Type (Tier 1, Tier 2, and Tier 3)
4.5.3 Global Robotics and Automation Actuators Manufacturers Geographical Distribution
4.6 Mergers & Acquisitions, Expansion Plans
5 Market Size by Type
5.1 Global Robotics and Automation Actuators Sales by Type
5.1.1 Global Robotics and Automation Actuators Historical Sales by Type (2017-2022)
5.1.2 Global Robotics and Automation Actuators Forecasted Sales by Type (2023-2028)
5.1.3 Global Robotics and Automation Actuators Sales Market Share by Type (2017-2028)
5.2 Global Robotics and Automation Actuators Revenue by Type
5.2.1 Global Robotics and Automation Actuators Historical Revenue by Type (2017-2022)
5.2.2 Global Robotics and Automation Actuators Forecasted Revenue by Type (2023-2028)
5.2.3 Global Robotics and Automation Actuators Revenue Market Share by Type (2017-2028)
5.3 Global Robotics and Automation Actuators Price by Type
5.3.1 Global Robotics and Automation Actuators Price by Type (2017-2022)
5.3.2 Global Robotics and Automation Actuators Price Forecast by Type (2023-2028)
6 Market Size by Application
6.1 Global Robotics and Automation Actuators Sales by Application
6.1.1 Global Robotics and Automation Actuators Historical Sales by Application (2017-2022)
6.1.2 Global Robotics and Automation Actuators Forecasted Sales by Application (2023-2028)
6.1.3 Global Robotics and Automation Actuators Sales Market Share by Application (2017-2028)
6.2 Global Robotics and Automation Actuators Revenue by Application
6.2.1 Global Robotics and Automation Actuators Historical Revenue by Application (2017-2022)
6.2.2 Global Robotics and Automation Actuators Forecasted Revenue by Application (2023-2028)
6.2.3 Global Robotics and Automation Actuators Revenue Market Share by Application (2017-2028)
6.3 Global Robotics and Automation Actuators Price by Application
6.3.1 Global Robotics and Automation Actuators Price by Application (2017-2022)
6.3.2 Global Robotics and Automation Actuators Price Forecast by Application (2023-2028)
7 North America
7.1 North America Robotics and Automation Actuators Market Size by Type
7.1.1 North America Robotics and Automation Actuators Sales by Type (2017-2028)
7.1.2 North America Robotics and Automation Actuators Revenue by Type (2017-2028)
7.2 North America Robotics and Automation Actuators Market Size by Application
7.2.1 North America Robotics and Automation Actuators Sales by Application (2017-2028)
7.2.2 North America Robotics and Automation Actuators Revenue by Application (2017-2028)
7.3 North America Robotics and Automation Actuators Sales by Country
7.3.1 North America Robotics and Automation Actuators Sales by Country (2017-2028)
7.3.2 North America Robotics and Automation Actuators Revenue by Country (2017-2028)
7.3.3 U.S.
7.3.4 Canada
8 Europe
8.1 Europe Robotics and Automation Actuators Market Size by Type
8.1.1 Europe Robotics and Automation Actuators Sales by Type (2017-2028)
8.1.2 Europe Robotics and Automation Actuators Revenue by Type (2017-2028)
8.2 Europe Robotics and Automation Actuators Market Size by Application
8.2.1 Europe Robotics and Automation Actuators Sales by Application (2017-2028)
8.2.2 Europe Robotics and Automation Actuators Revenue by Application (2017-2028)
8.3 Europe Robotics and Automation Actuators Sales by Country
8.3.1 Europe Robotics and Automation Actuators Sales by Country (2017-2028)
8.3.2 Europe Robotics and Automation Actuators Revenue by Country (2017-2028)
8.3.3 Germany
8.3.4 France
8.3.5 U.K.
8.3.6 Italy
8.3.7 Russia
9 Asia Pacific
9.1 Asia Pacific Robotics and Automation Actuators Market Size by Type
9.1.1 Asia Pacific Robotics and Automation Actuators Sales by Type (2017-2028)
9.1.2 Asia Pacific Robotics and Automation Actuators Revenue by Type (2017-2028)
9.2 Asia Pacific Robotics and Automation Actuators Market Size by Application
9.2.1 Asia Pacific Robotics and Automation Actuators Sales by Application (2017-2028)
9.2.2 Asia Pacific Robotics and Automation Actuators Revenue by Application (2017-2028)
9.3 Asia Pacific Robotics and Automation Actuators Sales by Region
9.3.1 Asia Pacific Robotics and Automation Actuators Sales by Region (2017-2028)
9.3.2 Asia Pacific Robotics and Automation Actuators Revenue by Region (2017-2028)
9.3.3 China
9.3.4 Japan
9.3.5 South Korea
9.3.6 India
9.3.7 Australia
9.3.8 Taiwan
9.3.9 Indonesia
9.3.10 Thailand
9.3.11 Malaysia
9.3.12 Philippines
10 Latin America
10.1 Latin America Robotics and Automation Actuators Market Size by Type
10.1.1 Latin America Robotics and Automation Actuators Sales by Type (2017-2028)
10.1.2 Latin America Robotics and Automation Actuators Revenue by Type (2017-2028)
10.2 Latin America Robotics and Automation Actuators Market Size by Application
10.2.1 Latin America Robotics and Automation Actuators Sales by Application (2017-2028)
10.2.2 Latin America Robotics and Automation Actuators Revenue by Application (2017-2028)
10.3 Latin America Robotics and Automation Actuators Sales by Country
10.3.1 Latin America Robotics and Automation Actuators Sales by Country (2017-2028)
10.3.2 Latin America Robotics and Automation Actuators Revenue by Country (2017-2028)
10.3.3 Mexico
10.3.4 Brazil
10.3.5 Argentina
11 Middle East and Africa
11.1 Middle East and Africa Robotics and Automation Actuators Market Size by Type
11.1.1 Middle East and Africa Robotics and Automation Actuators Sales by Type (2017-2028)
11.1.2 Middle East and Africa Robotics and Automation Actuators Revenue by Type (2017-2028)
11.2 Middle East and Africa Robotics and Automation Actuators Market Size by Application
11.2.1 Middle East and Africa Robotics and Automation Actuators Sales by Application (2017-2028)
11.2.2 Middle East and Africa Robotics and Automation Actuators Revenue by Application (2017-2028)
11.3 Middle East and Africa Robotics and Automation Actuators Sales by Country
11.3.1 Middle East and Africa Robotics and Automation Actuators Sales by Country (2017-2028)
11.3.2 Middle East and Africa Robotics and Automation Actuators Revenue by Country (2017-2028)
11.3.3 Turkey
11.3.4 Saudi Arabia
11.3.5 U.A.E
12 Corporate Profiles
12.1 Rotork
12.1.1 Rotork Corporation Information
12.1.2 Rotork Overview
12.1.3 Rotork Robotics and Automation Actuators Sales, Price, Revenue and Gross Margin (2017-2022)
12.1.4 Rotork Robotics and Automation Actuators Product Model Numbers, Pictures, Descriptions and Specifications
12.1.5 Rotork Recent Developments
12.2 ABB
12.2.1 ABB Corporation Information
12.2.2 ABB Overview
12.2.3 ABB Robotics and Automation Actuators Sales, Price, Revenue and Gross Margin (2017-2022)
12.2.4 ABB Robotics and Automation Actuators Product Model Numbers, Pictures, Descriptions and Specifications
12.2.5 ABB Recent Developments
12.3 Auma
12.3.1 Auma Corporation Information
12.3.2 Auma Overview
12.3.3 Auma Robotics and Automation Actuators Sales, Price, Revenue and Gross Margin (2017-2022)
12.3.4 Auma Robotics and Automation Actuators Product Model Numbers, Pictures, Descriptions and Specifications
12.3.5 Auma Recent Developments
12.4 Flowserve
12.4.1 Flowserve Corporation Information
12.4.2 Flowserve Overview
12.4.3 Flowserve Robotics and Automation Actuators Sales, Price, Revenue and Gross Margin (2017-2022)
12.4.4 Flowserve Robotics and Automation Actuators Product Model Numbers, Pictures, Descriptions and Specifications
12.4.5 Flowserve Recent Developments
12.5 Emerson
12.5.1 Emerson Corporation Information
12.5.2 Emerson Overview
12.5.3 Emerson Robotics and Automation Actuators Sales, Price, Revenue and Gross Margin (2017-2022)
12.5.4 Emerson Robotics and Automation Actuators Product Model Numbers, Pictures, Descriptions and Specifications
12.5.5 Emerson Recent Developments
12.6 Rockwell Automation
12.6.1 Rockwell Automation Corporation Information
12.6.2 Rockwell Automation Overview
12.6.3 Rockwell Automation Robotics and Automation Actuators Sales, Price, Revenue and Gross Margin (2017-2022)
12.6.4 Rockwell Automation Robotics and Automation Actuators Product Model Numbers, Pictures, Descriptions and Specifications
12.6.5 Rockwell Automation Recent Developments
12.7 Moog
12.7.1 Moog Corporation Information
12.7.2 Moog Overview
12.7.3 Moog Robotics and Automation Actuators Sales, Price, Revenue and Gross Margin (2017-2022)
12.7.4 Moog Robotics and Automation Actuators Product Model Numbers, Pictures, Descriptions and Specifications
12.7.5 Moog Recent Developments
12.8 Curtiss Wright (Exlar)
12.8.1 Curtiss Wright (Exlar) Corporation Information
12.8.2 Curtiss Wright (Exlar) Overview
12.8.3 Curtiss Wright (Exlar) Robotics and Automation Actuators Sales, Price, Revenue and Gross Margin (2017-2022)
12.8.4 Curtiss Wright (Exlar) Robotics and Automation Actuators Product Model Numbers, Pictures, Descriptions and Specifications
12.8.5 Curtiss Wright (Exlar) Recent Developments
12.9 Altra Industrial Motion
12.9.1 Altra Industrial Motion Corporation Information
12.9.2 Altra Industrial Motion Overview
12.9.3 Altra Industrial Motion Robotics and Automation Actuators Sales, Price, Revenue and Gross Margin (2017-2022)
12.9.4 Altra Industrial Motion Robotics and Automation Actuators Product Model Numbers, Pictures, Descriptions and Specifications
12.9.5 Altra Industrial Motion Recent Developments
12.10 SMC
12.10.1 SMC Corporation Information
12.10.2 SMC Overview
12.10.3 SMC Robotics and Automation Actuators Sales, Price, Revenue and Gross Margin (2017-2022)
12.10.4 SMC Robotics and Automation Actuators Product Model Numbers, Pictures, Descriptions and Specifications
12.10.5 SMC Recent Developments
12.11 Misumi Group
12.11.1 Misumi Group Corporation Information
12.11.2 Misumi Group Overview
12.11.3 Misumi Group Robotics and Automation Actuators Sales, Price, Revenue and Gross Margin (2017-2022)
12.11.4 Misumi Group Robotics and Automation Actuators Product Model Numbers, Pictures, Descriptions and Specifications
12.11.5 Misumi Group Recent Developments
12.12 SKF
12.12.1 SKF Corporation Information
12.12.2 SKF Overview
12.12.3 SKF Robotics and Automation Actuators Sales, Price, Revenue and Gross Margin (2017-2022)
12.12.4 SKF Robotics and Automation Actuators Product Model Numbers, Pictures, Descriptions and Specifications
12.12.5 SKF Recent Developments
12.13 DVG Automation
12.13.1 DVG Automation Corporation Information
12.13.2 DVG Automation Overview
12.13.3 DVG Automation Robotics and Automation Actuators Sales, Price, Revenue and Gross Margin (2017-2022)
12.13.4 DVG Automation Robotics and Automation Actuators Product Model Numbers, Pictures, Descriptions and Specifications
12.13.5 DVG Automation Recent Developments
12.14 Festo
12.14.1 Festo Corporation Information
12.14.2 Festo Overview
12.14.3 Festo Robotics and Automation Actuators Sales, Price, Revenue and Gross Margin (2017-2022)
12.14.4 Festo Robotics and Automation Actuators Product Model Numbers, Pictures, Descriptions and Specifications
12.14.5 Festo Recent Developments
12.15 Harmonic Drive
12.15.1 Harmonic Drive Corporation Information
12.15.2 Harmonic Drive Overview
12.15.3 Harmonic Drive Robotics and Automation Actuators Sales, Price, Revenue and Gross Margin (2017-2022)
12.15.4 Harmonic Drive Robotics and Automation Actuators Product Model Numbers, Pictures, Descriptions and Specifications
12.15.5 Harmonic Drive Recent Developments
12.16 IAI
12.16.1 IAI Corporation Information
12.16.2 IAI Overview
12.16.3 IAI Robotics and Automation Actuators Sales, Price, Revenue and Gross Margin (2017-2022)
12.16.4 IAI Robotics and Automation Actuators Product Model Numbers, Pictures, Descriptions and Specifications
12.16.5 IAI Recent Developments
12.17 Nook Industries
12.17.1 Nook Industries Corporation Information
12.17.2 Nook Industries Overview
12.17.3 Nook Industries Robotics and Automation Actuators Sales, Price, Revenue and Gross Margin (2017-2022)
12.17.4 Nook Industries Robotics and Automation Actuators Product Model Numbers, Pictures, Descriptions and Specifications
12.17.5 Nook Industries Recent Developments
12.18 Rotomation
12.18.1 Rotomation Corporation Information
12.18.2 Rotomation Overview
12.18.3 Rotomation Robotics and Automation Actuators Sales, Price, Revenue and Gross Margin (2017-2022)
12.18.4 Rotomation Robotics and Automation Actuators Product Model Numbers, Pictures, Descriptions and Specifications
12.18.5 Rotomation Recent Developments
12.19 Tolomatic
12.19.1 Tolomatic Corporation Information
12.19.2 Tolomatic Overview
12.19.3 Tolomatic Robotics and Automation Actuators Sales, Price, Revenue and Gross Margin (2017-2022)
12.19.4 Tolomatic Robotics and Automation Actuators Product Model Numbers, Pictures, Descriptions and Specifications
12.19.5 Tolomatic Recent Developments
12.20 Venture Mfg
12.20.1 Venture Mfg Corporation Information
12.20.2 Venture Mfg Overview
12.20.3 Venture Mfg Robotics and Automation Actuators Sales, Price, Revenue and Gross Margin (2017-2022)
12.20.4 Venture Mfg Robotics and Automation Actuators Product Model Numbers, Pictures, Descriptions and Specifications
12.20.5 Venture Mfg Recent Developments
12.21 Cedrat Technologies
12.21.1 Cedrat Technologies Corporation Information
12.21.2 Cedrat Technologies Overview
12.21.3 Cedrat Technologies Robotics and Automation Actuators Sales, Price, Revenue and Gross Margin (2017-2022)
12.21.4 Cedrat Technologies Robotics and Automation Actuators Product Model Numbers, Pictures, Descriptions and Specifications
12.21.5 Cedrat Technologies Recent Developments
12.22 Kinitics Automation
12.22.1 Kinitics Automation Corporation Information
12.22.2 Kinitics Automation Overview
12.22.3 Kinitics Automation Robotics and Automation Actuators Sales, Price, Revenue and Gross Margin (2017-2022)
12.22.4 Kinitics Automation Robotics and Automation Actuators Product Model Numbers, Pictures, Descriptions and Specifications
12.22.5 Kinitics Automation Recent Developments
12.23 Chuanyi Automation
12.23.1 Chuanyi Automation Corporation Information
12.23.2 Chuanyi Automation Overview
12.23.3 Chuanyi Automation Robotics and Automation Actuators Sales, Price, Revenue and Gross Margin (2017-2022)
12.23.4 Chuanyi Automation Robotics and Automation Actuators Product Model Numbers, Pictures, Descriptions and Specifications
12.23.5 Chuanyi Automation Recent Developments
13 Industry Chain and Sales Channels Analysis
13.1 Robotics and Automation Actuators Industry Chain Analysis
13.2 Robotics and Automation Actuators Key Raw Materials
13.2.1 Key Raw Materials
13.2.2 Raw Materials Key Suppliers
13.3 Robotics and Automation Actuators Production Mode & Process
13.4 Robotics and Automation Actuators Sales and Marketing
13.4.1 Robotics and Automation Actuators Sales Channels
13.4.2 Robotics and Automation Actuators Distributors
13.5 Robotics and Automation Actuators Customers
14 Market Drivers, Opportunities, Challenges and Risks Factors Analysis
14.1 Robotics and Automation Actuators Industry Trends
14.2 Robotics and Automation Actuators Market Drivers
14.3 Robotics and Automation Actuators Market Challenges
14.4 Robotics and Automation Actuators Market Restraints
15 Key Finding in The Global Robotics and Automation Actuators Study
16 Appendix
16.1 Research Methodology
16.1.1 Methodology/Research Approach
16.1.2 Data Source
16.2 Author Details
16.3 Disclaimer
List of Tables
Table 1. Global Robotics and Automation Actuators Market Size Growth Rate by Type, 2017 VS 2021 VS 2028 (US$ Million)
Table 2. Major Manufacturers of Electric Actuators
Table 3. Major Manufacturers of Pneumatic Actuators
Table 4. Major Manufacturers of Hydraulic Actuators
Table 5. Global Robotics and Automation Actuators Market Size Growth Rate by Application, 2017 VS 2021 2028 (US$ Million)
Table 6. Global Robotics and Automation Actuators Production by Region: 2017 VS 2021 VS 2028 (K Units)
Table 7. Global Robotics and Automation Actuators Production by Region (2017-2022) & (K Units)
Table 8. Global Robotics and Automation Actuators Production Market Share by Region (2017-2022)
Table 9. Global Robotics and Automation Actuators Production by Region (2023-2028) & (K Units)
Table 10. Global Robotics and Automation Actuators Production Market Share by Region (2023-2028)
Table 11. Global Robotics and Automation Actuators Revenue by Region: 2017 VS 2021 VS 2028 (US$ Million)
Table 12. Global Robotics and Automation Actuators Sales by Region (2017-2022) & (K Units)
Table 13. Global Robotics and Automation Actuators Sales Market Share by Region (2017-2022)
Table 14. Global Robotics and Automation Actuators Sales by Region (2023-2028) & (K Units)
Table 15. Global Robotics and Automation Actuators Sales Market Share by Region (2023-2028)
Table 16. Global Robotics and Automation Actuators Revenue by Region (2017-2022) & (US$ Million)
Table 17. Global Robotics and Automation Actuators Revenue Market Share by Region (2017-2022)
Table 18. Global Robotics and Automation Actuators Revenue by Region (2023-2028) & (US$ Million)
Table 19. Global Robotics and Automation Actuators Revenue Market Share by Region (2023-2028)
Table 20. Global Robotics and Automation Actuators Production Capacity by Manufacturers (2017-2022) & (K Units)
Table 21. Global Robotics and Automation Actuators Capacity Market Share by Manufacturers (2017-2022)
Table 22. Global Robotics and Automation Actuators Sales by Manufacturers (2017-2022) & (K Units)
Table 23. Global Robotics and Automation Actuators Sales Market Share by Manufacturers (2017-2022)
Table 24. Global Robotics and Automation Actuators Revenue by Manufacturers (2017-2022) & (US$ Million)
Table 25. Global Robotics and Automation Actuators Revenue Share by Manufacturers (2017-2022)
Table 26. Robotics and Automation Actuators Price by Manufacturers 2017-2022 (USD/Unit)
Table 27. Global Robotics and Automation Actuators Manufacturers Market Concentration Ratio (CR5 and HHI)
Table 28. Global Robotics and Automation Actuators by Company Type (Tier 1, Tier 2, and Tier 3) & (based on the Revenue in Robotics and Automation Actuators as of 2021)
Table 29. Robotics and Automation Actuators Manufacturing Base Distribution and Headquarters
Table 30. Manufacturers Robotics and Automation Actuators Product Offered
Table 31. Date of Manufacturers Enter into Robotics and Automation Actuators Market
Table 32. Mergers & Acquisitions, Expansion Plans
Table 33. Global Robotics and Automation Actuators Sales by Type (2017-2022) & (K Units)
Table 34. Global Robotics and Automation Actuators Sales by Type (2023-2028) & (K Units)
Table 35. Global Robotics and Automation Actuators Sales Share by Type (2017-2022)
Table 36. Global Robotics and Automation Actuators Sales Share by Type (2023-2028)
Table 37. Global Robotics and Automation Actuators Revenue by Type (2017-2022) & (US$ Million)
Table 38. Global Robotics and Automation Actuators Revenue by Type (2023-2028) & (US$ Million)
Table 39. Global Robotics and Automation Actuators Revenue Share by Type (2017-2022)
Table 40. Global Robotics and Automation Actuators Revenue Share by Type (2023-2028)
Table 41. Robotics and Automation Actuators Price by Type (2017-2022) & (USD/Unit)
Table 42. Global Robotics and Automation Actuators Price Forecast by Type (2023-2028) & (USD/Unit)
Table 43. Global Robotics and Automation Actuators Sales by Application (2017-2022) & (K Units)
Table 44. Global Robotics and Automation Actuators Sales by Application (2023-2028) & (K Units)
Table 45. Global Robotics and Automation Actuators Sales Share by Application (2017-2022)
Table 46. Global Robotics and Automation Actuators Sales Share by Application (2023-2028)
Table 47. Global Robotics and Automation Actuators Revenue by Application (2017-2022) & (US$ Million)
Table 48. Global Robotics and Automation Actuators Revenue by Application (2023-2028) & (US$ Million)
Table 49. Global Robotics and Automation Actuators Revenue Share by Application (2017-2022)
Table 50. Global Robotics and Automation Actuators Revenue Share by Application (2023-2028)
Table 51. Robotics and Automation Actuators Price by Application (2017-2022) & (USD/Unit)
Table 52. Global Robotics and Automation Actuators Price Forecast by Application (2023-2028) & (USD/Unit)
Table 53. North America Robotics and Automation Actuators Sales by Type (2017-2022) & (K Units)
Table 54. North America Robotics and Automation Actuators Sales by Type (2023-2028) & (K Units)
Table 55. North America Robotics and Automation Actuators Revenue by Type (2017-2022) & (US$ Million)
Table 56. North America Robotics and Automation Actuators Revenue by Type (2023-2028) & (US$ Million)
Table 57. North America Robotics and Automation Actuators Sales by Application (2017-2022) & (K Units)
Table 58. North America Robotics and Automation Actuators Sales by Application (2023-2028) & (K Units)
Table 59. North America Robotics and Automation Actuators Revenue by Application (2017-2022) & (US$ Million)
Table 60. North America Robotics and Automation Actuators Revenue by Application (2023-2028) & (US$ Million)
Table 61. North America Robotics and Automation Actuators Sales by Country (2017-2022) & (K Units)
Table 62. North America Robotics and Automation Actuators Sales by Country (2023-2028) & (K Units)
Table 63. North America Robotics and Automation Actuators Revenue by Country (2017-2022) & (US$ Million)
Table 64. North America Robotics and Automation Actuators Revenue by Country (2023-2028) & (US$ Million)
Table 65. Europe Robotics and Automation Actuators Sales by Type (2017-2022) & (K Units)
Table 66. Europe Robotics and Automation Actuators Sales by Type (2023-2028) & (K Units)
Table 67. Europe Robotics and Automation Actuators Revenue by Type (2017-2022) & (US$ Million)
Table 68. Europe Robotics and Automation Actuators Revenue by Type (2023-2028) & (US$ Million)
Table 69. Europe Robotics and Automation Actuators Sales by Application (2017-2022) & (K Units)
Table 70. Europe Robotics and Automation Actuators Sales by Application (2023-2028) & (K Units)
Table 71. Europe Robotics and Automation Actuators Revenue by Application (2017-2022) & (US$ Million)
Table 72. Europe Robotics and Automation Actuators Revenue by Application (2023-2028) & (US$ Million)
Table 73. Europe Robotics and Automation Actuators Sales by Country (2017-2022) & (K Units)
Table 74. Europe Robotics and Automation Actuators Sales by Country (2023-2028) & (K Units)
Table 75. Europe Robotics and Automation Actuators Revenue by Country (2017-2022) & (US$ Million)
Table 76. Europe Robotics and Automation Actuators Revenue by Country (2023-2028) & (US$ Million)
Table 77. Asia Pacific Robotics and Automation Actuators Sales by Type (2017-2022) & (K Units)
Table 78. Asia Pacific Robotics and Automation Actuators Sales by Type (2023-2028) & (K Units)
Table 79. Asia Pacific Robotics and Automation Actuators Revenue by Type (2017-2022) & (US$ Million)
Table 80. Asia Pacific Robotics and Automation Actuators Revenue by Type (2023-2028) & (US$ Million)
Table 81. Asia Pacific Robotics and Automation Actuators Sales by Application (2017-2022) & (K Units)
Table 82. Asia Pacific Robotics and Automation Actuators Sales by Application (2023-2028) & (K Units)
Table 83. Asia Pacific Robotics and Automation Actuators Revenue by Application (2017-2022) & (US$ Million)
Table 84. Asia Pacific Robotics and Automation Actuators Revenue by Application (2023-2028) & (US$ Million)
Table 85. Asia Pacific Robotics and Automation Actuators Sales by Region (2017-2022) & (K Units)
Table 86. Asia Pacific Robotics and Automation Actuators Sales by Region (2023-2028) & (K Units)
Table 87. Asia Pacific Robotics and Automation Actuators Revenue by Region (2017-2022) & (US$ Million)
Table 88. Asia Pacific Robotics and Automation Actuators Revenue by Region (2023-2028) & (US$ Million)
Table 89. Latin America Robotics and Automation Actuators Sales by Type (2017-2022) & (K Units)
Table 90. Latin America Robotics and Automation Actuators Sales by Type (2023-2028) & (K Units)
Table 91. Latin America Robotics and Automation Actuators Revenue by Type (2017-2022) & (US$ Million)
Table 92. Latin America Robotics and Automation Actuators Revenue by Type (2023-2028) & (US$ Million)
Table 93. Latin America Robotics and Automation Actuators Sales by Application (2017-2022) & (K Units)
Table 94. Latin America Robotics and Automation Actuators Sales by Application (2023-2028) & (K Units)
Table 95. Latin America Robotics and Automation Actuators Revenue by Application (2017-2022) & (US$ Million)
Table 96. Latin America Robotics and Automation Actuators Revenue by Application (2023-2028) & (US$ Million)
Table 97. Latin America Robotics and Automation Actuators Sales by Country (2017-2022) & (K Units)
Table 98. Latin America Robotics and Automation Actuators Sales by Country (2023-2028) & (K Units)
Table 99. Latin America Robotics and Automation Actuators Revenue by Country (2017-2022) & (US$ Million)
Table 100. Latin America Robotics and Automation Actuators Revenue by Country (2023-2028) & (US$ Million)
Table 101. Middle East and Africa Robotics and Automation Actuators Sales by Type (2017-2022) & (K Units)
Table 102. Middle East and Africa Robotics and Automation Actuators Sales by Type (2023-2028) & (K Units)
Table 103. Middle East and Africa Robotics and Automation Actuators Revenue by Type (2017-2022) & (US$ Million)
Table 104. Middle East and Africa Robotics and Automation Actuators Revenue by Type (2023-2028) & (US$ Million)
Table 105. Middle East and Africa Robotics and Automation Actuators Sales by Application (2017-2022) & (K Units)
Table 106. Middle East and Africa Robotics and Automation Actuators Sales by Application (2023-2028) & (K Units)
Table 107. Middle East and Africa Robotics and Automation Actuators Revenue by Application (2017-2022) & (US$ Million)
Table 108. Middle East and Africa Robotics and Automation Actuators Revenue by Application (2023-2028) & (US$ Million)
Table 109. Middle East and Africa Robotics and Automation Actuators Sales by Country (2017-2022) & (K Units)
Table 110. Middle East and Africa Robotics and Automation Actuators Sales by Country (2023-2028) & (K Units)
Table 111. Middle East and Africa Robotics and Automation Actuators Revenue by Country (2017-2022) & (US$ Million)
Table 112. Middle East and Africa Robotics and Automation Actuators Revenue by Country (2023-2028) & (US$ Million)
Table 113. Rotork Corporation Information
Table 114. Rotork Description and Major Businesses
Table 115. Rotork Robotics and Automation Actuators Sales (K Units), Revenue (US$ Million), Price (USD/Unit) and Gross Margin (2017-2022)
Table 116. Rotork Robotics and Automation Actuators Product Model Numbers, Pictures, Descriptions and Specifications
Table 117. Rotork Recent Development
Table 118. ABB Corporation Information
Table 119. ABB Description and Major Businesses
Table 120. ABB Robotics and Automation Actuators Sales (K Units), Revenue (US$ Million), Price (USD/Unit) and Gross Margin (2017-2022)
Table 121. ABB Robotics and Automation Actuators Product Model Numbers, Pictures, Descriptions and Specifications
Table 122. ABB Recent Development
Table 123. Auma Corporation Information
Table 124. Auma Description and Major Businesses
Table 125. Auma Robotics and Automation Actuators Sales (K Units), Revenue (US$ Million), Price (USD/Unit) and Gross Margin (2017-2022)
Table 126. Auma Robotics and Automation Actuators Product Model Numbers, Pictures, Descriptions and Specifications
Table 127. Auma Recent Development
Table 128. Flowserve Corporation Information
Table 129. Flowserve Description and Major Businesses
Table 130. Flowserve Robotics and Automation Actuators Sales (K Units), Revenue (US$ Million), Price (USD/Unit) and Gross Margin (2017-2022)
Table 131. Flowserve Robotics and Automation Actuators Product Model Numbers, Pictures, Descriptions and Specifications
Table 132. Flowserve Recent Development
Table 133. Emerson Corporation Information
Table 134. Emerson Description and Major Businesses
Table 135. Emerson Robotics and Automation Actuators Sales (K Units), Revenue (US$ Million), Price (USD/Unit) and Gross Margin (2017-2022)
Table 136. Emerson Robotics and Automation Actuators Product Model Numbers, Pictures, Descriptions and Specifications
Table 137. Emerson Recent Development
Table 138. Rockwell Automation Corporation Information
Table 139. Rockwell Automation Description and Major Businesses
Table 140. Rockwell Automation Robotics and Automation Actuators Sales (K Units), Revenue (US$ Million), Price (USD/Unit) and Gross Margin (2017-2022)
Table 141. Rockwell Automation Robotics and Automation Actuators Product Model Numbers, Pictures, Descriptions and Specifications
Table 142. Rockwell Automation Recent Development
Table 143. Moog Corporation Information
Table 144. Moog Description and Major Businesses
Table 145. Moog Robotics and Automation Actuators Sales (K Units), Revenue (US$ Million), Price (USD/Unit) and Gross Margin (2017-2022)
Table 146. Moog Robotics and Automation Actuators Product Model Numbers, Pictures, Descriptions and Specifications
Table 147. Moog Recent Development
Table 148. Curtiss Wright (Exlar) Corporation Information
Table 149. Curtiss Wright (Exlar) Description and Major Businesses
Table 150. Curtiss Wright (Exlar) Robotics and Automation Actuators Sales (K Units), Revenue (US$ Million), Price (USD/Unit) and Gross Margin (2017-2022)
Table 151. Curtiss Wright (Exlar) Robotics and Automation Actuators Product Model Numbers, Pictures, Descriptions and Specifications
Table 152. Curtiss Wright (Exlar) Recent Development
Table 153. Altra Industrial Motion Corporation Information
Table 154. Altra Industrial Motion Description and Major Businesses
Table 155. Altra Industrial Motion Robotics and Automation Actuators Sales (K Units), Revenue (US$ Million), Price (USD/Unit) and Gross Margin (2017-2022)
Table 156. Altra Industrial Motion Robotics and Automation Actuators Product Model Numbers, Pictures, Descriptions and Specifications
Table 157. Altra Industrial Motion Recent Development
Table 158. SMC Corporation Information
Table 159. SMC Description and Major Businesses
Table 160. SMC Robotics and Automation Actuators Sales (K Units), Revenue (US$ Million), Price (USD/Unit) and Gross Margin (2017-2022)
Table 161. SMC Robotics and Automation Actuators Product Model Numbers, Pictures, Descriptions and Specifications
Table 162. SMC Recent Development
Table 163. Misumi Group Corporation Information
Table 164. Misumi Group Description and Major Businesses
Table 165. Misumi Group Robotics and Automation Actuators Sales (K Units), Revenue (US$ Million), Price (USD/Unit) and Gross Margin (2017-2022)
Table 166. Misumi Group Robotics and Automation Actuators Product Model Numbers, Pictures, Descriptions and Specifications
Table 167. Misumi Group Recent Development
Table 168. SKF Corporation Information
Table 169. SKF Description and Major Businesses
Table 170. SKF Robotics and Automation Actuators Sales (K Units), Revenue (US$ Million), Price (USD/Unit) and Gross Margin (2017-2022)
Table 171. SKF Robotics and Automation Actuators Product Model Numbers, Pictures, Descriptions and Specifications
Table 172. SKF Recent Development
Table 173. DVG Automation Corporation Information
Table 174. DVG Automation Description and Major Businesses
Table 175. DVG Automation Robotics and Automation Actuators Sales (K Units), Revenue (US$ Million), Price (USD/Unit) and Gross Margin (2017-2022)
Table 176. DVG Automation Robotics and Automation Actuators Product Model Numbers, Pictures, Descriptions and Specifications
Table 177. DVG Automation Recent Development
Table 178. Festo Corporation Information
Table 179. Festo Description and Major Businesses
Table 180. Festo Robotics and Automation Actuators Sales (K Units), Revenue (US$ Million), Price (USD/Unit) and Gross Margin (2017-2022)
Table 181. Festo Robotics and Automation Actuators Product Model Numbers, Pictures, Descriptions and Specifications
Table 182. Festo Recent Development
Table 183. Harmonic Drive Corporation Information
Table 184. Harmonic Drive Description and Major Businesses
Table 185. Harmonic Drive Robotics and Automation Actuators Sales (K Units), Revenue (US$ Million), Price (USD/Unit) and Gross Margin (2017-2022)
Table 186. Harmonic Drive Robotics and Automation Actuators Product Model Numbers, Pictures, Descriptions and Specifications
Table 187. Harmonic Drive Recent Development
Table 188. IAI Corporation Information
Table 189. IAI Description and Major Businesses
Table 190. IAI Robotics and Automation Actuators Sales (K Units), Revenue (US$ Million), Price (USD/Unit) and Gross Margin (2017-2022)
Table 191. IAI Robotics and Automation Actuators Product Model Numbers, Pictures, Descriptions and Specifications
Table 192. IAI Recent Development
Table 193. Nook Industries Corporation Information
Table 194. Nook Industries Description and Major Businesses
Table 195. Nook Industries Robotics and Automation Actuators Sales (K Units), Revenue (US$ Million), Price (USD/Unit) and Gross Margin (2017-2022)
Table 196. Nook Industries Robotics and Automation Actuators Product Model Numbers, Pictures, Descriptions and Specifications
Table 197. Nook Industries Recent Development
Table 198. Rotomation Corporation Information
Table 199. Rotomation Description and Major Businesses
Table 200. Rotomation Robotics and Automation Actuators Sales (K Units), Revenue (US$ Million), Price (USD/Unit) and Gross Margin (2017-2022)
Table 201. Rotomation Robotics and Automation Actuators Product Model Numbers, Pictures, Descriptions and Specifications
Table 202. Rotomation Recent Development
Table 203. Tolomatic Corporation Information
Table 204. Tolomatic Description and Major Businesses
Table 205. Tolomatic Robotics and Automation Actuators Sales (K Units), Revenue (US$ Million), Price (USD/Unit) and Gross Margin (2017-2022)
Table 206. Tolomatic Robotics and Automation Actuators Product Model Numbers, Pictures, Descriptions and Specifications
Table 207. Tolomatic Recent Development
Table 208. Venture Mfg Corporation Information
Table 209. Venture Mfg Description and Major Businesses
Table 210. Venture Mfg Robotics and Automation Actuators Sales (K Units), Revenue (US$ Million), Price (USD/Unit) and Gross Margin (2017-2022)
Table 211. Venture Mfg Robotics and Automation Actuators Product Model Numbers, Pictures, Descriptions and Specifications
Table 212. Venture Mfg Recent Development
Table 213. Cedrat Technologies Corporation Information
Table 214. Cedrat Technologies Description and Major Businesses
Table 215. Cedrat Technologies Robotics and Automation Actuators Sales (K Units), Revenue (US$ Million), Price (USD/Unit) and Gross Margin (2017-2022)
Table 216. Cedrat Technologies Robotics and Automation Actuators Product Model Numbers, Pictures, Descriptions and Specifications
Table 217. Cedrat Technologies Recent Development
Table 218. Kinitics Automation Corporation Information
Table 219. Kinitics Automation Description and Major Businesses
Table 220. Kinitics Automation Robotics and Automation Actuators Sales (K Units), Revenue (US$ Million), Price (USD/Unit) and Gross Margin (2017-2022)
Table 221. Kinitics Automation Robotics and Automation Actuators Product Model Numbers, Pictures, Descriptions and Specifications
Table 222. Kinitics Automation Recent Development
Table 223. Chuanyi Automation Corporation Information
Table 224. Chuanyi Automation Description and Major Businesses
Table 225. Chuanyi Automation Robotics and Automation Actuators Sales (K Units), Revenue (US$ Million), Price (USD/Unit) and Gross Margin (2017-2022)
Table 226. Chuanyi Automation Robotics and Automation Actuators Product Model Numbers, Pictures, Descriptions and Specifications
Table 227. Chuanyi Automation Recent Development
Table 228. Key Raw Materials Lists
Table 229. Raw Materials Key Suppliers Lists
Table 230. Robotics and Automation Actuators Distributors List
Table 231. Robotics and Automation Actuators Customers List
Table 232. Robotics and Automation Actuators Market Trends
Table 233. Robotics and Automation Actuators Market Drivers
Table 234. Robotics and Automation Actuators Market Challenges
Table 235. Robotics and Automation Actuators Market Restraints
Table 236. Research Programs/Design for This Report
Table 237. Key Data Information from Secondary Sources
Table 238. Key Data Information from Primary Sources
List of Figures
Figure 1. Robotics and Automation Actuators Product Picture
Figure 2. Global Robotics and Automation Actuators Market Share by Type in 2021 & 2028
Figure 3. Electric Actuators Product Picture
Figure 4. Pneumatic Actuators Product Picture
Figure 5. Hydraulic Actuators Product Picture
Figure 6. Global Robotics and Automation Actuators Market Share by Application in 2021 & 2028
Figure 7. Process Automation
Figure 8. Robotics
Figure 9. Robotics and Automation Actuators Report Years Considered
Figure 10. Global Robotics and Automation Actuators Capacity, Production and Utilization (2017-2028) & (K Units)
Figure 11. Global Robotics and Automation Actuators Production Market Share by Region in Percentage: 2021 Versus 2028
Figure 12. Global Robotics and Automation Actuators Production Market Share by Region (2017-2022)
Figure 13. Global Robotics and Automation Actuators Production Market Share by Region (2023-2028)
Figure 14. Robotics and Automation Actuators Production Growth Rate in North America (2017-2028) & (K Units)
Figure 15. Robotics and Automation Actuators Production Growth Rate in Europe (2017-2028) & (K Units)
Figure 16. Robotics and Automation Actuators Production Growth Rate in China (2017-2028) & (K Units)
Figure 17. Robotics and Automation Actuators Production Growth Rate in Japan (2017-2028) & (K Units)
Figure 18. Global Robotics and Automation Actuators Sales 2017-2028 (K Units)
Figure 19. Global Robotics and Automation Actuators Revenue, (US$ Million), 2017 VS 2021 VS 2028
Figure 20. Global Robotics and Automation Actuators Revenue 2017-2028 (US$ Million)
Figure 21. Global Robotics and Automation Actuators Revenue Market Share by Region in Percentage: 2021 Versus 2028
Figure 22. Global Robotics and Automation Actuators Sales Market Share by Region (2017-2022)
Figure 23. Global Robotics and Automation Actuators Sales Market Share by Region (2023-2028)
Figure 24. North America Robotics and Automation Actuators Sales YoY (2017-2028) & (K Units)
Figure 25. North America Robotics and Automation Actuators Revenue YoY (2017-2028) & (US$ Million)
Figure 26. Europe Robotics and Automation Actuators Sales YoY (2017-2028) & (K Units)
Figure 27. Europe Robotics and Automation Actuators Revenue YoY (2017-2028) & (US$ Million)
Figure 28. Asia-Pacific Robotics and Automation Actuators Sales YoY (2017-2028) & (K Units)
Figure 29. Asia-Pacific Robotics and Automation Actuators Revenue YoY (2017-2028) & (US$ Million)
Figure 30. Latin America Robotics and Automation Actuators Sales YoY (2017-2028) & (K Units)
Figure 31. Latin America Robotics and Automation Actuators Revenue YoY (2017-2028) & (US$ Million)
Figure 32. Middle East & Africa Robotics and Automation Actuators Sales YoY (2017-2028) & (K Units)
Figure 33. Middle East & Africa Robotics and Automation Actuators Revenue YoY (2017-2028) & (US$ Million)
Figure 34. The Robotics and Automation Actuators Market Share of Top 10 and Top 5 Largest Manufacturers Around the World in 2021
Figure 35. The Top 5 and 10 Largest Manufacturers of Robotics and Automation Actuators in the World: Market Share by Robotics and Automation Actuators Revenue in 2021
Figure 36. Robotics and Automation Actuators Market Share by Company Type (Tier 1, Tier 2, and Tier 3): 2017 VS 2021
Figure 37. Global Robotics and Automation Actuators Sales Market Share by Type (2017-2028)
Figure 38. Global Robotics and Automation Actuators Revenue Market Share by Type (2017-2028)
Figure 39. Global Robotics and Automation Actuators Sales Market Share by Application (2017-2028)
Figure 40. Global Robotics and Automation Actuators Revenue Market Share by Application (2017-2028)
Figure 41. North America Robotics and Automation Actuators Sales Market Share by Type (2017-2028)
Figure 42. North America Robotics and Automation Actuators Revenue Market Share by Type (2017-2028)
Figure 43. North America Robotics and Automation Actuators Sales Market Share by Application (2017-2028)
Figure 44. North America Robotics and Automation Actuators Revenue Market Share by Application (2017-2028)
Figure 45. North America Robotics and Automation Actuators Sales Share by Country (2017-2028)
Figure 46. North America Robotics and Automation Actuators Revenue Share by Country (2017-2028)
Figure 47. U.S. Robotics and Automation Actuators Revenue (2017-2028) & (US$ Million)
Figure 48. Canada Robotics and Automation Actuators Revenue (2017-2028) & (US$ Million)
Figure 49. Europe Robotics and Automation Actuators Sales Market Share by Type (2017-2028)
Figure 50. Europe Robotics and Automation Actuators Revenue Market Share by Type (2017-2028)
Figure 51. Europe Robotics and Automation Actuators Sales Market Share by Application (2017-2028)
Figure 52. Europe Robotics and Automation Actuators Revenue Market Share by Application (2017-2028)
Figure 53. Europe Robotics and Automation Actuators Sales Share by Country (2017-2028)
Figure 54. Europe Robotics and Automation Actuators Revenue Share by Country (2017-2028)
Figure 55. Germany Robotics and Automation Actuators Revenue (2017-2028) & (US$ Million)
Figure 56. France Robotics and Automation Actuators Revenue (2017-2028) & (US$ Million)
Figure 57. U.K. Robotics and Automation Actuators Revenue (2017-2028) & (US$ Million)
Figure 58. Italy Robotics and Automation Actuators Revenue (2017-2028) & (US$ Million)
Figure 59. Russia Robotics and Automation Actuators Revenue (2017-2028) & (US$ Million)
Figure 60. Asia Pacific Robotics and Automation Actuators Sales Market Share by Type (2017-2028)
Figure 61. Asia Pacific Robotics and Automation Actuators Revenue Market Share by Type (2017-2028)
Figure 62. Asia Pacific Robotics and Automation Actuators Sales Market Share by Application (2017-2028)
Figure 63. Asia Pacific Robotics and Automation Actuators Revenue Market Share by Application (2017-2028)
Figure 64. Asia Pacific Robotics and Automation Actuators Sales Share by Region (2017-2028)
Figure 65. Asia Pacific Robotics and Automation Actuators Revenue Share by Region (2017-2028)
Figure 66. China Robotics and Automation Actuators Revenue (2017-2028) & (US$ Million)
Figure 67. Japan Robotics and Automation Actuators Revenue (2017-2028) & (US$ Million)
Figure 68. South Korea Robotics and Automation Actuators Revenue (2017-2028) & (US$ Million)
Figure 69. India Robotics and Automation Actuators Revenue (2017-2028) & (US$ Million)
Figure 70. Australia Robotics and Automation Actuators Revenue (2017-2028) & (US$ Million)
Figure 71. Taiwan Robotics and Automation Actuators Revenue (2017-2028) & (US$ Million)
Figure 72. Indonesia Robotics and Automation Actuators Revenue (2017-2028) & (US$ Million)
Figure 73. Thailand Robotics and Automation Actuators Revenue (2017-2028) & (US$ Million)
Figure 74. Malaysia Robotics and Automation Actuators Revenue (2017-2028) & (US$ Million)
Figure 75. Philippines Robotics and Automation Actuators Revenue (2017-2028) & (US$ Million)
Figure 76. Latin America Robotics and Automation Actuators Sales Market Share by Type (2017-2028)
Figure 77. Latin America Robotics and Automation Actuators Revenue Market Share by Type (2017-2028)
Figure 78. Latin America Robotics and Automation Actuators Sales Market Share by Application (2017-2028)
Figure 79. Latin America Robotics and Automation Actuators Revenue Market Share by Application (2017-2028)
Figure 80. Latin America Robotics and Automation Actuators Sales Share by Country (2017-2028)
Figure 81. Latin America Robotics and Automation Actuators Revenue Share by Country (2017-2028)
Figure 82. Mexico Robotics and Automation Actuators Revenue (2017-2028) & (US$ Million)
Figure 83. Brazil Robotics and Automation Actuators Revenue (2017-2028) & (US$ Million)
Figure 84. Argentina Robotics and Automation Actuators Revenue (2017-2028) & (US$ Million)
Figure 85. Middle East and Africa Robotics and Automation Actuators Sales Market Share by Type (2017-2028)
Figure 86. Middle East and Africa Robotics and Automation Actuators Revenue Market Share by Type (2017-2028)
Figure 87. Middle East and Africa Robotics and Automation Actuators Sales Market Share by Application (2017-2028)
$4900
$9800
HAVE A QUERY?
OUR CUSTOMER
