1 Market Overview
1.1 Thermal Field Carbon Carbon Composite Product Introduction
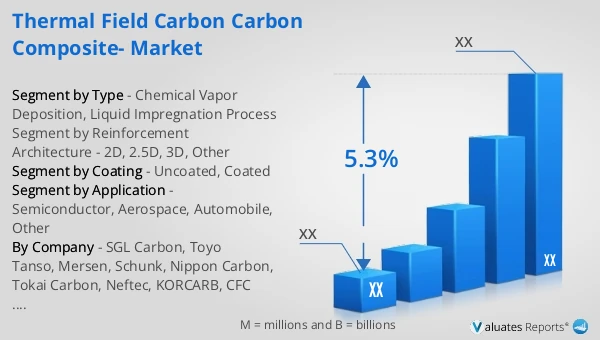
1.2 Global Thermal Field Carbon Carbon Composite Market Size Forecast
1.2.1 Global Thermal Field Carbon Carbon Composite Sales Value (2021–2032)
1.2.2 Global Thermal Field Carbon Carbon Composite Sales Volume (2021–2032)
1.2.3 Global Thermal Field Carbon Carbon Composite Sales Price (2021–2032)
1.3 Thermal Field Carbon Carbon Composite Market Trends & Drivers
1.3.1 Thermal Field Carbon Carbon Composite Industry Trends
1.3.2 Thermal Field Carbon Carbon Composite Market Drivers & Opportunities
1.3.3 Thermal Field Carbon Carbon Composite Market Challenges
1.3.4 Thermal Field Carbon Carbon Composite Market Restraints
1.3.5 Impact of U.S. Tariffs
1.4 Assumptions and Limitations
1.5 Study Objectives
1.6 Years Considered
2 Competitive Analysis by Company
2.1 Global Thermal Field Carbon Carbon Composite Players Revenue Ranking (2025)
2.2 Global Thermal Field Carbon Carbon Composite Revenue by Company (2021–2026)
2.3 Global Thermal Field Carbon Carbon Composite Sales Volume Ranking of Players (2025)
2.4 Global Thermal Field Carbon Carbon Composite Sales Volume by Company (2021–2026)
2.5 Global Thermal Field Carbon Carbon Composite Average Price by Company (2021–2026)
2.6 Key Manufacturers Thermal Field Carbon Carbon Composite Manufacturing Base and Headquarters
2.7 Key Manufacturers Thermal Field Carbon Carbon Composite Product Offerings
2.8 Key Manufacturers Start of Mass Production of Thermal Field Carbon Carbon Composite
2.9 Thermal Field Carbon Carbon Composite Market Competitive Analysis
2.9.1 Thermal Field Carbon Carbon Composite Market Concentration Rate (2021–2026)
2.9.2 Global 5 and 10 Largest Manufacturers by Thermal Field Carbon Carbon Composite Revenue in 2025
2.9.3 Global Companies by Tier (Tier 1, Tier 2, Tier 3), based on Thermal Field Carbon Carbon Composite revenue, 2025
2.10 Mergers & Acquisitions and Expansion
3 Segmentation Thermal Field Carbon Carbon Composite Market Classification
3.1 Introduction by Type
3.1.1 Chemical Vapor Deposition
3.1.2 Liquid Impregnation Process
3.1.3 Global Thermal Field Carbon Carbon Composite Sales Value by Type
3.1.3.1 Global Thermal Field Carbon Carbon Composite Sales Value by Type (2021 vs 2025 vs 2032)
3.1.3.2 Global Thermal Field Carbon Carbon Composite Sales Value, by Type (2021–2032)
3.1.3.3 Global Thermal Field Carbon Carbon Composite Sales Value, by Type (%), 2021–2032
3.1.4 Global Thermal Field Carbon Carbon Composite Sales Volume by Type
3.1.4.1 Global Thermal Field Carbon Carbon Composite Sales Volume by Type (2021 vs 2025 vs 2032)
3.1.4.2 Global Thermal Field Carbon Carbon Composite Sales Volume, by Type (2021–2032)
3.1.4.3 Global Thermal Field Carbon Carbon Composite Sales Volume, by Type (%), 2021–2032
3.1.5 Global Thermal Field Carbon Carbon Composite Average Price by Type (2021–2032)
3.2 Introduction by Reinforcement Architecture
3.2.1 2D
3.2.2 2.5D
3.2.3 3D
3.2.4 Other
3.2.5 Global Thermal Field Carbon Carbon Composite Sales Value by Reinforcement Architecture
3.2.5.1 Global Thermal Field Carbon Carbon Composite Sales Value by Reinforcement Architecture (2021 vs 2025 vs 2032)
3.2.5.2 Global Thermal Field Carbon Carbon Composite Sales Value, by Reinforcement Architecture (2021–2032)
3.2.5.3 Global Thermal Field Carbon Carbon Composite Sales Value, by Reinforcement Architecture (%), 2021–2032
3.2.6 Global Thermal Field Carbon Carbon Composite Sales Volume by Reinforcement Architecture
3.2.6.1 Global Thermal Field Carbon Carbon Composite Sales Volume by Reinforcement Architecture (2021 vs 2025 vs 2032)
3.2.6.2 Global Thermal Field Carbon Carbon Composite Sales Volume, by Reinforcement Architecture (2021–2032)
3.2.6.3 Global Thermal Field Carbon Carbon Composite Sales Volume, by Reinforcement Architecture (%), 2021–2032
3.2.7 Global Thermal Field Carbon Carbon Composite Average Price by Reinforcement Architecture (2021–2032)
3.3 Introduction by Coating
3.3.1 Uncoated
3.3.2 Coated
3.3.3 Global Thermal Field Carbon Carbon Composite Sales Value by Coating
3.3.3.1 Global Thermal Field Carbon Carbon Composite Sales Value by Coating (2021 vs 2025 vs 2032)
3.3.3.2 Global Thermal Field Carbon Carbon Composite Sales Value, by Coating (2021–2032)
3.3.3.3 Global Thermal Field Carbon Carbon Composite Sales Value, by Coating (%), 2021–2032
3.3.4 Global Thermal Field Carbon Carbon Composite Sales Volume by Coating
3.3.4.1 Global Thermal Field Carbon Carbon Composite Sales Volume by Coating (2021 vs 2025 vs 2032)
3.3.4.2 Global Thermal Field Carbon Carbon Composite Sales Volume, by Coating (2021–2032)
3.3.4.3 Global Thermal Field Carbon Carbon Composite Sales Volume, by Coating (%), 2021–2032
3.3.5 Global Thermal Field Carbon Carbon Composite Average Price by Coating (2021–2032)
4 Segmentation by Application
4.1 Introduction by Application
4.1.1 Semiconductor
4.1.2 Aerospace
4.1.3 Automobile
4.1.4 Other
4.2 Global Thermal Field Carbon Carbon Composite Sales Value by Application
4.2.1 Global Thermal Field Carbon Carbon Composite Sales Value by Application (2021 vs 2025 vs 2032)
4.2.2 Global Thermal Field Carbon Carbon Composite Sales Value, by Application (2021–2032)
4.2.3 Global Thermal Field Carbon Carbon Composite Sales Value, by Application (%), 2021–2032
4.3 Global Thermal Field Carbon Carbon Composite Sales Volume by Application
4.3.1 Global Thermal Field Carbon Carbon Composite Sales Volume by Application (2021 vs 2025 vs 2032)
4.3.2 Global Thermal Field Carbon Carbon Composite Sales Volume, by Application (2021–2032)
4.3.3 Global Thermal Field Carbon Carbon Composite Sales Volume, by Application (%), 2021–2032
4.4 Global Thermal Field Carbon Carbon Composite Average Price by Application (2021–2032)
5 Segmentation by Region
5.1 Global Thermal Field Carbon Carbon Composite Sales Value by Region
5.1.1 Global Thermal Field Carbon Carbon Composite Sales Value by Region: 2021 vs 2025 vs 2032
5.1.2 Global Thermal Field Carbon Carbon Composite Sales Value by Region (2021–2026)
5.1.3 Global Thermal Field Carbon Carbon Composite Sales Value by Region (2027–2032)
5.1.4 Global Thermal Field Carbon Carbon Composite Sales Value by Region (%), 2021–2032
5.2 Global Thermal Field Carbon Carbon Composite Sales Volume by Region
5.2.1 Global Thermal Field Carbon Carbon Composite Sales Volume by Region: 2021 vs 2025 vs 2032
5.2.2 Global Thermal Field Carbon Carbon Composite Sales Volume by Region (2021–2026)
5.2.3 Global Thermal Field Carbon Carbon Composite Sales Volume by Region (2027–2032)
5.2.4 Global Thermal Field Carbon Carbon Composite Sales Volume by Region (%), 2021–2032
5.3 Global Thermal Field Carbon Carbon Composite Average Price by Region (2021–2032)
5.4 North America
5.4.1 North America Thermal Field Carbon Carbon Composite Sales Value, 2021–2032
5.4.2 North America Thermal Field Carbon Carbon Composite Sales Value by Country (%), 2025 vs 2032
5.5 Europe
5.5.1 Europe Thermal Field Carbon Carbon Composite Sales Value, 2021–2032
5.5.2 Europe Thermal Field Carbon Carbon Composite Sales Value by Country (%), 2025 vs 2032
5.6 Asia Pacific
5.6.1 Asia Pacific Thermal Field Carbon Carbon Composite Sales Value, 2021–2032
5.6.2 Asia Pacific Thermal Field Carbon Carbon Composite Sales Value by Region (%), 2025 vs 2032
5.7 South America
5.7.1 South America Thermal Field Carbon Carbon Composite Sales Value, 2021–2032
5.7.2 South America Thermal Field Carbon Carbon Composite Sales Value by Country (%), 2025 vs 2032
5.8 Middle East & Africa
5.8.1 Middle East & Africa Thermal Field Carbon Carbon Composite Sales Value, 2021–2032
5.8.2 Middle East & Africa Thermal Field Carbon Carbon Composite Sales Value by Country (%), 2025 vs 2032
6 Segmentation by Key Countries/Regions
6.1 Key Countries/Regions Thermal Field Carbon Carbon Composite Sales Value Growth Trends, 2021 vs 2025 vs 2032
6.2 Key Countries/Regions Thermal Field Carbon Carbon Composite Sales Value and Sales Volume
6.2.1 Key Countries/Regions Thermal Field Carbon Carbon Composite Sales Value, 2021–2032
6.2.2 Key Countries/Regions Thermal Field Carbon Carbon Composite Sales Volume, 2021–2032
6.3 United States
6.3.1 United States Thermal Field Carbon Carbon Composite Sales Value, 2021–2032
6.3.2 United States Thermal Field Carbon Carbon Composite Sales Value by Type (%), 2025 vs 2032
6.3.3 United States Thermal Field Carbon Carbon Composite Sales Value by Application, 2025 vs 2032
6.4 Europe
6.4.1 Europe Thermal Field Carbon Carbon Composite Sales Value, 2021–2032
6.4.2 Europe Thermal Field Carbon Carbon Composite Sales Value by Type (%), 2025 vs 2032
6.4.3 Europe Thermal Field Carbon Carbon Composite Sales Value by Application, 2025 vs 2032
6.5 China
6.5.1 China Thermal Field Carbon Carbon Composite Sales Value, 2021–2032
6.5.2 China Thermal Field Carbon Carbon Composite Sales Value by Type (%), 2025 vs 2032
6.5.3 China Thermal Field Carbon Carbon Composite Sales Value by Application, 2025 vs 2032
6.6 Japan
6.6.1 Japan Thermal Field Carbon Carbon Composite Sales Value, 2021–2032
6.6.2 Japan Thermal Field Carbon Carbon Composite Sales Value by Type (%), 2025 vs 2032
6.6.3 Japan Thermal Field Carbon Carbon Composite Sales Value by Application, 2025 vs 2032
6.7 South Korea
6.7.1 South Korea Thermal Field Carbon Carbon Composite Sales Value, 2021–2032
6.7.2 South Korea Thermal Field Carbon Carbon Composite Sales Value by Type (%), 2025 vs 2032
6.7.3 South Korea Thermal Field Carbon Carbon Composite Sales Value by Application, 2025 vs 2032
6.8 Southeast Asia
6.8.1 Southeast Asia Thermal Field Carbon Carbon Composite Sales Value, 2021–2032
6.8.2 Southeast Asia Thermal Field Carbon Carbon Composite Sales Value by Type (%), 2025 vs 2032
6.8.3 Southeast Asia Thermal Field Carbon Carbon Composite Sales Value by Application, 2025 vs 2032
6.9 India
6.9.1 India Thermal Field Carbon Carbon Composite Sales Value, 2021–2032
6.9.2 India Thermal Field Carbon Carbon Composite Sales Value by Type (%), 2025 vs 2032
6.9.3 India Thermal Field Carbon Carbon Composite Sales Value by Application, 2025 vs 2032
7 Company Profiles
7.1 SGL Carbon
7.1.1 SGL Carbon Company Information
7.1.2 SGL Carbon Introduction and Business Overview
7.1.3 SGL Carbon Thermal Field Carbon Carbon Composite Sales, Revenue, Price and Gross Margin (2021–2026)
7.1.4 SGL Carbon Thermal Field Carbon Carbon Composite Product Offerings
7.1.5 SGL Carbon Recent Developments
7.2 Toyo Tanso
7.2.1 Toyo Tanso Company Information
7.2.2 Toyo Tanso Introduction and Business Overview
7.2.3 Toyo Tanso Thermal Field Carbon Carbon Composite Sales, Revenue, Price and Gross Margin (2021–2026)
7.2.4 Toyo Tanso Thermal Field Carbon Carbon Composite Product Offerings
7.2.5 Toyo Tanso Recent Developments
7.3 Mersen
7.3.1 Mersen Company Information
7.3.2 Mersen Introduction and Business Overview
7.3.3 Mersen Thermal Field Carbon Carbon Composite Sales, Revenue, Price and Gross Margin (2021–2026)
7.3.4 Mersen Thermal Field Carbon Carbon Composite Product Offerings
7.3.5 Mersen Recent Developments
7.4 Schunk
7.4.1 Schunk Company Information
7.4.2 Schunk Introduction and Business Overview
7.4.3 Schunk Thermal Field Carbon Carbon Composite Sales, Revenue, Price and Gross Margin (2021–2026)
7.4.4 Schunk Thermal Field Carbon Carbon Composite Product Offerings
7.4.5 Schunk Recent Developments
7.5 Nippon Carbon
7.5.1 Nippon Carbon Company Information
7.5.2 Nippon Carbon Introduction and Business Overview
7.5.3 Nippon Carbon Thermal Field Carbon Carbon Composite Sales, Revenue, Price and Gross Margin (2021–2026)
7.5.4 Nippon Carbon Thermal Field Carbon Carbon Composite Product Offerings
7.5.5 Nippon Carbon Recent Developments
7.6 Tokai Carbon
7.6.1 Tokai Carbon Company Information
7.6.2 Tokai Carbon Introduction and Business Overview
7.6.3 Tokai Carbon Thermal Field Carbon Carbon Composite Sales, Revenue, Price and Gross Margin (2021–2026)
7.6.4 Tokai Carbon Thermal Field Carbon Carbon Composite Product Offerings
7.6.5 Tokai Carbon Recent Developments
7.7 Neftec
7.7.1 Neftec Company Information
7.7.2 Neftec Introduction and Business Overview
7.7.3 Neftec Thermal Field Carbon Carbon Composite Sales, Revenue, Price and Gross Margin (2021–2026)
7.7.4 Neftec Thermal Field Carbon Carbon Composite Product Offerings
7.7.5 Neftec Recent Developments
7.8 KORCARB
7.8.1 KORCARB Company Information
7.8.2 KORCARB Introduction and Business Overview
7.8.3 KORCARB Thermal Field Carbon Carbon Composite Sales, Revenue, Price and Gross Margin (2021–2026)
7.8.4 KORCARB Thermal Field Carbon Carbon Composite Product Offerings
7.8.5 KORCARB Recent Developments
7.9 CFC DESIGN
7.9.1 CFC DESIGN Company Information
7.9.2 CFC DESIGN Introduction and Business Overview
7.9.3 CFC DESIGN Thermal Field Carbon Carbon Composite Sales, Revenue, Price and Gross Margin (2021–2026)
7.9.4 CFC DESIGN Thermal Field Carbon Carbon Composite Product Offerings
7.9.5 CFC DESIGN Recent Developments
7.10 Shaanxi Zhongtian Rocket Technology
7.10.1 Shaanxi Zhongtian Rocket Technology Company Information
7.10.2 Shaanxi Zhongtian Rocket Technology Introduction and Business Overview
7.10.3 Shaanxi Zhongtian Rocket Technology Thermal Field Carbon Carbon Composite Sales, Revenue, Price and Gross Margin (2021–2026)
7.10.4 Shaanxi Zhongtian Rocket Technology Thermal Field Carbon Carbon Composite Product Offerings
7.10.5 Shaanxi Zhongtian Rocket Technology Recent Developments
7.11 KBC
7.11.1 KBC Company Information
7.11.2 KBC Introduction and Business Overview
7.11.3 KBC Thermal Field Carbon Carbon Composite Sales, Revenue, Price and Gross Margin (2021–2026)
7.11.4 KBC Thermal Field Carbon Carbon Composite Product Offerings
7.11.5 KBC Recent Developments
8 Industry Chain Analysis
8.1 Thermal Field Carbon Carbon Composite Industrial Chain
8.2 Thermal Field Carbon Carbon Composite Upstream Analysis
8.2.1 Key Raw Materials
8.2.2 Key Suppliers of Raw Materials
8.2.3 Manufacturing Cost Structure
8.3 Midstream Analysis
8.4 Downstream Analysis (Customer Analysis)
8.5 Sales Model and Sales Channelss
8.5.1 Thermal Field Carbon Carbon Composite Sales Model
8.5.2 Sales Channels
8.5.3 Thermal Field Carbon Carbon Composite Distributors
9 Research Findings and Conclusion
10 Appendix
10.1 Research Methodology
10.1.1 Methodology/Research Approach
10.1.1.1 Research Programs/Design
10.1.1.2 Market Size Estimation
10.1.1.3 Market Breakdown and Data Triangulation
10.1.2 Data Source
10.1.2.1 Secondary Sources
10.1.2.2 Primary Sources
10.2 Author Details
10.3 Disclaimer