
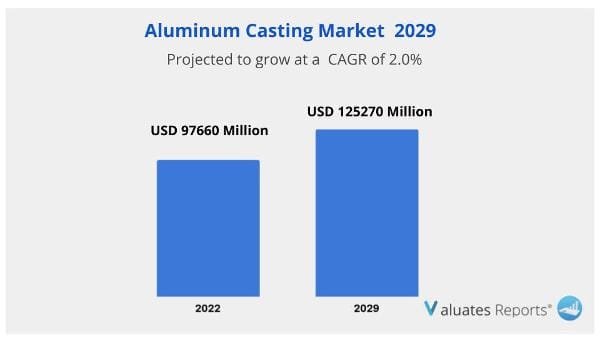
The global Aluminum Casting market was valued at USD 97660 million in 2022 and is anticipated to reach USD 125270 million by 2029, witnessing a CAGR of 2.0% during the forecast period 2023-2029. Because of aluminum's high strength and lightweight characteristics, the market for aluminum casting is anticipated to grow over the next few years.
The market for aluminum casting is being driven primarily by expanding consumer demand, rising military spending on lightweight weapons, and industrial growth in developing nations.
Technology advances and the high efficacy of aluminum-cast products are driving considerable growth in the aluminum casting industry.
In the auto industry, aluminum is used for the frame and body of the car, electrical wiring, wheels, lighting, paint, air conditioner condenser and pipes, gearbox, engine parts (piston, radiator, and cylinder head), and magnets. (for speedometers, tachometers, and airbags). Aluminum can absorb twice as much energy in a collision as steel can for the same weight. Aluminum can be used to increase the size and energy absorption capacity of a car's front and rear crumple zones, enhancing safety without adding weight. Vehicles composed of aluminum have closer stopping distances, which reduces the chance of crashes. The market for aluminum casting is anticipated to develop as a result of this factor.
In North America and Europe, sales of electric vehicles are rapidly increasing. The strict CO2 emission laws in a number of European countries are driving up the demand for high-strength aluminum alloys. These alloys provide exceptional strength, a necessary requirement for electric vehicles. The market for aluminum casting is anticipated to develop as a result of this factor.
Rapid industrialization has been a top aim for rising nations during the past few decades. A number of countries, including China, India, Indonesia, South Africa, Brazil, and Argentina, are reorienting their economies away from agriculture and towards manufacturing and other economic sectors. It is utilized in a variety of products, including passenger cars, motorcycles, telecom equipment, ships, heavy machinery, building & construction gear, railroads, commercial vehicles, and aircraft. A multitude of macroeconomic factors, including GDP growth, the unemployment rate, and the standard of living, have an impact on the expansion of these industries. The demand for cast aluminum is anticipated to rise dramatically as a result of the growth of facilities because it is utilized in practically every industry.
Internationally, Nemak, Ryobi, Ahresty, and other businesses play a significant role in aluminum casting. About 6% of the market is under the control of the top three rivals.
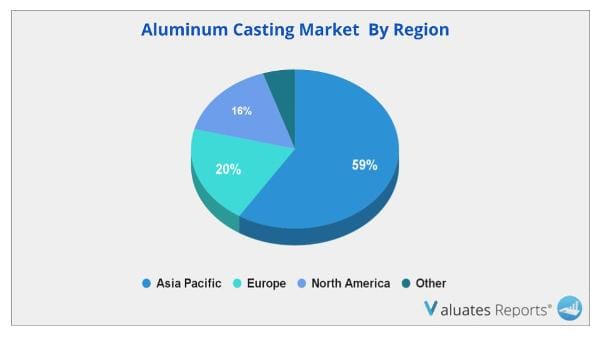
Asia-Pacific is the largest market, accounting for around 59% of global sales, followed by Europe and North America, which have respective shares of 20% and 16%.
The transportation sector dominates the market for aluminum casting. The light weight of aluminum helps vehicles run more efficiently. Due to their excellent fuel efficiency, aluminum components are commonly used in buses, ships, cars, and airplanes. Cast products provide more than half of the aluminum used in autos.
| Report Metric | Details |
| Report Name | Aluminum Casting Market |
| The market size in 2022 | USD 97660 Million |
| The revenue forecast in 2029 | USD 125270 Million |
| Growth Rate | Compound Annual Growth Rate (CAGR) of 2.0% from 2023 to 2029 |
| Market size available for years | 2023-2029 |
| Forecast units | Value (USD) |
| Segments covered | By Type, Application & Regions |
| Report coverage | Revenue & volume forecast, company share, competitive landscape, growth factors, and trends |
| Geographic regions covered | North America, Europe, Asia Pacific, Latin America, Middle East & Africa |
Ans. The global Aluminum Casting Market was valued at US$ 97660 million in 2022 and is anticipated to reach US$ 125270 million by 2029, witnessing a CAGR of 2.0% during the forecast period 2023-2029.
Ans. The global Aluminum Casting market is expected to grow at a compound annual growth rate of 2.0% from 2022 to 2028.
Ans. Some of the major companies are Alcoa, Dynacast International, Gibbs Die Casting, Ryobi, Martinrea Honsel, United Company Rusal, Nemak, Rockman Industries, Endurance, LTH, CHALCO, China Hongqiao, Guangdong Hongtu, Hongte, Wencan.
1 Aluminum Casting Market Overview
1.1 Product Definition
1.2 Aluminum Casting Segment by Type
1.2.1 Global Aluminum Casting Market Value Growth Rate Analysis by Type 2022 VS 2029
1.2.2 Die Casting
1.2.3 Permanent Molding Casting
1.2.4 Sand Casting
1.2.5 Others
1.3 Aluminum Casting Segment by Application
1.3.1 Global Aluminum Casting Market Value Growth Rate Analysis by Application: 2022 VS 2029
1.3.2 Passenger Vehicle
1.3.3 Heavy Vehicle (Commercial Vehicle)
1.3.4 Motorcycle
1.3.5 Aerospace & Military
1.3.6 Engineering Machinery
1.3.7 General Industrial Machinery
1.3.8 Others
1.4 Global Market Growth Prospects
1.4.1 Global Aluminum Casting Production Value Estimates and Forecasts (2018-2029)
1.4.2 Global Aluminum Casting Production Capacity Estimates and Forecasts (2018-2029)
1.4.3 Global Aluminum Casting Production Estimates and Forecasts (2018-2029)
1.4.4 Global Aluminum Casting Market Average Price Estimates and Forecasts (2018-2029)
1.5 Assumptions and Limitations
2 Market Competition by Manufacturers
2.1 Global Aluminum Casting Production Market Share by Manufacturers (2018-2023)
2.2 Global Aluminum Casting Production Value Market Share by Manufacturers (2018-2023)
2.3 Global Key Players of Aluminum Casting, Industry Ranking, 2021 VS 2022 VS 2023
2.4 Global Aluminum Casting Market Share by Company Type (Tier 1, Tier 2 and Tier 3)
2.5 Global Aluminum Casting Average Price by Manufacturers (2018-2023)
2.6 Global Key Manufacturers of Aluminum Casting, Manufacturing Base Distribution and Headquarters
2.7 Global Key Manufacturers of Aluminum Casting, Product Offered and Application
2.8 Global Key Manufacturers of Aluminum Casting, Date of Enter into This Industry
2.9 Aluminum Casting Market Competitive Situation and Trends
2.9.1 Aluminum Casting Market Concentration Rate
2.9.2 Global 5 and 10 Largest Aluminum Casting Players Market Share by Revenue
2.10 Mergers & Acquisitions, Expansion
3 Aluminum Casting Production by Region
3.1 Global Aluminum Casting Production Value Estimates and Forecasts by Region: 2018 VS 2022 VS 2029
3.2 Global Aluminum Casting Production Value by Region (2018-2029)
3.2.1 Global Aluminum Casting Production Value Market Share by Region (2018-2023)
3.2.2 Global Forecasted Production Value of Aluminum Casting by Region (2024-2029)
3.3 Global Aluminum Casting Production Estimates and Forecasts by Region: 2018 VS 2022 VS 2029
3.4 Global Aluminum Casting Production by Region (2018-2029)
3.4.1 Global Aluminum Casting Production Market Share by Region (2018-2023)
3.4.2 Global Forecasted Production of Aluminum Casting by Region (2024-2029)
3.5 Global Aluminum Casting Market Price Analysis by Region (2018-2023)
3.6 Global Aluminum Casting Production and Value, Year-over-Year Growth
3.6.1 North America Aluminum Casting Production Value Estimates and Forecasts (2018-2029)
3.6.2 Europe Aluminum Casting Production Value Estimates and Forecasts (2018-2029)
3.6.3 China Aluminum Casting Production Value Estimates and Forecasts (2018-2029)
3.6.4 Japan Aluminum Casting Production Value Estimates and Forecasts (2018-2029)
3.6.5 India Aluminum Casting Production Value Estimates and Forecasts (2018-2029)
4 Aluminum Casting Consumption by Region
4.1 Global Aluminum Casting Consumption Estimates and Forecasts by Region: 2018 VS 2022 VS 2029
4.2 Global Aluminum Casting Consumption by Region (2018-2029)
4.2.1 Global Aluminum Casting Consumption by Region (2018-2023)
4.2.2 Global Aluminum Casting Forecasted Consumption by Region (2024-2029)
4.3 North America
4.3.1 North America Aluminum Casting Consumption Growth Rate by Country: 2018 VS 2022 VS 2029
4.3.2 North America Aluminum Casting Consumption by Country (2018-2029)
4.3.3 United States
4.3.4 Canada
4.4 Europe
4.4.1 Europe Aluminum Casting Consumption Growth Rate by Country: 2018 VS 2022 VS 2029
4.4.2 Europe Aluminum Casting Consumption by Country (2018-2029)
4.4.3 Germany
4.4.4 France
4.4.5 U.K.
4.4.6 Italy
4.4.7 Russia
4.5 Asia Pacific
4.5.1 Asia Pacific Aluminum Casting Consumption Growth Rate by Region: 2018 VS 2022 VS 2029
4.5.2 Asia Pacific Aluminum Casting Consumption by Region (2018-2029)
4.5.3 China
4.5.4 Japan
4.5.5 South Korea
4.5.6 China Taiwan
4.5.7 Southeast Asia
4.5.8 India
4.6 Latin America, Middle East & Africa
4.6.1 Latin America, Middle East & Africa Aluminum Casting Consumption Growth Rate by Country: 2018 VS 2022 VS 2029
4.6.2 Latin America, Middle East & Africa Aluminum Casting Consumption by Country (2018-2029)
4.6.3 Mexico
4.6.4 Brazil
4.6.5 Turkey
5 Segment by Type
5.1 Global Aluminum Casting Production by Type (2018-2029)
5.1.1 Global Aluminum Casting Production by Type (2018-2023)
5.1.2 Global Aluminum Casting Production by Type (2024-2029)
5.1.3 Global Aluminum Casting Production Market Share by Type (2018-2029)
5.2 Global Aluminum Casting Production Value by Type (2018-2029)
5.2.1 Global Aluminum Casting Production Value by Type (2018-2023)
5.2.2 Global Aluminum Casting Production Value by Type (2024-2029)
5.2.3 Global Aluminum Casting Production Value Market Share by Type (2018-2029)
5.3 Global Aluminum Casting Price by Type (2018-2029)
6 Segment by Application
6.1 Global Aluminum Casting Production by Application (2018-2029)
6.1.1 Global Aluminum Casting Production by Application (2018-2023)
6.1.2 Global Aluminum Casting Production by Application (2024-2029)
6.1.3 Global Aluminum Casting Production Market Share by Application (2018-2029)
6.2 Global Aluminum Casting Production Value by Application (2018-2029)
6.2.1 Global Aluminum Casting Production Value by Application (2018-2023)
6.2.2 Global Aluminum Casting Production Value by Application (2024-2029)
6.2.3 Global Aluminum Casting Production Value Market Share by Application (2018-2029)
6.3 Global Aluminum Casting Price by Application (2018-2029)
7 Key Companies Profiled
7.1 Nemak
7.1.1 Nemak Aluminum Casting Corporation Information
7.1.2 Nemak Aluminum Casting Product Portfolio
7.1.3 Nemak Aluminum Casting Production, Value, Price and Gross Margin (2018-2023)
7.1.4 Nemak Main Business and Markets Served
7.1.5 Nemak Recent Developments/Updates
7.2 Ryobi
7.2.1 Ryobi Aluminum Casting Corporation Information
7.2.2 Ryobi Aluminum Casting Product Portfolio
7.2.3 Ryobi Aluminum Casting Production, Value, Price and Gross Margin (2018-2023)
7.2.4 Ryobi Main Business and Markets Served
7.2.5 Ryobi Recent Developments/Updates
7.3 Ahresty
7.3.1 Ahresty Aluminum Casting Corporation Information
7.3.2 Ahresty Aluminum Casting Product Portfolio
7.3.3 Ahresty Aluminum Casting Production, Value, Price and Gross Margin (2018-2023)
7.3.4 Ahresty Main Business and Markets Served
7.3.5 Ahresty Recent Developments/Updates
7.4 Georg Fischer Ltd
7.4.1 Georg Fischer Ltd Aluminum Casting Corporation Information
7.4.2 Georg Fischer Ltd Aluminum Casting Product Portfolio
7.4.3 Georg Fischer Ltd Aluminum Casting Production, Value, Price and Gross Margin (2018-2023)
7.4.4 Georg Fischer Ltd Main Business and Markets Served
7.4.5 Georg Fischer Ltd Recent Developments/Updates
7.5 Alcoa
7.5.1 Alcoa Aluminum Casting Corporation Information
7.5.2 Alcoa Aluminum Casting Product Portfolio
7.5.3 Alcoa Aluminum Casting Production, Value, Price and Gross Margin (2018-2023)
7.5.4 Alcoa Main Business and Markets Served
7.5.5 Alcoa Recent Developments/Updates
7.6 Dynacast International
7.6.1 Dynacast International Aluminum Casting Corporation Information
7.6.2 Dynacast International Aluminum Casting Product Portfolio
7.6.3 Dynacast International Aluminum Casting Production, Value, Price and Gross Margin (2018-2023)
7.6.4 Dynacast International Main Business and Markets Served
7.6.5 Dynacast International Recent Developments/Updates
7.7 Gibbs Die Casting
7.7.1 Gibbs Die Casting Aluminum Casting Corporation Information
7.7.2 Gibbs Die Casting Aluminum Casting Product Portfolio
7.7.3 Gibbs Die Casting Aluminum Casting Production, Value, Price and Gross Margin (2018-2023)
7.7.4 Gibbs Die Casting Main Business and Markets Served
7.7.5 Gibbs Die Casting Recent Developments/Updates
7.8 Martinrea Honsel
7.8.1 Martinrea Honsel Aluminum Casting Corporation Information
7.8.2 Martinrea Honsel Aluminum Casting Product Portfolio
7.8.3 Martinrea Honsel Aluminum Casting Production, Value, Price and Gross Margin (2018-2023)
7.8.4 Martinrea Honsel Main Business and Markets Served
7.7.5 Martinrea Honsel Recent Developments/Updates
7.9 United Company Rusal
7.9.1 United Company Rusal Aluminum Casting Corporation Information
7.9.2 United Company Rusal Aluminum Casting Product Portfolio
7.9.3 United Company Rusal Aluminum Casting Production, Value, Price and Gross Margin (2018-2023)
7.9.4 United Company Rusal Main Business and Markets Served
7.9.5 United Company Rusal Recent Developments/Updates
7.10 Rockman Industries
7.10.1 Rockman Industries Aluminum Casting Corporation Information
7.10.2 Rockman Industries Aluminum Casting Product Portfolio
7.10.3 Rockman Industries Aluminum Casting Production, Value, Price and Gross Margin (2018-2023)
7.10.4 Rockman Industries Main Business and Markets Served
7.10.5 Rockman Industries Recent Developments/Updates
7.11 Endurance
7.11.1 Endurance Aluminum Casting Corporation Information
7.11.2 Endurance Aluminum Casting Product Portfolio
7.11.3 Endurance Aluminum Casting Production, Value, Price and Gross Margin (2018-2023)
7.11.4 Endurance Main Business and Markets Served
7.11.5 Endurance Recent Developments/Updates
7.12 LTH
7.12.1 LTH Aluminum Casting Corporation Information
7.12.2 LTH Aluminum Casting Product Portfolio
7.12.3 LTH Aluminum Casting Production, Value, Price and Gross Margin (2018-2023)
7.12.4 LTH Main Business and Markets Served
7.12.5 LTH Recent Developments/Updates
7.13 China Hongqiao
7.13.1 China Hongqiao Aluminum Casting Corporation Information
7.13.2 China Hongqiao Aluminum Casting Product Portfolio
7.13.3 China Hongqiao Aluminum Casting Production, Value, Price and Gross Margin (2018-2023)
7.13.4 China Hongqiao Main Business and Markets Served
7.13.5 China Hongqiao Recent Developments/Updates
7.14 Guangdong Hongtu
7.14.1 Guangdong Hongtu Aluminum Casting Corporation Information
7.14.2 Guangdong Hongtu Aluminum Casting Product Portfolio
7.14.3 Guangdong Hongtu Aluminum Casting Production, Value, Price and Gross Margin (2018-2023)
7.14.4 Guangdong Hongtu Main Business and Markets Served
7.14.5 Guangdong Hongtu Recent Developments/Updates
7.15 Hongte
7.15.1 Hongte Aluminum Casting Corporation Information
7.15.2 Hongte Aluminum Casting Product Portfolio
7.15.3 Hongte Aluminum Casting Production, Value, Price and Gross Margin (2018-2023)
7.15.4 Hongte Main Business and Markets Served
7.15.5 Hongte Recent Developments/Updates
7.16 Wencan
7.16.1 Wencan Aluminum Casting Corporation Information
7.16.2 Wencan Aluminum Casting Product Portfolio
7.16.3 Wencan Aluminum Casting Production, Value, Price and Gross Margin (2018-2023)
7.16.4 Wencan Main Business and Markets Served
7.16.5 Wencan Recent Developments/Updates
8 Industry Chain and Sales Channels Analysis
8.1 Aluminum Casting Industry Chain Analysis
8.2 Aluminum Casting Key Raw Materials
8.2.1 Key Raw Materials
8.2.2 Raw Materials Key Suppliers
8.3 Aluminum Casting Production Mode & Process
8.4 Aluminum Casting Sales and Marketing
8.4.1 Aluminum Casting Sales Channels
8.4.2 Aluminum Casting Distributors
8.5 Aluminum Casting Customers
9 Aluminum Casting Market Dynamics
9.1 Aluminum Casting Industry Trends
9.2 Aluminum Casting Market Drivers
9.3 Aluminum Casting Market Challenges
9.4 Aluminum Casting Market Restraints
10 Research Finding and Conclusion
11 Methodology and Data Source
11.1 Methodology/Research Approach
11.1.1 Research Programs/Design
11.1.2 Market Size Estimation
11.1.3 Market Breakdown and Data Triangulation
11.2 Data Source
11.2.1 Secondary Sources
11.2.2 Primary Sources
11.3 Author List
11.4 Disclaimer
List of Tables
Table 1. Global Aluminum Casting Market Value by Type, (US$ Million) & (2022 VS 2029)
Table 2. Global Aluminum Casting Market Value by Application, (US$ Million) & (2022 VS 2029)
Table 3. Global Aluminum Casting Production Capacity (K MT) by Manufacturers in 2022
Table 4. Global Aluminum Casting Production by Manufacturers (2018-2023) & (K MT)
Table 5. Global Aluminum Casting Production Market Share by Manufacturers (2018-2023)
Table 6. Global Aluminum Casting Production Value by Manufacturers (2018-2023) & (US$ Million)
Table 7. Global Aluminum Casting Production Value Share by Manufacturers (2018-2023)
Table 8. Global Aluminum Casting Industry Ranking 2021 VS 2022 VS 2023
Table 9. Company Type (Tier 1, Tier 2 and Tier 3) & (based on the Revenue in Aluminum Casting as of 2022)
Table 10. Global Market Aluminum Casting Average Price by Manufacturers (USD/MT) & (2018-2023)
Table 11. Manufacturers Aluminum Casting Production Sites and Area Served
Table 12. Manufacturers Aluminum Casting Product Types
Table 13. Global Aluminum Casting Manufacturers Market Concentration Ratio (CR5 and HHI)
Table 14. Mergers & Acquisitions, Expansion
Table 15. Global Aluminum Casting Production Value by Region: 2018 VS 2022 VS 2029 (US$ Million)
Table 16. Global Aluminum Casting Production Value (US$ Million) by Region (2018-2023)
Table 17. Global Aluminum Casting Production Value Market Share by Region (2018-2023)
Table 18. Global Aluminum Casting Production Value (US$ Million) Forecast by Region (2024-2029)
Table 19. Global Aluminum Casting Production Value Market Share Forecast by Region (2024-2029)
Table 20. Global Aluminum Casting Production Comparison by Region: 2018 VS 2022 VS 2029 (K MT)
Table 21. Global Aluminum Casting Production (K MT) by Region (2018-2023)
Table 22. Global Aluminum Casting Production Market Share by Region (2018-2023)
Table 23. Global Aluminum Casting Production (K MT) Forecast by Region (2024-2029)
Table 24. Global Aluminum Casting Production Market Share Forecast by Region (2024-2029)
Table 25. Global Aluminum Casting Market Average Price (USD/MT) by Region (2018-2023)
Table 26. Global Aluminum Casting Market Average Price (USD/MT) by Region (2024-2029)
Table 27. Global Aluminum Casting Consumption Growth Rate by Region: 2018 VS 2022 VS 2029 (K MT)
Table 28. Global Aluminum Casting Consumption by Region (2018-2023) & (K MT)
Table 29. Global Aluminum Casting Consumption Market Share by Region (2018-2023)
Table 30. Global Aluminum Casting Forecasted Consumption by Region (2024-2029) & (K MT)
Table 31. Global Aluminum Casting Forecasted Consumption Market Share by Region (2018-2023)
Table 32. North America Aluminum Casting Consumption Growth Rate by Country: 2018 VS 2022 VS 2029 (K MT)
Table 33. North America Aluminum Casting Consumption by Country (2018-2023) & (K MT)
Table 34. North America Aluminum Casting Consumption by Country (2024-2029) & (K MT)
Table 35. Europe Aluminum Casting Consumption Growth Rate by Country: 2018 VS 2022 VS 2029 (K MT)
Table 36. Europe Aluminum Casting Consumption by Country (2018-2023) & (K MT)
Table 37. Europe Aluminum Casting Consumption by Country (2024-2029) & (K MT)
Table 38. Asia Pacific Aluminum Casting Consumption Growth Rate by Region: 2018 VS 2022 VS 2029 (K MT)
Table 39. Asia Pacific Aluminum Casting Consumption by Region (2018-2023) & (K MT)
Table 40. Asia Pacific Aluminum Casting Consumption by Region (2024-2029) & (K MT)
Table 41. Latin America, Middle East & Africa Aluminum Casting Consumption Growth Rate by Country: 2018 VS 2022 VS 2029 (K MT)
Table 42. Latin America, Middle East & Africa Aluminum Casting Consumption by Country (2018-2023) & (K MT)
Table 43. Latin America, Middle East & Africa Aluminum Casting Consumption by Country (2024-2029) & (K MT)
Table 44. Global Aluminum Casting Production (K MT) by Type (2018-2023)
Table 45. Global Aluminum Casting Production (K MT) by Type (2024-2029)
Table 46. Global Aluminum Casting Production Market Share by Type (2018-2023)
Table 47. Global Aluminum Casting Production Market Share by Type (2024-2029)
Table 48. Global Aluminum Casting Production Value (US$ Million) by Type (2018-2023)
Table 49. Global Aluminum Casting Production Value (US$ Million) by Type (2024-2029)
Table 50. Global Aluminum Casting Production Value Share by Type (2018-2023)
Table 51. Global Aluminum Casting Production Value Share by Type (2024-2029)
Table 52. Global Aluminum Casting Price (USD/MT) by Type (2018-2023)
Table 53. Global Aluminum Casting Price (USD/MT) by Type (2024-2029)
Table 54. Global Aluminum Casting Production (K MT) by Application (2018-2023)
Table 55. Global Aluminum Casting Production (K MT) by Application (2024-2029)
Table 56. Global Aluminum Casting Production Market Share by Application (2018-2023)
Table 57. Global Aluminum Casting Production Market Share by Application (2024-2029)
Table 58. Global Aluminum Casting Production Value (US$ Million) by Application (2018-2023)
Table 59. Global Aluminum Casting Production Value (US$ Million) by Application (2024-2029)
Table 60. Global Aluminum Casting Production Value Share by Application (2018-2023)
Table 61. Global Aluminum Casting Production Value Share by Application (2024-2029)
Table 62. Global Aluminum Casting Price (USD/MT) by Application (2018-2023)
Table 63. Global Aluminum Casting Price (USD/MT) by Application (2024-2029)
Table 64. Nemak Aluminum Casting Corporation Information
Table 65. Nemak Specification and Application
Table 66. Nemak Aluminum Casting Production (K MT), Value (US$ Million), Price (USD/MT) and Gross Margin (2018-2023)
Table 67. Nemak Main Business and Markets Served
Table 68. Nemak Recent Developments/Updates
Table 69. Ryobi Aluminum Casting Corporation Information
Table 70. Ryobi Specification and Application
Table 71. Ryobi Aluminum Casting Production (K MT), Value (US$ Million), Price (USD/MT) and Gross Margin (2018-2023)
Table 72. Ryobi Main Business and Markets Served
Table 73. Ryobi Recent Developments/Updates
Table 74. Ahresty Aluminum Casting Corporation Information
Table 75. Ahresty Specification and Application
Table 76. Ahresty Aluminum Casting Production (K MT), Value (US$ Million), Price (USD/MT) and Gross Margin (2018-2023)
Table 77. Ahresty Main Business and Markets Served
Table 78. Ahresty Recent Developments/Updates
Table 79. Georg Fischer Ltd Aluminum Casting Corporation Information
Table 80. Georg Fischer Ltd Specification and Application
Table 81. Georg Fischer Ltd Aluminum Casting Production (K MT), Value (US$ Million), Price (USD/MT) and Gross Margin (2018-2023)
Table 82. Georg Fischer Ltd Main Business and Markets Served
Table 83. Georg Fischer Ltd Recent Developments/Updates
Table 84. Alcoa Aluminum Casting Corporation Information
Table 85. Alcoa Specification and Application
Table 86. Alcoa Aluminum Casting Production (K MT), Value (US$ Million), Price (USD/MT) and Gross Margin (2018-2023)
Table 87. Alcoa Main Business and Markets Served
Table 88. Alcoa Recent Developments/Updates
Table 89. Dynacast International Aluminum Casting Corporation Information
Table 90. Dynacast International Specification and Application
Table 91. Dynacast International Aluminum Casting Production (K MT), Value (US$ Million), Price (USD/MT) and Gross Margin (2018-2023)
Table 92. Dynacast International Main Business and Markets Served
Table 93. Dynacast International Recent Developments/Updates
Table 94. Gibbs Die Casting Aluminum Casting Corporation Information
Table 95. Gibbs Die Casting Specification and Application
Table 96. Gibbs Die Casting Aluminum Casting Production (K MT), Value (US$ Million), Price (USD/MT) and Gross Margin (2018-2023)
Table 97. Gibbs Die Casting Main Business and Markets Served
Table 98. Gibbs Die Casting Recent Developments/Updates
Table 99. Martinrea Honsel Aluminum Casting Corporation Information
Table 100. Martinrea Honsel Specification and Application
Table 101. Martinrea Honsel Aluminum Casting Production (K MT), Value (US$ Million), Price (USD/MT) and Gross Margin (2018-2023)
Table 102. Martinrea Honsel Main Business and Markets Served
Table 103. Martinrea Honsel Recent Developments/Updates
Table 104. United Company Rusal Aluminum Casting Corporation Information
Table 105. United Company Rusal Specification and Application
Table 106. United Company Rusal Aluminum Casting Production (K MT), Value (US$ Million), Price (USD/MT) and Gross Margin (2018-2023)
Table 107. United Company Rusal Main Business and Markets Served
Table 108. United Company Rusal Recent Developments/Updates
Table 109. Rockman Industries Aluminum Casting Corporation Information
Table 110. Rockman Industries Specification and Application
Table 111. Rockman Industries Aluminum Casting Production (K MT), Value (US$ Million), Price (USD/MT) and Gross Margin (2018-2023)
Table 112. Rockman Industries Main Business and Markets Served
Table 113. Rockman Industries Recent Developments/Updates
Table 114. Endurance Aluminum Casting Corporation Information
Table 115. Endurance Specification and Application
Table 116. Endurance Aluminum Casting Production (K MT), Value (US$ Million), Price (USD/MT) and Gross Margin (2018-2023)
Table 117. Endurance Main Business and Markets Served
Table 118. Endurance Recent Developments/Updates
Table 119. LTH Aluminum Casting Corporation Information
Table 120. LTH Specification and Application
Table 121. LTH Aluminum Casting Production (K MT), Value (US$ Million), Price (USD/MT) and Gross Margin (2018-2023)
Table 122. LTH Main Business and Markets Served
Table 123. LTH Recent Developments/Updates
Table 124. China Hongqiao Aluminum Casting Corporation Information
Table 125. China Hongqiao Specification and Application
Table 126. China Hongqiao Aluminum Casting Production (K MT), Value (US$ Million), Price (USD/MT) and Gross Margin (2018-2023)
Table 127. China Hongqiao Main Business and Markets Served
Table 128. China Hongqiao Recent Developments/Updates
Table 129. Guangdong Hongtu Aluminum Casting Corporation Information
Table 130. Guangdong Hongtu Specification and Application
Table 131. Guangdong Hongtu Aluminum Casting Production (K MT), Value (US$ Million), Price (USD/MT) and Gross Margin (2018-2023)
Table 132. Guangdong Hongtu Main Business and Markets Served
Table 133. Guangdong Hongtu Recent Developments/Updates
Table 134. Guangdong Hongtu Aluminum Casting Corporation Information
Table 135. Hongte Specification and Application
Table 136. Hongte Aluminum Casting Production (K MT), Value (US$ Million), Price (USD/MT) and Gross Margin (2018-2023)
Table 137. Hongte Main Business and Markets Served
Table 138. Hongte Recent Developments/Updates
Table 139. Wencan Aluminum Casting Corporation Information
Table 140. Wencan Aluminum Casting Production (K MT), Value (US$ Million), Price (USD/MT) and Gross Margin (2018-2023)
Table 141. Wencan Main Business and Markets Served
Table 142. Wencan Recent Developments/Updates
Table 143. Key Raw Materials Lists
Table 144. Raw Materials Key Suppliers Lists
Table 145. Aluminum Casting Distributors List
Table 146. Aluminum Casting Customers List
Table 147. Aluminum Casting Market Trends
Table 148. Aluminum Casting Market Drivers
Table 149. Aluminum Casting Market Challenges
Table 150. Aluminum Casting Market Restraints
Table 151. Research Programs/Design for This Report
Table 152. Key Data Information from Secondary Sources
Table 153. Key Data Information from Primary Sources
List of Figures
Figure 1. Product Picture of Aluminum Casting
Figure 2. Global Aluminum Casting Market Value by Type, (US$ Million) & (2022 VS 2029)
Figure 3. Global Aluminum Casting Market Share by Type: 2022 VS 2029
Figure 4. Die Casting Product Picture
Figure 5. Permanent Molding Casting Product Picture
Figure 6. Sand Casting Product Picture
Figure 7. Others Product Picture
Figure 8. Global Aluminum Casting Market Value by Application, (US$ Million) & (2022 VS 2029)
Figure 9. Global Aluminum Casting Market Share by Application: 2022 VS 2029
Figure 10. Passenger Vehicle
Figure 11. Heavy Vehicle (Commercial Vehicle)
Figure 12. Motorcycle
Figure 13. Aerospace & Military
Figure 14. Engineering Machinery
Figure 15. General Industrial Machinery
Figure 16. Others
Figure 17. Global Aluminum Casting Production Value (US$ Million), 2018 VS 2022 VS 2029
Figure 18. Global Aluminum Casting Production Value (US$ Million) & (2018-2029)
Figure 19. Global Aluminum Casting Production (K MT) & (2018-2029)
Figure 20. Global Aluminum Casting Average Price (USD/MT) & (2018-2029)
Figure 21. Aluminum Casting Report Years Considered
Figure 22. Aluminum Casting Production Share by Manufacturers in 2022
Figure 23. Aluminum Casting Market Share by Company Type (Tier 1, Tier 2, and Tier 3): 2018 VS 2022
Figure 24. The Global 5 and 10 Largest Players: Market Share by Aluminum Casting Revenue in 2022
Figure 25. Global Aluminum Casting Production Value by Region: 2018 VS 2022 VS 2029 (US$ Million)
Figure 26. Global Aluminum Casting Production Value Market Share by Region: 2018 VS 2022 VS 2029
Figure 27. Global Aluminum Casting Production Comparison by Region: 2018 VS 2022 VS 2029 (K MT)
Figure 28. Global Aluminum Casting Production Market Share by Region: 2018 VS 2022 VS 2029
Figure 29. North America Aluminum Casting Production Value (US$ Million) Growth Rate (2018-2029)
Figure 30. Europe Aluminum Casting Production Value (US$ Million) Growth Rate (2018-2029)
Figure 31. China Aluminum Casting Production Value (US$ Million) Growth Rate (2018-2029)
Figure 32. Japan Aluminum Casting Production Value (US$ Million) Growth Rate (2018-2029)
Figure 33. India Aluminum Casting Production Value (US$ Million) Growth Rate (2018-2029)
Figure 34. Global Aluminum Casting Consumption by Region: 2018 VS 2022 VS 2029 (K MT)
Figure 35. Global Aluminum Casting Consumption Market Share by Region: 2018 VS 2022 VS 2029
Figure 36. North America Aluminum Casting Consumption and Growth Rate (2018-2023) & (K MT)
Figure 37. North America Aluminum Casting Consumption Market Share by Country (2018-2029)
Figure 38. Canada Aluminum Casting Consumption and Growth Rate (2018-2023) & (K MT)
Figure 39. U.S. Aluminum Casting Consumption and Growth Rate (2018-2023) & (K MT)
Figure 40. Europe Aluminum Casting Consumption and Growth Rate (2018-2023) & (K MT)
Figure 41. Europe Aluminum Casting Consumption Market Share by Country (2018-2029)
Figure 42. Germany Aluminum Casting Consumption and Growth Rate (2018-2023) & (K MT)
Figure 43. France Aluminum Casting Consumption and Growth Rate (2018-2023) & (K MT)
Figure 44. U.K. Aluminum Casting Consumption and Growth Rate (2018-2023) & (K MT)
Figure 45. Italy Aluminum Casting Consumption and Growth Rate (2018-2023) & (K MT)
Figure 46. Russia Aluminum Casting Consumption and Growth Rate (2018-2023) & (K MT)
Figure 47. Asia Pacific Aluminum Casting Consumption and Growth Rate (2018-2023) & (K MT)
Figure 48. Asia Pacific Aluminum Casting Consumption Market Share by Regions (2018-2029)
Figure 49. China Aluminum Casting Consumption and Growth Rate (2018-2023) & (K MT)
Figure 50. Japan Aluminum Casting Consumption and Growth Rate (2018-2023) & (K MT)
Figure 51. South Korea Aluminum Casting Consumption and Growth Rate (2018-2023) & (K MT)
Figure 52. China Taiwan Aluminum Casting Consumption and Growth Rate (2018-2023) & (K MT)
Figure 53. Southeast Asia Aluminum Casting Consumption and Growth Rate (2018-2023) & (K MT)
Figure 54. India Aluminum Casting Consumption and Growth Rate (2018-2023) & (K MT)
Figure 55. Latin America, Middle East & Africa Aluminum Casting Consumption and Growth Rate (2018-2023) & (K MT)
Figure 56. Latin America, Middle East & Africa Aluminum Casting Consumption Market Share by Country (2018-2029)
Figure 57. Mexico Aluminum Casting Consumption and Growth Rate (2018-2023) & (K MT)
Figure 58. Brazil Aluminum Casting Consumption and Growth Rate (2018-2023) & (K MT)
Figure 59. Turkey Aluminum Casting Consumption and Growth Rate (2018-2023) & (K MT)
Figure 60. GCC Countries Aluminum Casting Consumption and Growth Rate (2018-2023) & (K MT)
Figure 61. Global Production Market Share of Aluminum Casting by Type (2018-2029)
Figure 62. Global Production Value Market Share of Aluminum Casting by Type (2018-2029)
Figure 63. Global Aluminum Casting Price (USD/MT) by Type (2018-2029)
Figure 64. Global Production Market Share of Aluminum Casting by Application (2018-2029)
Figure 65. Global Production Value Market Share of Aluminum Casting by Application (2018-2029)
Figure 66. Global Aluminum Casting Price (USD/MT) by Application (2018-2029)
Figure 67. Aluminum Casting Value Chain
Figure 68. Aluminum Casting Production Process
Figure 69. Channels of Distribution (Direct Vs Distribution)
Figure 70. Distributors Profiles
Figure 71. Bottom-up and Top-down Approaches for This Report
Figure 72. Data Triangulation
$2900
$5800
HAVE A QUERY?
OUR CUSTOMER

SIMILAR REPORTS