
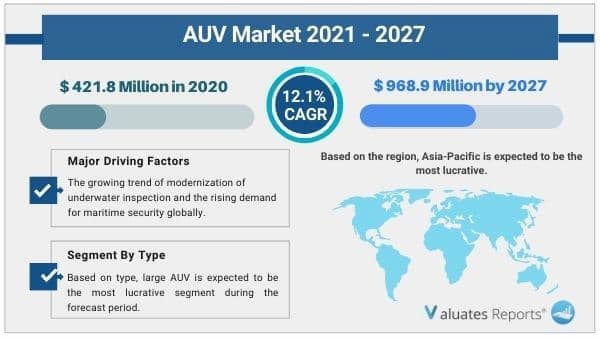
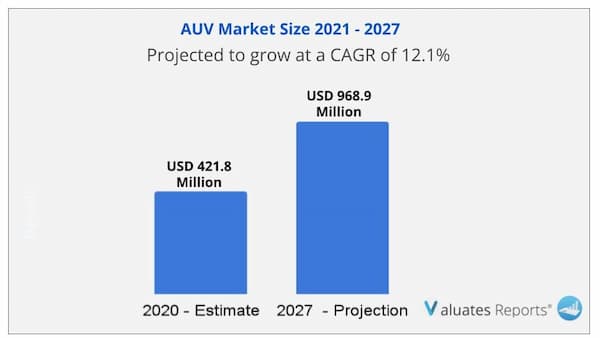
The global Autonomous Underwater Vehicles market size is projected to reach USD 968.9 Million by 2027, from USD 421.8 Million in 2020, at a CAGR of 12.1% during 2021-2027.
The growth in AUV operations due to the wide range of commercial, scientific, and military uses, including oceanography and anti-submarine warfare, is anticipated to drive the global market for autonomous underwater vehicles (AUVs). Since these AUVs are outfitted with sensors, actuators, and onboard intelligence systems for ocean exploration and to efficiently execute survey and sampling collection activities without any human guidance or supervision, demand for the sector has been steadily increasing over time.
Unmanned underwater vehicles that are operated without direct human input are called autonomous underwater vehicles (AUVs). They are made to carry out underwater survey missions needed in the business, academic, and defense sectors. They are equipped with the ability to complete an entire operation on their own and then return to the pre-planned area where the data is gathered and analyzed. Key applications for autonomous underwater vehicles are in commerce, research, and defense.
One of the key trends affecting the future of the autonomous underwater vehicle (AUV) market is the acceleration of oil and gas exploration operations. These programs will boost autonomous underwater vehicle development to aid in deep- and ultra-water finds. The global pace of defense spending has increased over time. The need for AUVs to conduct underwater survey missions for remote navigation and mapping will therefore increase.
A significant portion of the autonomous underwater vehicle market, given the importance of deep undersea projects. Additionally, the development of autonomous, reasonably priced big AUVs for defense applications such as surveillance, reconnaissance, and targeting will advance market dynamics in the next few years.
The market for autonomous underwater vehicles for archaeological and exploration applications is anticipated to expand at the fastest rate among all applications between 2017 and 2023. However, it is anticipated that in 2017, the market for autonomous underwater vehicles will be dominated by military & defense applications..
|
Report Metric |
Details |
|
Report Name |
AUV Market |
|
Market size value in 2020 |
USD 421.8 Million |
|
Revenue forecast in 2027 |
USD 968.9 Million |
|
Growth Rate |
CAGR 12.1% |
|
Base year considered |
2020 |
|
Forecast Period |
2021-2027 |
|
By Type |
Shallow AUV, Medium AUVs, Large AUVs |
|
By Application |
Defense, Scientific Research, Commercial |
Ans. The global Autonomous Underwater vehicle market size is projected to reach USD 968.9 Million by 2027, from USD 421.8 Million in 2020, at a CAGR of 12.1% during 2021-2027.
Ans. Some of the major companies are Kongsberg Maritime, OceanServer Technology, ISE Ltd, Teledyne Gavia, Bluefin Robotics, ECA SA, JAMSTEC, Falmouth Scientific.
Ans. Based on the region, Asia-Pacific is expected to be the most lucrative.
Ans. Yes, the report includes a COVID-19 impact analysis. Also, it is further extended into every individual segment of the report.
1 Report Overview
1.1 Autonomous Underwater Vehicles Research Scope
1.2 Market Segment by Type
1.2.1 Global Autonomous Underwater Vehicles Market Size Growth Rate by Type
1.2.2 Shallow AUV (Depth up to 100 m)
1.2.3 Medium AUVs (Depth up to 1000 m)
1.2.4 Large AUVs (Depth more than 1000 m)
1.3 Market Segment by Application
1.3.1 Global Autonomous Underwater Vehicles Market Size Growth Rate by Application
1.3.2 Defense
1.3.3 Scientific Research
1.3.4 Commercial
1.4 Study Objectives
1.5 Years Considered
2 Global Market Production
2.1 Global Autonomous Underwater Vehicles Production Capacity (2016-2027)
2.2 Global Autonomous Underwater Vehicles Production by Region: 2016 VS 2021 VS 2027
2.3 Global Autonomous Underwater Vehicles Production by Region
2.3.1 Global Autonomous Underwater Vehicles Historic Production by Region (2016-2021)
2.3.2 Global Autonomous Underwater Vehicles Forecasted Production by Region (2022-2027)
2.3.3 North America
2.3.4 Europe
2.3.5 Japan
2.3.6 China
2.3.7 South Korea
2.3.8 India
2.4 Industry Trends
2.4.1 Autonomous Underwater Vehicles Industry Trends
2.4.2 Autonomous Underwater Vehicles Market Drivers
2.4.3 Autonomous Underwater Vehicles Market Challenges
2.4.4 Autonomous Underwater Vehicles Market Restraints
3 Global Autonomous Underwater Vehicles Sales
3.1 Global Autonomous Underwater Vehicles Sales Estimates and Forecasts 2016-2027
3.2 Global Autonomous Underwater Vehicles Revenue Estimates and Forecasts 2016-2027
3.3 Global Autonomous Underwater Vehicles Revenue by Region: 2016 VS 2021 VS 2027
3.4 Global Top Autonomous Underwater Vehicles Regions by Sales
3.4.1 Global Top Autonomous Underwater Vehicles Regions by Sales (2016-2021)
3.4.2 Global Top Autonomous Underwater Vehicles Regions by Sales (2022-2027)
3.5 Global Top Autonomous Underwater Vehicles Regions by Revenue
3.5.1 Global Top Autonomous Underwater Vehicles Regions by Revenue (2016-2021)
3.5.2 Global Top Autonomous Underwater Vehicles Regions by Revenue (2022-2027)
3.5.3 North America
3.5.4 Europe
3.5.5 Asia-Pacific
3.5.6 Latin America
3.5.7 Middle East & Africa
4 Competition by Manufacturers
4.1 Global Autonomous Underwater Vehicles Production Capacity by Manufacturers
4.2 Global Autonomous Underwater Vehicles Sales by Manufacturers
4.2.1 Global Top Autonomous Underwater Vehicles Manufacturers by Sales (2016-2021)
4.2.2 Global Top Autonomous Underwater Vehicles Manufacturers Market Share by Sales (2016-2021)
4.2.3 Global Top 10 and Top 5 Companies by Autonomous Underwater Vehicles Sales in 2020
4.3 Global Autonomous Underwater Vehicles Revenue by Manufacturers
4.3.1 Global Top Autonomous Underwater Vehicles Manufacturers by Revenue (2016-2021)
4.3.2 Global Top Autonomous Underwater Vehicles Manufacturers Market Share by Revenue (2016-2021)
4.3.3 Global Top 10 and Top 5 Companies by Autonomous Underwater Vehicles Revenue in 2020
4.4 Global Autonomous Underwater Vehicles Sales Price by Manufacturers
4.5 Analysis of Competitive Landscape
4.5.1 Manufacturers Market Concentration Ratio (CR5 and HHI)
4.5.2 Global Autonomous Underwater Vehicles Market Share by Company Type (Tier 1, Tier 2, and Tier 3)
4.5.3 Global Autonomous Underwater Vehicles Manufacturers Geographical Distribution
4.6 Mergers & Acquisitions, Expansion Plans
5 Estimates and Forecasts by Type
5.1 Global Autonomous Underwater Vehicles Sales by Type
5.1.1 Global Autonomous Underwater Vehicles Historical Sales by Type (2016-2021)
5.1.2 Global Autonomous Underwater Vehicles Forecasted Sales by Type (2022-2027)
5.1.3 Global Autonomous Underwater Vehicles Sales Market Share by Type (2016-2027)
5.2 Global Autonomous Underwater Vehicles Revenue by Type
5.2.1 Global Autonomous Underwater Vehicles Historical Revenue by Type (2016-2021)
5.2.2 Global Autonomous Underwater Vehicles Forecasted Revenue by Type (2022-2027)
5.2.3 Global Autonomous Underwater Vehicles Revenue Market Share by Type (2016-2027)
5.3 Global Autonomous Underwater Vehicles Price by Type
5.3.1 Global Autonomous Underwater Vehicles Price by Type (2016-2021)
5.3.2 Global Autonomous Underwater Vehicles Price Forecast by Type (2022-2027)
6 Market Size by Application
6.1 Global Autonomous Underwater Vehicles Sales by Application
6.1.1 Global Autonomous Underwater Vehicles Historical Sales by Application (2016-2021)
6.1.2 Global Autonomous Underwater Vehicles Forecasted Sales by Application (2022-2027)
6.1.3 Global Autonomous Underwater Vehicles Sales Market Share by Application (2016-2027)
6.2 Global Autonomous Underwater Vehicles Revenue by Application
6.2.1 Global Autonomous Underwater Vehicles Historical Revenue by Application (2016-2021)
6.2.2 Global Autonomous Underwater Vehicles Forecasted Revenue by Application (2022-2027)
6.2.3 Global Autonomous Underwater Vehicles Revenue Market Share by Application (2016-2027)
6.3 Global Autonomous Underwater Vehicles Price by Application
6.3.1 Global Autonomous Underwater Vehicles Price by Application (2016-2021)
6.3.2 Global Autonomous Underwater Vehicles Price Forecast by Application (2022-2027)
7 North America
7.1 North America Autonomous Underwater Vehicles Sales Breakdown by Company
7.1.1 North America Autonomous Underwater Vehicles Sales by Company (2016-2021)
7.1.2 North America Autonomous Underwater Vehicles Revenue by Company (2016-2021)
7.2 North America Autonomous Underwater Vehicles Market Size by Type
7.2.1 North America Autonomous Underwater Vehicles Sales by Type (2016-2027)
7.2.2 North America Autonomous Underwater Vehicles Revenue by Type (2016-2027)
7.3 North America Autonomous Underwater Vehicles Market Size by Application
7.3.1 North America Autonomous Underwater Vehicles Sales by Application (2016-2027)
7.3.2 North America Autonomous Underwater Vehicles Revenue by Application (2016-2027)
7.4 North America Autonomous Underwater Vehicles Market Size by Country
7.4.1 North America Autonomous Underwater Vehicles Sales by Country (2016-2027)
7.4.2 North America Autonomous Underwater Vehicles Revenue by Country (2016-2027)
7.4.3 U.S.
7.4.4 Canada
8 Europe
8.1 Europe Autonomous Underwater Vehicles Sales Breakdown by Company
8.1.1 Europe Autonomous Underwater Vehicles Sales by Company (2016-2021)
8.1.2 Europe Autonomous Underwater Vehicles Revenue by Company (2016-2021)
8.2 Europe Autonomous Underwater Vehicles Market Size by Type
8.2.1 Europe Autonomous Underwater Vehicles Sales by Type (2016-2027)
8.2.2 Europe Autonomous Underwater Vehicles Revenue by Type (2016-2027)
8.3 Europe Autonomous Underwater Vehicles Market Size by Application
8.3.1 Europe Autonomous Underwater Vehicles Sales by Application (2016-2027)
8.3.2 Europe Autonomous Underwater Vehicles Revenue by Application (2016-2027)
8.4 Europe Autonomous Underwater Vehicles Market Size by Country
8.4.1 Europe Autonomous Underwater Vehicles Sales by Country (2016-2027)
8.4.2 Europe Autonomous Underwater Vehicles Revenue by Country (2016-2027)
8.4.3 Germany
8.4.4 France
8.4.5 U.K.
8.4.6 Italy
8.4.7 Russia
9 Asia Pacific
9.1 Asia Pacific Autonomous Underwater Vehicles Sales Breakdown by Company
9.1.1 Asia Pacific Autonomous Underwater Vehicles Sales by Company (2016-2021)
9.1.2 Asia Pacific Autonomous Underwater Vehicles Revenue by Company (2016-2021)
9.2 Asia Pacific Autonomous Underwater Vehicles Market Size by Type
9.2.1 Asia Pacific Autonomous Underwater Vehicles Sales by Type (2016-2027)
9.2.2 Asia Pacific Autonomous Underwater Vehicles Revenue by Type (2016-2027)
9.3 Asia Pacific Autonomous Underwater Vehicles Market Size by Application
9.3.1 Asia Pacific Autonomous Underwater Vehicles Sales by Application (2016-2027)
9.3.2 Asia Pacific Autonomous Underwater Vehicles Revenue by Application (2016-2027)
9.4 Asia Pacific Autonomous Underwater Vehicles Market Size by Region
9.4.1 Asia Pacific Autonomous Underwater Vehicles Sales by Region (2016-2027)
9.4.2 Asia Pacific Autonomous Underwater Vehicles Revenue by Region (2016-2027)
9.4.3 China
9.4.4 Japan
9.4.5 South Korea
9.4.6 India
9.4.7 Australia
9.4.8 Taiwan
9.4.9 Indonesia
9.4.10 Thailand
9.4.11 Malaysia
9.4.12 Philippines
10 Latin America
10.1 Latin America Autonomous Underwater Vehicles Sales Breakdown by Company
10.1.1 Latin America Autonomous Underwater Vehicles Sales by Company (2016-2021)
10.1.2 Latin America Autonomous Underwater Vehicles Revenue by Company (2016-2021)
10.2 Latin America Autonomous Underwater Vehicles Market Size by Type
10.2.1 Latin America Autonomous Underwater Vehicles Sales by Type (2016-2027)
10.2.2 Latin America Autonomous Underwater Vehicles Revenue by Type (2016-2027)
10.3 Latin America Autonomous Underwater Vehicles Market Size by Application
10.3.1 Latin America Autonomous Underwater Vehicles Sales by Application (2016-2027)
10.3.2 Latin America Autonomous Underwater Vehicles Revenue by Application (2016-2027)
10.4 Latin America Autonomous Underwater Vehicles Market Size by Country
10.4.1 Latin America Autonomous Underwater Vehicles Sales by Country (2016-2027)
10.4.2 Latin America Autonomous Underwater Vehicles Revenue by Country (2016-2027)
10.4.3 Mexico
10.4.4 Brazil
10.4.5 Argentina
11 Middle East and Africa
11.1 Middle East and Africa Autonomous Underwater Vehicles Sales Breakdown by Company
11.1.1 Middle East and Africa Autonomous Underwater Vehicles Sales by Company (2016-2021)
11.1.2 Middle East and Africa Autonomous Underwater Vehicles Revenue by Company (2016-2021)
11.2 Middle East and Africa Autonomous Underwater Vehicles Market Size by Type
11.2.1 Middle East and Africa Autonomous Underwater Vehicles Sales by Type (2016-2027)
11.2.2 Middle East and Africa Autonomous Underwater Vehicles Revenue by Type (2016-2027)
11.3 Middle East and Africa Autonomous Underwater Vehicles Market Size by Application
11.3.1 Middle East and Africa Autonomous Underwater Vehicles Sales by Application (2016-2027)
11.3.2 Middle East and Africa Autonomous Underwater Vehicles Revenue by Application (2016-2027)
11.4 Middle East and Africa Autonomous Underwater Vehicles Market Size by Country
11.4.1 Middle East and Africa Autonomous Underwater Vehicles Sales by Country (2016-2027)
11.4.2 Middle East and Africa Autonomous Underwater Vehicles Revenue by Country (2016-2027)
11.4.3 Turkey
11.4.4 Saudi Arabia
11.4.5 UAE
12 Company Profiles
12.1 Kongsberg Maritime
12.1.1 Kongsberg Maritime Corporation Information
12.1.2 Kongsberg Maritime Overview
12.1.3 Kongsberg Maritime Autonomous Underwater Vehicles Sales, Revenue, Price and Gross Margin (2016-2021)
12.1.4 Kongsberg Maritime Autonomous Underwater Vehicles Products and Services
12.1.5 Kongsberg Maritime Autonomous Underwater Vehicles SWOT Analysis
12.1.6 Kongsberg Maritime Recent Developments
12.2 OceanServer Technology
12.2.1 OceanServer Technology Corporation Information
12.2.2 OceanServer Technology Overview
12.2.3 OceanServer Technology Autonomous Underwater Vehicles Sales, Revenue, Price and Gross Margin (2016-2021)
12.2.4 OceanServer Technology Autonomous Underwater Vehicles Products and Services
12.2.5 OceanServer Technology Autonomous Underwater Vehicles SWOT Analysis
12.2.6 OceanServer Technology Recent Developments
12.3 Teledyne Gavia
12.3.1 Teledyne Gavia Corporation Information
12.3.2 Teledyne Gavia Overview
12.3.3 Teledyne Gavia Autonomous Underwater Vehicles Sales, Revenue, Price and Gross Margin (2016-2021)
12.3.4 Teledyne Gavia Autonomous Underwater Vehicles Products and Services
12.3.5 Teledyne Gavia Autonomous Underwater Vehicles SWOT Analysis
12.3.6 Teledyne Gavia Recent Developments
12.4 Bluefin Robotics
12.4.1 Bluefin Robotics Corporation Information
12.4.2 Bluefin Robotics Overview
12.4.3 Bluefin Robotics Autonomous Underwater Vehicles Sales, Revenue, Price and Gross Margin (2016-2021)
12.4.4 Bluefin Robotics Autonomous Underwater Vehicles Products and Services
12.4.5 Bluefin Robotics Autonomous Underwater Vehicles SWOT Analysis
12.4.6 Bluefin Robotics Recent Developments
12.5 Atlas Elektronik
12.5.1 Atlas Elektronik Corporation Information
12.5.2 Atlas Elektronik Overview
12.5.3 Atlas Elektronik Autonomous Underwater Vehicles Sales, Revenue, Price and Gross Margin (2016-2021)
12.5.4 Atlas Elektronik Autonomous Underwater Vehicles Products and Services
12.5.5 Atlas Elektronik Autonomous Underwater Vehicles SWOT Analysis
12.5.6 Atlas Elektronik Recent Developments
12.6 ISE Ltd
12.6.1 ISE Ltd Corporation Information
12.6.2 ISE Ltd Overview
12.6.3 ISE Ltd Autonomous Underwater Vehicles Sales, Revenue, Price and Gross Margin (2016-2021)
12.6.4 ISE Ltd Autonomous Underwater Vehicles Products and Services
12.6.5 ISE Ltd Autonomous Underwater Vehicles SWOT Analysis
12.6.6 ISE Ltd Recent Developments
12.7 JAMSTEC
12.7.1 JAMSTEC Corporation Information
12.7.2 JAMSTEC Overview
12.7.3 JAMSTEC Autonomous Underwater Vehicles Sales, Revenue, Price and Gross Margin (2016-2021)
12.7.4 JAMSTEC Autonomous Underwater Vehicles Products and Services
12.7.5 JAMSTEC Autonomous Underwater Vehicles SWOT Analysis
12.7.6 JAMSTEC Recent Developments
12.8 ECA SA
12.8.1 ECA SA Corporation Information
12.8.2 ECA SA Overview
12.8.3 ECA SA Autonomous Underwater Vehicles Sales, Revenue, Price and Gross Margin (2016-2021)
12.8.4 ECA SA Autonomous Underwater Vehicles Products and Services
12.8.5 ECA SA Autonomous Underwater Vehicles SWOT Analysis
12.8.6 ECA SA Recent Developments
12.9 SAAB Group
12.9.1 SAAB Group Corporation Information
12.9.2 SAAB Group Overview
12.9.3 SAAB Group Autonomous Underwater Vehicles Sales, Revenue, Price and Gross Margin (2016-2021)
12.9.4 SAAB Group Autonomous Underwater Vehicles Products and Services
12.9.5 SAAB Group Autonomous Underwater Vehicles SWOT Analysis
12.9.6 SAAB Group Recent Developments
12.10 Falmouth Scientific
12.10.1 Falmouth Scientific Corporation Information
12.10.2 Falmouth Scientific Overview
12.10.3 Falmouth Scientific Autonomous Underwater Vehicles Sales, Revenue, Price and Gross Margin (2016-2021)
12.10.4 Falmouth Scientific Autonomous Underwater Vehicles Products and Services
12.10.5 Falmouth Scientific Autonomous Underwater Vehicles SWOT Analysis
12.10.6 Falmouth Scientific Recent Developments
12.11 Tianjin Sublue
12.11.1 Tianjin Sublue Corporation Information
12.11.2 Tianjin Sublue Overview
12.11.3 Tianjin Sublue Autonomous Underwater Vehicles Sales, Revenue, Price and Gross Margin (2016-2021)
12.11.4 Tianjin Sublue Autonomous Underwater Vehicles Products and Services
12.11.5 Tianjin Sublue Recent Developments
13 Value Chain and Sales Channels Analysis
13.1 Autonomous Underwater Vehicles Value Chain Analysis
13.2 Autonomous Underwater Vehicles Key Raw Materials
13.2.1 Key Raw Materials
13.2.2 Raw Materials Key Suppliers
13.3 Autonomous Underwater Vehicles Production Mode & Process
13.4 Autonomous Underwater Vehicles Sales and Marketing
13.4.1 Autonomous Underwater Vehicles Sales Channels
13.4.2 Autonomous Underwater Vehicles Distributors
13.5 Autonomous Underwater Vehicles Customers
14 Key Findings
15 Appendix
15.1 Research Methodology
15.1.1 Methodology/Research Approach
15.1.2 Data Source
15.2 Author Details
15.3 Disclaimer
List of Tables
Table 1. Global Autonomous Underwater Vehicles Market Size Growth Rate by Type: 2016 VS 2021 VS 2027 (US$ Million)
Table 2. Major Manufacturers of Shallow AUV (Depth up to 100 m)
Table 3. Major Manufacturers of Medium AUVs (Depth up to 1000 m)
Table 4. Major Manufacturers of Large AUVs (Depth more than 1000 m)
Table 5. Global Autonomous Underwater Vehicles Market Size Growth Rate by Application: 2016 VS 2021 VS 2027 (US$ Million)
Table 6. Global Autonomous Underwater Vehicles Production by Region: 2016 VS 2021 VS 2027 (K Units)
Table 7. Global Autonomous Underwater Vehicles Production by Region (2016-2021) & (K Units)
Table 8. Global Autonomous Underwater Vehicles Production Market Share by Region (2016-2021)
Table 9. Global Autonomous Underwater Vehicles Production by Region (2022-2027) & (K Units)
Table 10. Global Autonomous Underwater Vehicles Production Market Share by Region (2022-2027)
Table 11. Autonomous Underwater Vehicles Market Trends
Table 12. Autonomous Underwater Vehicles Market Drivers
Table 13. Autonomous Underwater Vehicles Market Challenges
Table 14. Autonomous Underwater Vehicles Market Restraints
Table 15. Global Autonomous Underwater Vehicles Revenue by Region: 2016 VS 2021 VS 2027 (US$ Million)
Table 16. Global Autonomous Underwater Vehicles Sales by Region (2016-2021) & (K Units)
Table 17. Global Autonomous Underwater Vehicles Sales Market Share by Region (2016-2021)
Table 18. Global Autonomous Underwater Vehicles Sales by Region (2022-2027) & (K Units)
Table 19. Global Autonomous Underwater Vehicles Sales Market Share by Region (2022-2027)
Table 20. Global Autonomous Underwater Vehicles Revenue by Region (2016-2021) & (US$ Million)
Table 21. Global Autonomous Underwater Vehicles Revenue Market Share by Region (2016-2021)
Table 22. Global Autonomous Underwater Vehicles Revenue by Region (2022-2027) & (US$ Million)
Table 23. Global Autonomous Underwater Vehicles Revenue Market Share by Region (2022-2027)
Table 24. Global Autonomous Underwater Vehicles Production Capacity by Manufacturers (2016-2021) & (K Units)
Table 25. Global Autonomous Underwater Vehicles Capacity Market Share by Manufacturers (2016-2021)
Table 26. Global Autonomous Underwater Vehicles Production by Manufacturers (2016-2021) & (K Units)
Table 27. Global Autonomous Underwater Vehicles Production Market Share by Manufacturers (2016-2021)
Table 28. Global Autonomous Underwater Vehicles Sales by Manufacturers (2016-2021) & (K Units)
Table 29. Global Autonomous Underwater Vehicles Sales Share by Manufacturers (2016-2021)
Table 30. Global Autonomous Underwater Vehicles Revenue by Manufacturers (2016-2021) & (US$ Million)
Table 31. Global Autonomous Underwater Vehicles Revenue Share by Manufacturers (2016-2021)
Table 32. Autonomous Underwater Vehicles Price by Manufacturers 2016-2021 (USD/Unit)
Table 33. Global Autonomous Underwater Vehicles Manufacturers Market Concentration Ratio (CR5 and HHI)
Table 34. Global Autonomous Underwater Vehicles by Company Type (Tier 1, Tier 2 and Tier 3) (based on the Revenue in Autonomous Underwater Vehicles as of 2020)
Table 35. Autonomous Underwater Vehicles Manufacturing Base Distribution and Headquarters
Table 36. Manufacturers Autonomous Underwater Vehicles Product Offered
Table 37. Date of Key Manufacturers Enter into Autonomous Underwater Vehicles Market
Table 38. Mergers & Acquisitions, Expansion Plans
Table 39. Global Autonomous Underwater Vehicles Sales by Type (2016-2021) & (K Units)
Table 40. Global Autonomous Underwater Vehicles Sales by Type (2022-2027) & (K Units)
Table 41. Global Autonomous Underwater Vehicles Sales Share by Type (2016-2021)
Table 42. Global Autonomous Underwater Vehicles Sales Share by Type (2022-2027)
Table 43. Global Autonomous Underwater Vehicles Revenue by Type (2016-2021) & (US$ Million)
Table 44. Global Autonomous Underwater Vehicles Revenue by Type (2022-2027) & (US$ Million)
Table 45. Global Autonomous Underwater Vehicles Revenue Share by Type (2016-2021)
Table 46. Global Autonomous Underwater Vehicles Revenue Share by Type (2022-2027)
Table 47. Autonomous Underwater Vehicles Price by Type (2016-2021) & (USD/Unit)
Table 48. Global Autonomous Underwater Vehicles Price Forecast by Type (2022-2027) & (USD/Unit)
Table 49. Global Autonomous Underwater Vehicles Sales by Application (2016-2021) & (K Units)
Table 50. Global Autonomous Underwater Vehicles Sales by Application (2022-2027) & (K Units)
Table 51. Global Autonomous Underwater Vehicles Sales Share by Application (2016-2021)
Table 52. Global Autonomous Underwater Vehicles Sales Share by Application (2022-2027)
Table 53. Global Autonomous Underwater Vehicles Revenue by Application (2016-2021) & (US$ Million)
Table 54. Global Autonomous Underwater Vehicles Revenue by Application (2022-2027) & (US$ Million)
Table 55. Global Autonomous Underwater Vehicles Revenue Share by Application (2016-2021)
Table 56. Global Autonomous Underwater Vehicles Revenue Share by Application (2022-2027)
Table 57. Autonomous Underwater Vehicles Price by Application (2016-2021) & (USD/Unit)
Table 58. Global Autonomous Underwater Vehicles Price Forecast by Application (2022-2027) & (USD/Unit)
Table 59. North America Autonomous Underwater Vehicles Sales by Company (2016-2021) & (K Units)
Table 60. North America Autonomous Underwater Vehicles Sales Market Share by Company (2016-2021)
Table 61. North America Autonomous Underwater Vehicles Revenue by Company (2016-2021) & (US$ Million)
Table 62. North America Autonomous Underwater Vehicles Revenue Market Share by Company (2016-2021)
Table 63. North America Autonomous Underwater Vehicles Sales by Type (2016-2021) & (K Units)
Table 64. North America Autonomous Underwater Vehicles Sales by Type (2022-2027) & (K Units)
Table 65. North America Autonomous Underwater Vehicles Revenue by Type (2016-2021) & (US$ Million)
Table 66. North America Autonomous Underwater Vehicles Revenue by Type (2022-2027) & (US$ Million)
Table 67. North America Autonomous Underwater Vehicles Sales by Application (2016-2021) & (K Units)
Table 68. North America Autonomous Underwater Vehicles Sales by Application (2022-2027) & (K Units)
Table 69. North America Autonomous Underwater Vehicles Revenue by Application (2016-2021) & (US$ Million)
Table 70. North America Autonomous Underwater Vehicles Revenue by Application (2022-2027) & (US$ Million)
Table 71. North America Autonomous Underwater Vehicles Sales by Country (2016-2021) & (K Units)
Table 72. North America Autonomous Underwater Vehicles Sales by Country (2022-2027) & (K Units)
Table 73. North America Autonomous Underwater Vehicles Revenue by Country (2016-2021) & (US$ Million)
Table 74. North America Autonomous Underwater Vehicles Revenue by Country (2022-2027) & (US$ Million)
Table 75. Europe Autonomous Underwater Vehicles Sales by Company (2016-2021) & (K Units)
Table 76. Europe Autonomous Underwater Vehicles Sales Market Share by Company (2016-2021)
Table 77. Europe Autonomous Underwater Vehicles Revenue by Company (2016-2021) & (US$ Million)
Table 78. Europe Autonomous Underwater Vehicles Revenue Market Share by Company (2016-2021)
Table 79. Europe Autonomous Underwater Vehicles Sales by Type (2016-2021) & (K Units)
Table 80. Europe Autonomous Underwater Vehicles Sales by Type (2022-2027) & (K Units)
Table 81. Europe Autonomous Underwater Vehicles Revenue by Type (2016-2021) & (US$ Million)
Table 82. Europe Autonomous Underwater Vehicles Revenue by Type (2022-2027) & (US$ Million)
Table 83. Europe Autonomous Underwater Vehicles Sales by Application (2016-2021) & (K Units)
Table 84. Europe Autonomous Underwater Vehicles Sales by Application (2022-2027) & (K Units)
Table 85. Europe Autonomous Underwater Vehicles Revenue by Application (2016-2021) & (US$ Million)
Table 86. Europe Autonomous Underwater Vehicles Revenue by Application (2022-2027) & (US$ Million)
Table 87. Europe Autonomous Underwater Vehicles Sales by Country (2016-2021) & (K Units)
Table 88. Europe Autonomous Underwater Vehicles Sales by Country (2022-2027) & (K Units)
Table 89. Europe Autonomous Underwater Vehicles Revenue by Country (2016-2021) & (US$ Million)
Table 90. Europe Autonomous Underwater Vehicles Revenue by Country (2022-2027) & (US$ Million)
Table 91. Asia Pacific Autonomous Underwater Vehicles Sales by Company (2016-2021) & (K Units)
Table 92. Asia Pacific Autonomous Underwater Vehicles Sales Market Share by Company (2016-2021)
Table 93. Asia Pacific Autonomous Underwater Vehicles Revenue by Company (2016-2021) & (US$ Million)
Table 94. Asia Pacific Autonomous Underwater Vehicles Revenue Market Share by Company (2016-2021)
Table 95. Asia Pacific Autonomous Underwater Vehicles Sales by Type (2016-2021) & (K Units)
Table 96. Asia Pacific Autonomous Underwater Vehicles Sales by Type (2022-2027) & (K Units)
Table 97. Asia Pacific Autonomous Underwater Vehicles Revenue by Type (2016-2021) & (US$ Million)
Table 98. Asia Pacific Autonomous Underwater Vehicles Revenue by Type (2022-2027) & (US$ Million)
Table 99. Asia Pacific Autonomous Underwater Vehicles Sales by Application (2016-2021) & (K Units)
Table 100. Asia Pacific Autonomous Underwater Vehicles Sales by Application (2022-2027) & (K Units)
Table 101. Asia Pacific Autonomous Underwater Vehicles Revenue by Application (2016-2021) & (US$ Million)
Table 102. Asia Pacific Autonomous Underwater Vehicles Revenue by Application (2022-2027) & (US$ Million)
Table 103. Asia Pacific Autonomous Underwater Vehicles Sales by Region (2016-2021) & (K Units)
Table 104. Asia Pacific Autonomous Underwater Vehicles Sales by Region (2022-2027) & (K Units)
Table 105. Asia Pacific Autonomous Underwater Vehicles Revenue by Region (2016-2021) & (US$ Million)
Table 106. Asia Pacific Autonomous Underwater Vehicles Revenue by Region (2022-2027) & (US$ Million)
Table 107. Latin America Autonomous Underwater Vehicles Sales by Company (2016-2021) & (K Units)
Table 108. Latin America Autonomous Underwater Vehicles Sales Market Share by Company (2016-2021)
Table 109. Latin America Autonomous Underwater Vehicles Revenue by Company (2016-2021) & (US$ Million)
Table 110. Latin America Autonomous Underwater Vehicles Revenue Market Share by Company (2016-2021)
Table 111. Latin America Autonomous Underwater Vehicles Sales by Type (2016-2021) & (K Units)
Table 112. Latin America Autonomous Underwater Vehicles Sales by Type (2022-2027) & (K Units)
Table 113. Latin America Autonomous Underwater Vehicles Revenue by Type (2016-2021) & (US$ Million)
Table 114. Latin America Autonomous Underwater Vehicles Revenue by Type (2022-2027) & (US$ Million)
Table 115. Latin America Autonomous Underwater Vehicles Sales by Application (2016-2021) & (K Units)
Table 116. Latin America Autonomous Underwater Vehicles Sales by Application (2022-2027) & (K Units)
Table 117. Latin America Autonomous Underwater Vehicles Revenue by Application (2016-2021) & (US$ Million)
Table 118. Latin America Autonomous Underwater Vehicles Revenue by Application (2022-2027) & (US$ Million)
Table 119. Latin America Autonomous Underwater Vehicles Sales by Country (2016-2021) & (K Units)
Table 120. Latin America Autonomous Underwater Vehicles Sales by Country (2022-2027) & (K Units)
Table 121. Latin America Autonomous Underwater Vehicles Revenue by Country (2016-2021) & (US$ Million)
Table 122. Latin America Autonomous Underwater Vehicles Revenue by Country (2022-2027) & (US$ Million)
Table 123. Middle East and Africa Autonomous Underwater Vehicles Sales by Company (2016-2021) & (K Units)
Table 124. Middle East and Africa Autonomous Underwater Vehicles Sales Market Share by Company (2016-2021)
Table 125. Middle East and Africa Autonomous Underwater Vehicles Revenue by Company (2016-2021) & (US$ Million)
Table 126. Middle East and Africa Autonomous Underwater Vehicles Revenue Market Share by Company (2016-2021)
Table 127. Middle East and Africa Autonomous Underwater Vehicles Sales by Type (2016-2021) & (K Units)
Table 128. Middle East and Africa Autonomous Underwater Vehicles Sales by Type (2022-2027) & (K Units)
Table 129. Middle East and Africa Autonomous Underwater Vehicles Revenue by Type (2016-2021) & (US$ Million)
Table 130. Middle East and Africa Autonomous Underwater Vehicles Revenue by Type (2022-2027) & (US$ Million)
Table 131. Middle East and Africa Autonomous Underwater Vehicles Sales by Application (2016-2021) & (K Units)
Table 132. Middle East and Africa Autonomous Underwater Vehicles Sales by Application (2022-2027) & (K Units)
Table 133. Middle East and Africa Autonomous Underwater Vehicles Revenue by Application (2016-2021) & (US$ Million)
Table 134. Middle East and Africa Autonomous Underwater Vehicles Revenue by Application (2022-2027) & (US$ Million)
Table 135. Middle East and Africa Autonomous Underwater Vehicles Sales by Country (2016-2021) & (K Units)
Table 136. Middle East and Africa Autonomous Underwater Vehicles Sales by Country (2022-2027) & (K Units)
Table 137. Middle East and Africa Autonomous Underwater Vehicles Revenue by Country (2016-2021) & (US$ Million)
Table 138. Middle East and Africa Autonomous Underwater Vehicles Revenue by Country (2022-2027) & (US$ Million)
Table 139. Kongsberg Maritime Corporation Information
Table 140. Kongsberg Maritime Description and Overview
Table 141. Kongsberg Maritime Autonomous Underwater Vehicles Sales (K Units), Revenue (US$ Million), Average Selling Price (ASP) & (USD/Unit) and Gross Margin (2016-2021)
Table 142. Kongsberg Maritime Autonomous Underwater Vehicles Products and Services
Table 143. Kongsberg Maritime Autonomous Underwater Vehicles SWOT Analysis
Table 144. Kongsberg Maritime Recent Development
Table 145. OceanServer Technology Corporation Information
Table 146. OceanServer Technology Description and Overview
Table 147. OceanServer Technology Autonomous Underwater Vehicles Sales (K Units), Revenue (US$ Million), Average Selling Price (ASP) & (USD/Unit) and Gross Margin (2016-2021)
Table 148. OceanServer Technology Autonomous Underwater Vehicles Products and Services
Table 149. OceanServer Technology Autonomous Underwater Vehicles SWOT Analysis
Table 150. OceanServer Technology Recent Development
Table 151. Teledyne Gavia Corporation Information
Table 152. Teledyne Gavia Description and Overview
Table 153. Teledyne Gavia Autonomous Underwater Vehicles Sales (K Units), Revenue (US$ Million), Average Selling Price (ASP) & (USD/Unit) and Gross Margin (2016-2021)
Table 154. Teledyne Gavia Autonomous Underwater Vehicles Products and Services
Table 155. Teledyne Gavia Autonomous Underwater Vehicles SWOT Analysis
Table 156. Teledyne Gavia Recent Development
Table 157. Bluefin Robotics Corporation Information
Table 158. Bluefin Robotics Description and Overview
Table 159. Bluefin Robotics Autonomous Underwater Vehicles Sales (K Units), Revenue (US$ Million), Average Selling Price (ASP) & (USD/Unit) and Gross Margin (2016-2021)
Table 160. Bluefin Robotics Autonomous Underwater Vehicles Products and Services
Table 161. Bluefin Robotics Autonomous Underwater Vehicles SWOT Analysis
Table 162. Bluefin Robotics Recent Development
Table 163. Atlas Elektronik Corporation Information
Table 164. Atlas Elektronik Description and Overview
Table 165. Atlas Elektronik Autonomous Underwater Vehicles Sales (K Units), Revenue (US$ Million), Average Selling Price (ASP) & (USD/Unit) and Gross Margin (2016-2021)
Table 166. Atlas Elektronik Autonomous Underwater Vehicles Products and Services
Table 167. Atlas Elektronik Autonomous Underwater Vehicles SWOT Analysis
Table 168. Atlas Elektronik Recent Development
Table 169. ISE Ltd Corporation Information
Table 170. ISE Ltd Description and Overview
Table 171. ISE Ltd Autonomous Underwater Vehicles Sales (K Units), Revenue (US$ Million), Average Selling Price (ASP) & (USD/Unit) and Gross Margin (2016-2021)
Table 172. ISE Ltd Autonomous Underwater Vehicles Products and Services
Table 173. ISE Ltd Autonomous Underwater Vehicles SWOT Analysis
Table 174. ISE Ltd Recent Development
Table 175. JAMSTEC Corporation Information
Table 176. JAMSTEC Description and Overview
Table 177. JAMSTEC Autonomous Underwater Vehicles Sales (K Units), Revenue (US$ Million), Average Selling Price (ASP) & (USD/Unit) and Gross Margin (2016-2021)
Table 178. JAMSTEC Autonomous Underwater Vehicles Products and Services
Table 179. JAMSTEC Autonomous Underwater Vehicles SWOT Analysis
Table 180. JAMSTEC Recent Development
Table 181. ECA SA Corporation Information
Table 182. ECA SA Description and Overview
Table 183. ECA SA Autonomous Underwater Vehicles Sales (K Units), Revenue (US$ Million), Average Selling Price (ASP) & (USD/Unit) and Gross Margin (2016-2021)
Table 184. ECA SA Autonomous Underwater Vehicles Products and Services
Table 185. ECA SA Autonomous Underwater Vehicles SWOT Analysis
Table 186. ECA SA Recent Development
Table 187. SAAB Group Corporation Information
Table 188. SAAB Group Description and Overview
Table 189. SAAB Group Autonomous Underwater Vehicles Sales (K Units), Revenue (US$ Million), Average Selling Price (ASP) & (USD/Unit) and Gross Margin (2016-2021)
Table 190. SAAB Group Autonomous Underwater Vehicles Products and Services
Table 191. SAAB Group Autonomous Underwater Vehicles SWOT Analysis
Table 192. SAAB Group Recent Development
Table 193. Falmouth Scientific Corporation Information
Table 194. Falmouth Scientific Description and Overview
Table 195. Falmouth Scientific Autonomous Underwater Vehicles Sales (K Units), Revenue (US$ Million), Average Selling Price (ASP) & (USD/Unit) and Gross Margin (2016-2021)
Table 196. Falmouth Scientific Autonomous Underwater Vehicles Products and Services
Table 197. Falmouth Scientific Autonomous Underwater Vehicles SWOT Analysis
Table 198. Falmouth Scientific Recent Development
Table 199. Tianjin Sublue Corporation Information
Table 200. Tianjin Sublue Description and Overview
Table 201. Tianjin Sublue Autonomous Underwater Vehicles Sales (K Units), Revenue (US$ Million), Average Selling Price (ASP) & (USD/Unit) and Gross Margin (2016-2021)
Table 202. Tianjin Sublue Autonomous Underwater Vehicles Products and Services
Table 203. Tianjin Sublue Recent Development
Table 204. Key Raw Materials Lists
Table 205. Raw Materials Key Suppliers Lists
Table 206. Autonomous Underwater Vehicles Distributors List
Table 207. Autonomous Underwater Vehicles Customers List
Table 208. Research Programs/Design for This Report
Table 209. Key Data Information from Secondary Sources
Table 210. Key Data Information from Primary Sources
List of Figures
Figure 1. Autonomous Underwater Vehicles Product Picture
Figure 2. Global Autonomous Underwater Vehicles Market Share by Type in 2020 & 2027
Figure 3. Shallow AUV (Depth up to 100 m) Product Picture
Figure 4. Medium AUVs (Depth up to 1000 m) Product Picture
Figure 5. Large AUVs (Depth more than 1000 m) Product Picture
Figure 6. Global Autonomous Underwater Vehicles Market Share by Application in 2020 & 2027
Figure 7. Defense
Figure 8. Scientific Research
Figure 9. Commercial
Figure 10. Global Autonomous Underwater Vehicles Capacity, Production and Utilization (2016-2027) & (K Units)
Figure 11. Global Autonomous Underwater Vehicles Production Market Share by Region in Percentage: 2020 Versus 2027
Figure 12. Global Autonomous Underwater Vehicles Production Market Share by Region (2016-2021)
Figure 13. Global Autonomous Underwater Vehicles Production Market Share by Region (2022-2027)
Figure 14. Autonomous Underwater Vehicles Production Growth Rate in North America (2016-2027) & (K Units)
Figure 15. Autonomous Underwater Vehicles Production Growth Rate in Europe (2016-2027) & (K Units)
Figure 16. Autonomous Underwater Vehicles Production Growth Rate in Japan (2016-2027) & (K Units)
Figure 17. Autonomous Underwater Vehicles Production Growth Rate in China (2016-2027) & (K Units)
Figure 18. Autonomous Underwater Vehicles Production Growth Rate in South Korea (2016-2027) & (K Units)
Figure 19. Autonomous Underwater Vehicles Production Growth Rate in India (2016-2027) & (K Units)
Figure 20. Global Autonomous Underwater Vehicles Sales 2016-2027 (K Units)
Figure 21. Global Autonomous Underwater Vehicles Revenue, (US$ Million), 2016 VS 2021 VS 2027
Figure 22. Global Autonomous Underwater Vehicles Revenue 2016-2027 (US$ Million)
Figure 23. Global Autonomous Underwater Vehicles Revenue Market Share by Region in Percentage: 2020 Versus 2027
Figure 24. Global Autonomous Underwater Vehicles Sales Market Share by Region (2016-2021)
Figure 25. Global Autonomous Underwater Vehicles Sales Market Share by Region (2022-2027)
Figure 26. North America Autonomous Underwater Vehicles Sales YoY (2016-2027) & (K Units)
Figure 27. North America Autonomous Underwater Vehicles Revenue YoY (2016-2027) & (US$ Million)
Figure 28. Europe Autonomous Underwater Vehicles Sales YoY (2016-2027) & (K Units)
Figure 29. Europe Autonomous Underwater Vehicles Revenue YoY (2016-2027) & (US$ Million)
Figure 30. Asia-Pacific Autonomous Underwater Vehicles Sales YoY (2016-2027) & (K Units)
Figure 31. Asia-Pacific Autonomous Underwater Vehicles Revenue YoY (2016-2027) & (US$ Million)
Figure 32. Latin America Autonomous Underwater Vehicles Sales YoY (2016-2027) & (K Units)
Figure 33. Latin America Autonomous Underwater Vehicles Revenue YoY (2016-2027) & (US$ Million)
Figure 34. Middle East & Africa Autonomous Underwater Vehicles Sales YoY (2016-2027) & (K Units)
Figure 35. Middle East & Africa Autonomous Underwater Vehicles Revenue YoY (2016-2027) & (US$ Million)
Figure 36. The Top 10 and Top 5 Players Market Share by Autonomous Underwater Vehicles Sales in 2020
Figure 37. The Top 10 and Top 5 Players Market Share by Autonomous Underwater Vehicles Revenue in 2020
Figure 38. Autonomous Underwater Vehicles Market Share by Company Type (Tier 1, Tier 2, and Tier 3): 2016 VS 2020
Figure 39. Global Autonomous Underwater Vehicles Sales Market Share by Type (2016-2027)
Figure 40. Global Autonomous Underwater Vehicles Revenue Market Share by Type (2016-2027)
Figure 41. Global Autonomous Underwater Vehicles Sales Market Share by Application (2016-2027)
Figure 42. Global Autonomous Underwater Vehicles Revenue Market Share by Application (2016-2027)
Figure 43. North America Autonomous Underwater Vehicles Sales Market Share by Type (2016-2027)
Figure 44. North America Autonomous Underwater Vehicles Revenue Market Share by Type (2016-2027)
Figure 45. North America Autonomous Underwater Vehicles Sales Market Share by Application (2016-2027)
Figure 46. North America Autonomous Underwater Vehicles Revenue Market Share by Application (2016-2027)
Figure 47. North America Autonomous Underwater Vehicles Sales Share by Country (2016-2027)
Figure 48. North America Autonomous Underwater Vehicles Revenue Share by Country (2016-2027)
Figure 49. U.S. Autonomous Underwater Vehicles Revenue (2016-2027) & (US$ Million)
Figure 50. Canada Autonomous Underwater Vehicles Revenue (2016-2027) & (US$ Million)
Figure 51. Europe Autonomous Underwater Vehicles Sales Market Share by Type (2016-2027)
Figure 52. Europe Autonomous Underwater Vehicles Revenue Market Share by Type (2016-2027)
Figure 53. Europe Autonomous Underwater Vehicles Sales Market Share by Application (2016-2027)
Figure 54. Europe Autonomous Underwater Vehicles Revenue Market Share by Application (2016-2027)
Figure 55. Europe Autonomous Underwater Vehicles Sales Share by Country (2016-2027)
Figure 56. Europe Autonomous Underwater Vehicles Revenue Share by Country (2016-2027)
Figure 57. Germany Autonomous Underwater Vehicles Revenue (2016-2027) & (US$ Million)
Figure 58. France Autonomous Underwater Vehicles Revenue (2016-2027) & (US$ Million)
Figure 59. U.K. Autonomous Underwater Vehicles Revenue (2016-2027) & (US$ Million)
Figure 60. Italy Autonomous Underwater Vehicles Revenue (2016-2027) & (US$ Million)
Figure 61. Russia Autonomous Underwater Vehicles Revenue (2016-2027) & (US$ Million)
Figure 62. Asia-Pacific Autonomous Underwater Vehicles Sales Market Share by Type (2016-2027)
Figure 63. Asia-Pacific Autonomous Underwater Vehicles Revenue Market Share by Type (2016-2027)
Figure 64. Asia-Pacific Autonomous Underwater Vehicles Sales Market Share by Application (2016-2027)
Figure 65. Asia-Pacific Autonomous Underwater Vehicles Revenue Market Share by Application (2016-2027)
Figure 66. Asia-Pacific Autonomous Underwater Vehicles Sales Share by Region (2016-2027)
Figure 67. Asia-Pacific Autonomous Underwater Vehicles Revenue Share by Region (2016-2027)
Figure 68. China Autonomous Underwater Vehicles Revenue (2016-2027) & (US$ Million)
Figure 69. Japan Autonomous Underwater Vehicles Revenue (2016-2027) & (US$ Million)
Figure 70. South Korea Autonomous Underwater Vehicles Revenue (2016-2027) & (US$ Million)
Figure 71. India Autonomous Underwater Vehicles Revenue (2016-2027) & (US$ Million)
Figure 72. Australia Autonomous Underwater Vehicles Revenue (2016-2027) & (US$ Million)
Figure 73. Taiwan Autonomous Underwater Vehicles Revenue (2016-2027) & (US$ Million)
Figure 74. Indonesia Autonomous Underwater Vehicles Revenue (2016-2027) & (US$ Million)
Figure 75. Thailand Autonomous Underwater Vehicles Revenue (2016-2027) & (US$ Million)
Figure 76. Malaysia Autonomous Underwater Vehicles Revenue (2016-2027) & (US$ Million)
Figure 77. Philippines Autonomous Underwater Vehicles Revenue (2016-2027) & (US$ Million)
Figure 78. Latin America Autonomous Underwater Vehicles Sales Market Share by Type (2016-2027)
Figure 79. Latin America Autonomous Underwater Vehicles Revenue Market Share by Type (2016-2027)
Figure 80. Latin America Autonomous Underwater Vehicles Sales Market Share by Application (2016-2027)
Figure 81. Latin America Autonomous Underwater Vehicles Revenue Market Share by Application (2016-2027)
Figure 82. Latin America Autonomous Underwater Vehicles Sales Share by Country (2016-2027)
Figure 83. Latin America Autonomous Underwater Vehicles Revenue Share by Country (2016-2027)
Figure 84. Mexico Autonomous Underwater Vehicles Revenue (2016-2027) & (US$ Million)
Figure 85. Brazil Autonomous Underwater Vehicles Revenue (2016-2027) & (US$ Million)
Figure 86. Argentina Autonomous Underwater Vehicles Revenue (2016-2027) & (US$ Million)
Figure 87. Middle East & Africa Autonomous Underwater Vehicles Sales Market Share by Type (2016-2027)
Figure 88. Middle East & Africa Autonomous Underwater Vehicles Revenue Market Share by Type (2016-2027)
Figure 89. Middle East & Africa Autonomous Underwater Vehicles Sales Market Share by Application (2016-2027)
Figure 90. Middle East & Africa Autonomous Underwater Vehicles Revenue Market Share by Application (2016-2027)
Figure 91. Middle East & Africa Autonomous Underwater Vehicles Sales Share by Country (2016-2027)
Figure 92. Middle East & Africa Autonomous Underwater Vehicles Revenue Share by Country (2016-2027)
Figure 93. Turkey Autonomous Underwater Vehicles Revenue (2016-2027) & (US$ Million)
Figure 94. Saudi Arabia Autonomous Underwater Vehicles Revenue (2016-2027) & (US$ Million)
Figure 95. UAE Autonomous Underwater Vehicles Revenue (2016-2027) & (US$ Million)
Figure 96. Autonomous Underwater Vehicles Value Chain
Figure 97. Channels of Distribution
Figure 98. Distributors Profiles
Figure 99. Bottom-up and Top-down Approaches for This Report
Figure 100. Data Triangulation
Figure 101. Key Executives Interviewed
$2900
$4350
$5800
HAVE A QUERY?
OUR CUSTOMER
