List of Tables
Table 1. Global Embodied Intelligent Inertial Measurement Unit (IMU) Market Size Growth Rate by Type (2026-2032) & (US$ Million)
Table 2. Key Players of Consumer Level
Table 3. Key Players of Tactical Level
Table 4. Key Players of Navigation Level
Table 5. Global Embodied Intelligent Inertial Measurement Unit (IMU) Market Size Growth by Application (2026-2032) & (US$ Million)
Table 6. Global Embodied Intelligent Inertial Measurement Unit (IMU) Market Size by Region (2026-2032) & (US$ Million)
Table 7. Global Embodied Intelligent Inertial Measurement Unit (IMU) Market Size by Region (2026-2032) & (US$ Million)
Table 8. Global Embodied Intelligent Inertial Measurement Unit (IMU) Market Share by Region (2026-2032)
Table 9. Market Top Trends
Table 10. Market Use Cases
Table 11. Global Embodied Intelligent Inertial Measurement Unit (IMU) Revenue by Players (2026 & 2032) & (US$ Million)
Table 12. Global Embodied Intelligent Inertial Measurement Unit (IMU) Market Share by Players (2026 & 2032)
Table 13. Key Players Headquarters and Area Served
Table 14. Key Players Embodied Intelligent Inertial Measurement Unit (IMU) Product/Solution/Service
Table 15. Date of Enter into Embodied Intelligent Inertial Measurement Unit (IMU) Market
Table 16. Mergers & Acquisitions, Expansion Plans
Table 17. Global Embodied Intelligent Inertial Measurement Unit (IMU) Market Size by Type (2026-2032) & (US$ Million)
Table 18. Global Embodied Intelligent Inertial Measurement Unit (IMU) Market Size Share by Type (2026-2032)
Table 19. Global Embodied Intelligent Inertial Measurement Unit (IMU) Market Size by Application (2026-2032) & (US$ Million)
Table 20. Global Embodied Intelligent Inertial Measurement Unit (IMU) Market Size Share by Application (2026-2032)
Table 21. North America Key Players Embodied Intelligent Inertial Measurement Unit (IMU) Revenue (2026 & 2032) & (US$ Million)
Table 22. North America Key Players Embodied Intelligent Inertial Measurement Unit (IMU) Market Share (2026 & 2032)
Table 23. North America Embodied Intelligent Inertial Measurement Unit (IMU) Market Size by Type (2026-2032) & (US$ Million)
Table 24. North America Embodied Intelligent Inertial Measurement Unit (IMU) Market Share by Type (2026-2032)
Table 25. North America Embodied Intelligent Inertial Measurement Unit (IMU) Market Size by Application (2026-2032) & (US$ Million)
Table 26. North America Embodied Intelligent Inertial Measurement Unit (IMU) Market Share by Application (2026-2032)
Table 27. Europe Key Players Embodied Intelligent Inertial Measurement Unit (IMU) Revenue (2026 & 2032) & (US$ Million)
Table 28. Europe Key Players Embodied Intelligent Inertial Measurement Unit (IMU) Market Share (2026 & 2032)
Table 29. Europe Embodied Intelligent Inertial Measurement Unit (IMU) Market Size by Type (2026-2032) & (US$ Million)
Table 30. Europe Embodied Intelligent Inertial Measurement Unit (IMU) Market Share by Type (2026-2032)
Table 31. Europe Embodied Intelligent Inertial Measurement Unit (IMU) Market Size by Application (2026-2032) & (US$ Million)
Table 32. Europe Embodied Intelligent Inertial Measurement Unit (IMU) Market Share by Application (2026-2032)
Table 33. China Key Players Embodied Intelligent Inertial Measurement Unit (IMU) Revenue (2026 & 2032) & (US$ Million)
Table 34. China Key Players Embodied Intelligent Inertial Measurement Unit (IMU) Market Share (2026 & 2032)
Table 35. China Embodied Intelligent Inertial Measurement Unit (IMU) Market Size by Type (2026-2032) & (US$ Million)
Table 36. China Embodied Intelligent Inertial Measurement Unit (IMU) Market Share by Type (2026-2032)
Table 37. China Embodied Intelligent Inertial Measurement Unit (IMU) Market Size by Application (2026-2032) & (US$ Million)
Table 38. China Embodied Intelligent Inertial Measurement Unit (IMU) Market Share by Application (2026-2032)
Table 39. Key Players in Japan
Table 40. Bosch Company Details
Table 41. Bosch Description and Business Overview
Table 42. Bosch Embodied Intelligent Inertial Measurement Unit (IMU) Product
Table 43. Bosch Revenue in Embodied Intelligent Inertial Measurement Unit (IMU) Business: 2026 & 2032
Table 44. Bosch Recent Development
Table 45. ST Company Details
Table 46. ST Description and Business Overview
Table 47. ST Embodied Intelligent Inertial Measurement Unit (IMU) Product
Table 48. ST Revenue in Embodied Intelligent Inertial Measurement Unit (IMU) Business: 2026 & 2032
Table 49. ST Recent Development
Table 50. Murata Company Details
Table 51. Murata Description and Business Overview
Table 52. Murata Embodied Intelligent Inertial Measurement Unit (IMU) Product
Table 53. Murata Revenue in Embodied Intelligent Inertial Measurement Unit (IMU) Business: 2026 & 2032
Table 54. Murata Recent Development
Table 55. Honeywell Company Details
Table 56. Honeywell Description and Business Overview
Table 57. Honeywell Embodied Intelligent Inertial Measurement Unit (IMU) Product
Table 58. Honeywell Revenue in Embodied Intelligent Inertial Measurement Unit (IMU) Business: 2026 & 2032
Table 59. Honeywell Recent Development
Table 60. NXP Company Details
Table 61. NXP Description and Business Overview
Table 62. NXP Embodied Intelligent Inertial Measurement Unit (IMU) Product
Table 63. NXP Revenue in Embodied Intelligent Inertial Measurement Unit (IMU) Business: 2026 & 2032
Table 64. NXP Recent Development
Table 65. ADI Company Details
Table 66. ADI Description and Business Overview
Table 67. ADI Embodied Intelligent Inertial Measurement Unit (IMU) Product
Table 68. ADI Revenue in Embodied Intelligent Inertial Measurement Unit (IMU) Business: 2026 & 2032
Table 69. ADI Recent Development
Table 70. TDK Company Details
Table 71. TDK Description and Business Overview
Table 72. TDK Embodied Intelligent Inertial Measurement Unit (IMU) Product
Table 73. TDK Revenue in Embodied Intelligent Inertial Measurement Unit (IMU) Business: 2026 & 2032
Table 74. TDK Recent Development
Table 75. Northrop Grumman Litef Company Details
Table 76. Northrop Grumman Litef Description and Business Overview
Table 77. Northrop Grumman Litef Embodied Intelligent Inertial Measurement Unit (IMU) Product
Table 78. Northrop Grumman Litef Revenue in Embodied Intelligent Inertial Measurement Unit (IMU) Business: 2026 & 2032
Table 79. Northrop Grumman Litef Recent Development
Table 80. Safran Company Details
Table 81. Safran Description and Business Overview
Table 82. Safran Embodied Intelligent Inertial Measurement Unit (IMU) Product
Table 83. Safran Revenue in Embodied Intelligent Inertial Measurement Unit (IMU) Business: 2026 & 2032
Table 84. Safran Recent Development
Table 85. Embodied Intelligent Inertial Measurement Unit (IMU) Market Trends
Table 86. Embodied Intelligent Inertial Measurement Unit (IMU) Market Drivers
Table 87. Embodied Intelligent Inertial Measurement Unit (IMU) Market Challenges
Table 88. Embodied Intelligent Inertial Measurement Unit (IMU) Market Restraints
Table 89. Research Programs/Design for This Report
Table 90. Key Data Information from Secondary Sources
Table 91. Key Data Information from Primary Sources
List of Figures
Figure 1. Global Embodied Intelligent Inertial Measurement Unit (IMU) Market Share by Type in 2026 & 2032
Figure 2. Consumer Level Features
Figure 3. Tactical Level Features
Figure 4. Navigation Level Features
Figure 5. Global Embodied Intelligent Inertial Measurement Unit (IMU) Market Share by Application in 2026 & 2032
Figure 6. National Defense Case Studies
Figure 7. Aerospace Case Studies
Figure 8. Medical Case Studies
Figure 9. Automobile Case Studies
Figure 10. Consumer Electronics Case Studies
Figure 11. Others Case Studies
Figure 12. Embodied Intelligent Inertial Measurement Unit (IMU) Report Years Considered
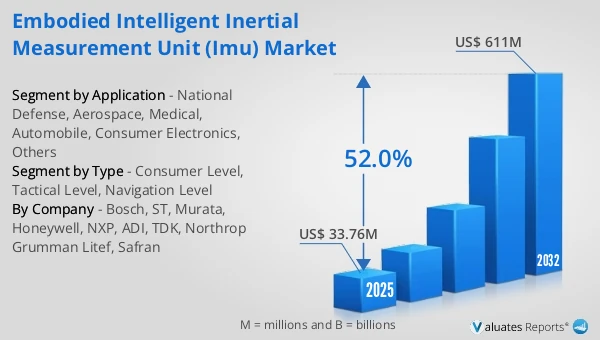
Figure 13. Global Embodied Intelligent Inertial Measurement Unit (IMU) Market Size and Growth Rate 2026-2032 (US$ Million)
Figure 14. Global Embodied Intelligent Inertial Measurement Unit (IMU) Market Share by Region (2026-2032)
Figure 15. Global Embodied Intelligent Inertial Measurement Unit (IMU) Market Size Market Share by Type (2026-2032)
Figure 16. North America Embodied Intelligent Inertial Measurement Unit (IMU) Market Size 2026-2032 (US$ Million)
Figure 17. Europe Embodied Intelligent Inertial Measurement Unit (IMU) Market Size 2026-2032 (US$ Million)
Figure 18. China Embodied Intelligent Inertial Measurement Unit (IMU) Market Size 2026-2032 (US$ Million)
Figure 19. Embodied Intelligent Inertial Measurement Unit (IMU) Market Size in Japan (2026-2032) & (US$ Million)
Figure 20. Bottom-up and Top-down Approaches for This Report
Figure 21. Data Triangulation
Figure 22. Key Executives Interviewed