List of Tables
Table 1. Global Contract Blending Services Market Size Growth Rate by Type (US$ Million), 2019 VS 2023 VS 2030
Table 2. Key Players of Dry Blends
Table 3. Key Players of Product Blends
Table 4. Key Players of Multiple Component Blends
Table 5. Global Contract Blending Services Market Size Growth Rate by Application (US$ Million), 2019 VS 2023 VS 2030
Table 6. Global Contract Blending Services Market Size Growth Rate (CAGR) by Region (US$ Million): 2019 VS 2023 VS 2030
Table 7. Global Contract Blending Services Market Size by Region (2019-2024) & (US$ Million)
Table 8. Global Contract Blending Services Market Share by Region (2019-2024)
Table 9. Global Contract Blending Services Forecasted Market Size by Region (2025-2030) & (US$ Million)
Table 10. Global Contract Blending Services Market Share by Region (2025-2030)
Table 11. Contract Blending Services Market Trends
Table 12. Contract Blending Services Market Drivers
Table 13. Contract Blending Services Market Challenges
Table 14. Contract Blending Services Market Restraints
Table 15. Global Contract Blending Services Revenue by Players (2019-2024) & (US$ Million)
Table 16. Global Contract Blending Services Revenue Share by Players (2019-2024)
Table 17. Global Top Contract Blending Services by Company Type (Tier 1, Tier 2, and Tier 3) & (based on the Revenue in Contract Blending Services as of 2023)
Table 18. Global Contract Blending Services Industry Ranking 2022 VS 2023 VS 2024
Table 19. Global 5 Largest Players Market Share by Contract Blending Services Revenue (CR5 and HHI) & (2019-2024)
Table 20. Global Key Players of Contract Blending Services, Headquarters and Area Served
Table 21. Global Key Players of Contract Blending Services, Product and Application
Table 22. Global Key Players of Contract Blending Services, Product and Application
Table 23. Mergers & Acquisitions, Expansion Plans
Table 24. Global Contract Blending Services Market Size by Type (2019-2024) & (US$ Million)
Table 25. Global Contract Blending Services Revenue Market Share by Type (2019-2024)
Table 26. Global Contract Blending Services Forecasted Market Size by Type (2025-2030) & (US$ Million)
Table 27. Global Contract Blending Services Revenue Market Share by Type (2025-2030)
Table 28. Global Contract Blending Services Market Size by Application (2019-2024) & (US$ Million)
Table 29. Global Contract Blending Services Revenue Share by Application (2019-2024)
Table 30. Global Contract Blending Services Forecasted Market Size by Application (2025-2030) & (US$ Million)
Table 31. Global Contract Blending Services Revenue Share by Application (2025-2030)
Table 32. North America Contract Blending Services Market Size by Type (2019-2024) & (US$ Million)
Table 33. North America Contract Blending Services Market Size by Type (2025-2030) & (US$ Million)
Table 34. North America Contract Blending Services Market Size by Application (2019-2024) & (US$ Million)
Table 35. North America Contract Blending Services Market Size by Application (2025-2030) & (US$ Million)
Table 36. North America Contract Blending Services Growth Rate (CAGR) by Country (US$ Million): 2019 VS 2023 VS 2030
Table 37. North America Contract Blending Services Market Size by Country (2019-2024) & (US$ Million)
Table 38. North America Contract Blending Services Market Size by Country (2025-2030) & (US$ Million)
Table 39. Europe Contract Blending Services Market Size by Type (2019-2024) & (US$ Million)
Table 40. Europe Contract Blending Services Market Size by Type (2025-2030) & (US$ Million)
Table 41. Europe Contract Blending Services Market Size by Application (2019-2024) & (US$ Million)
Table 42. Europe Contract Blending Services Market Size by Application (2025-2030) & (US$ Million)
Table 43. Europe Contract Blending Services Growth Rate (CAGR) by Country (US$ Million): 2019 VS 2023 VS 2030
Table 44. Europe Contract Blending Services Market Size by Country (2019-2024) & (US$ Million)
Table 45. Europe Contract Blending Services Market Size by Country (2025-2030) & (US$ Million)
Table 46. China Contract Blending Services Market Size by Type (2019-2024) & (US$ Million)
Table 47. China Contract Blending Services Market Size by Type (2025-2030) & (US$ Million)
Table 48. China Contract Blending Services Market Size by Application (2019-2024) & (US$ Million)
Table 49. China Contract Blending Services Market Size by Application (2025-2030) & (US$ Million)
Table 50. Asia Contract Blending Services Market Size by Type (2019-2024) & (US$ Million)
Table 51. Asia Contract Blending Services Market Size by Type (2025-2030) & (US$ Million)
Table 52. Asia Contract Blending Services Market Size by Application (2019-2024) & (US$ Million)
Table 53. Asia Contract Blending Services Market Size by Application (2025-2030) & (US$ Million)
Table 54. Asia Contract Blending Services Growth Rate (CAGR) by Region (US$ Million): 2019 VS 2023 VS 2030
Table 55. Asia Contract Blending Services Market Size by Region (2019-2024) & (US$ Million)
Table 56. Asia Contract Blending Services Market Size by Region (2025-2030) & (US$ Million)
Table 57. Middle East, Africa, and Latin America Contract Blending Services Market Size by Type (2019-2024) & (US$ Million)
Table 58. Middle East, Africa, and Latin America Contract Blending Services Market Size by Type (2025-2030) & (US$ Million)
Table 59. Middle East, Africa, and Latin America Contract Blending Services Market Size by Application (2019-2024) & (US$ Million)
Table 60. Middle East, Africa, and Latin America Contract Blending Services Market Size by Application (2025-2030) & (US$ Million)
Table 61. Middle East, Africa, and Latin America Contract Blending Services Growth Rate (CAGR) by Country (US$ Million): 2019 VS 2023 VS 2030
Table 62. Middle East, Africa, and Latin America Contract Blending Services Market Size by Country (2019-2024) & (US$ Million)
Table 63. Middle East, Africa, and Latin America Contract Blending Services Market Size by Country (2025-2030) & (US$ Million)
Table 64. RSBRUCE Metals and Machinery Company Details
Table 65. RSBRUCE Metals and Machinery Business Overview
Table 66. RSBRUCE Metals and Machinery Contract Blending Services Product
Table 67. RSBRUCE Metals and Machinery Revenue in Contract Blending Services Business (2019-2024) & (US$ Million)
Table 68. RSBRUCE Metals and Machinery Recent Developments
Table 69. Camco Company Details
Table 70. Camco Business Overview
Table 71. Camco Contract Blending Services Product
Table 72. Camco Revenue in Contract Blending Services Business (2019-2024) & (US$ Million)
Table 73. Camco Recent Developments
Table 74. UIL Blending Solutions Company Details
Table 75. UIL Blending Solutions Business Overview
Table 76. UIL Blending Solutions Contract Blending Services Product
Table 77. UIL Blending Solutions Revenue in Contract Blending Services Business (2019-2024) & (US$ Million)
Table 78. UIL Blending Solutions Recent Developments
Table 79. SchlötterErelandDAC Company Details
Table 80. SchlötterErelandDAC Business Overview
Table 81. SchlötterErelandDAC Contract Blending Services Product
Table 82. SchlötterErelandDAC Revenue in Contract Blending Services Business (2019-2024) & (US$ Million)
Table 83. SchlötterErelandDAC Recent Developments
Table 84. AB Mauri UK&Ireland Company Details
Table 85. AB Mauri UK&Ireland Business Overview
Table 86. AB Mauri UK&Ireland Contract Blending Services Product
Table 87. AB Mauri UK&Ireland Revenue in Contract Blending Services Business (2019-2024) & (US$ Million)
Table 88. AB Mauri UK&Ireland Recent Developments
Table 89. 2v Industries Company Details
Table 90. 2v Industries Business Overview
Table 91. 2v Industries Contract Blending Services Product
Table 92. 2v Industries Revenue in Contract Blending Services Business (2019-2024) & (US$ Million)
Table 93. 2v Industries Recent Developments
Table 94. Grosvenor Chemicals Company Details
Table 95. Grosvenor Chemicals Business Overview
Table 96. Grosvenor Chemicals Contract Blending Services Product
Table 97. Grosvenor Chemicals Revenue in Contract Blending Services Business (2019-2024) & (US$ Million)
Table 98. Grosvenor Chemicals Recent Developments
Table 99. Econo Pak Company Details
Table 100. Econo Pak Business Overview
Table 101. Econo Pak Contract Blending Services Product
Table 102. Econo Pak Revenue in Contract Blending Services Business (2019-2024) & (US$ Million)
Table 103. Econo Pak Recent Developments
Table 104. EMCO Company Details
Table 105. EMCO Business Overview
Table 106. EMCO Contract Blending Services Product
Table 107. EMCO Revenue in Contract Blending Services Business (2019-2024) & (US$ Million)
Table 108. EMCO Recent Developments
Table 109. Plantgistix Company Details
Table 110. Plantgistix Business Overview
Table 111. Plantgistix Contract Blending Services Product
Table 112. Plantgistix Revenue in Contract Blending Services Business (2019-2024) & (US$ Million)
Table 113. Plantgistix Recent Developments
Table 114. PacMoore Company Details
Table 115. PacMoore Business Overview
Table 116. PacMoore Contract Blending Services Product
Table 117. PacMoore Revenue in Contract Blending Services Business (2019-2024) & (US$ Million)
Table 118. PacMoore Recent Developments
Table 119. Sabinsa Europe Company Details
Table 120. Sabinsa Europe Business Overview
Table 121. Sabinsa Europe Contract Blending Services Product
Table 122. Sabinsa Europe Revenue in Contract Blending Services Business (2019-2024) & (US$ Million)
Table 123. Sabinsa Europe Recent Developments
Table 124. Fair Chem Industries Company Details
Table 125. Fair Chem Industries Business Overview
Table 126. Fair Chem Industries Contract Blending Services Product
Table 127. Fair Chem Industries Revenue in Contract Blending Services Business (2019-2024) & (US$ Million)
Table 128. Fair Chem Industries Recent Developments
Table 129. Thermograde Company Details
Table 130. Thermograde Business Overview
Table 131. Thermograde Contract Blending Services Product
Table 132. Thermograde Revenue in Contract Blending Services Business (2019-2024) & (US$ Million)
Table 133. Thermograde Recent Developments
Table 134. CMC Milling Company Details
Table 135. CMC Milling Business Overview
Table 136. CMC Milling Contract Blending Services Product
Table 137. CMC Milling Revenue in Contract Blending Services Business (2019-2024) & (US$ Million)
Table 138. CMC Milling Recent Developments
Table 139. Haviland USA Company Details
Table 140. Haviland USA Business Overview
Table 141. Haviland USA Contract Blending Services Product
Table 142. Haviland USA Revenue in Contract Blending Services Business (2019-2024) & (US$ Million)
Table 143. Haviland USA Recent Developments
Table 144. Sigma Services Company Details
Table 145. Sigma Services Business Overview
Table 146. Sigma Services Contract Blending Services Product
Table 147. Sigma Services Revenue in Contract Blending Services Business (2019-2024) & (US$ Million)
Table 148. Sigma Services Recent Developments
Table 149. Prestige Blending Company Details
Table 150. Prestige Blending Business Overview
Table 151. Prestige Blending Contract Blending Services Product
Table 152. Prestige Blending Revenue in Contract Blending Services Business (2019-2024) & (US$ Million)
Table 153. Prestige Blending Recent Developments
Table 154. Research Programs/Design for This Report
Table 155. Key Data Information from Secondary Sources
Table 156. Key Data Information from Primary Sources
List of Figures
Figure 1. Global Contract Blending Services Market Size Growth Rate by Type, 2019 VS 2023 VS 2030 (US$ Million)
Figure 2. Global Contract Blending Services Market Share by Type: 2023 VS 2030
Figure 3. Dry Blends Features
Figure 4. Product Blends Features
Figure 5. Multiple Component Blends Features
Figure 6. Global Contract Blending Services Market Size Growth Rate by Application, 2019 VS 2023 VS 2030 (US$ Million)
Figure 7. Global Contract Blending Services Market Share by Application: 2023 VS 2030
Figure 8. Nutritional Supplements Case Studies
Figure 9. Greases and Lubricants Case Studies
Figure 10. Protein Powders Case Studies
Figure 11. Healthy Snack Mixes Case Studies
Figure 12. Others Case Studies
Figure 13. Contract Blending Services Report Years Considered
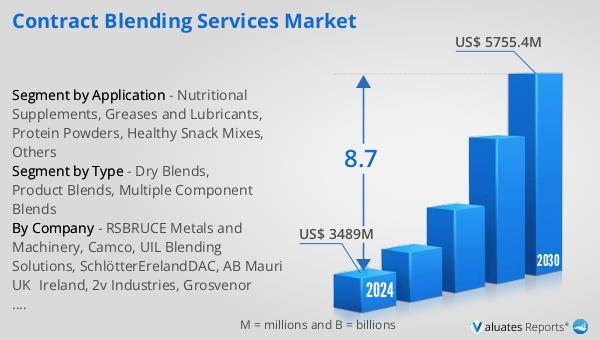
Figure 14. Global Contract Blending Services Market Size (US$ Million), Year-over-Year: 2019-2030
Figure 15. Global Contract Blending Services Market Size, (US$ Million), 2019 VS 2023 VS 2030
Figure 16. Global Contract Blending Services Market Share by Region: 2023 VS 2030
Figure 17. Global Contract Blending Services Market Share by Players in 2023
Figure 18. Global Top Contract Blending Services Players by Company Type (Tier 1, Tier 2, and Tier 3) & (based on the Revenue in Contract Blending Services as of 2023)
Figure 19. The Top 10 and 5 Players Market Share by Contract Blending Services Revenue in 2023
Figure 20. North America Contract Blending Services Market Size YoY Growth (2019-2030) & (US$ Million)
Figure 21. North America Contract Blending Services Market Share by Type (2019-2030)
Figure 22. North America Contract Blending Services Market Share by Application (2019-2030)
Figure 23. North America Contract Blending Services Market Share by Country (2019-2030)
Figure 24. United States Contract Blending Services Market Size YoY Growth (2019-2030) & (US$ Million)
Figure 25. Canada Contract Blending Services Market Size YoY Growth (2019-2030) & (US$ Million)
Figure 26. Europe Contract Blending Services Market Size YoY (2019-2030) & (US$ Million)
Figure 27. Europe Contract Blending Services Market Share by Type (2019-2030)
Figure 28. Europe Contract Blending Services Market Share by Application (2019-2030)
Figure 29. Europe Contract Blending Services Market Share by Country (2019-2030)
Figure 30. Germany Contract Blending Services Market Size YoY Growth (2019-2030) & (US$ Million)
Figure 31. France Contract Blending Services Market Size YoY Growth (2019-2030) & (US$ Million)
Figure 32. U.K. Contract Blending Services Market Size YoY Growth (2019-2030) & (US$ Million)
Figure 33. Italy Contract Blending Services Market Size YoY Growth (2019-2030) & (US$ Million)
Figure 34. Russia Contract Blending Services Market Size YoY Growth (2019-2030) & (US$ Million)
Figure 35. Nordic Countries Contract Blending Services Market Size YoY Growth (2019-2030) & (US$ Million)
Figure 36. China Contract Blending Services Market Size YoY (2019-2030) & (US$ Million)
Figure 37. China Contract Blending Services Market Share by Type (2019-2030)
Figure 38. China Contract Blending Services Market Share by Application (2019-2030)
Figure 39. Asia Contract Blending Services Market Size YoY (2019-2030) & (US$ Million)
Figure 40. Asia Contract Blending Services Market Share by Type (2019-2030)
Figure 41. Asia Contract Blending Services Market Share by Application (2019-2030)
Figure 42. Asia Contract Blending Services Market Share by Region (2019-2030)
Figure 43. Japan Contract Blending Services Market Size YoY Growth (2019-2030) & (US$ Million)
Figure 44. South Korea Contract Blending Services Market Size YoY Growth (2019-2030) & (US$ Million)
Figure 45. China Taiwan Contract Blending Services Market Size YoY Growth (2019-2030) & (US$ Million)
Figure 46. Southeast Asia Contract Blending Services Market Size YoY Growth (2019-2030) & (US$ Million)
Figure 47. India Contract Blending Services Market Size YoY Growth (2019-2030) & (US$ Million)
Figure 48. Australia Contract Blending Services Market Size YoY Growth (2019-2030) & (US$ Million)
Figure 49. Middle East, Africa, and Latin America Contract Blending Services Market Size YoY (2019-2030) & (US$ Million)
Figure 50. Middle East, Africa, and Latin America Contract Blending Services Market Share by Type (2019-2030)
Figure 51. Middle East, Africa, and Latin America Contract Blending Services Market Share by Application (2019-2030)
Figure 52. Middle East, Africa, and Latin America Contract Blending Services Market Share by Country (2019-2030)
Figure 53. Brazil Contract Blending Services Market Size YoY Growth (2019-2030) & (US$ Million)
Figure 54. Mexico Contract Blending Services Market Size YoY Growth (2019-2030) & (US$ Million)
Figure 55. Turkey Contract Blending Services Market Size YoY Growth (2019-2030) & (US$ Million)
Figure 56. Saudi Arabia Contract Blending Services Market Size YoY Growth (2019-2030) & (US$ Million)
Figure 57. Israel Contract Blending Services Market Size YoY Growth (2019-2030) & (US$ Million)
Figure 58. GCC Countries Contract Blending Services Market Size YoY Growth (2019-2030) & (US$ Million)
Figure 59. RSBRUCE Metals and Machinery Revenue Growth Rate in Contract Blending Services Business (2019-2024)
Figure 60. Camco Revenue Growth Rate in Contract Blending Services Business (2019-2024)
Figure 61. UIL Blending Solutions Revenue Growth Rate in Contract Blending Services Business (2019-2024)
Figure 62. SchlötterErelandDAC Revenue Growth Rate in Contract Blending Services Business (2019-2024)
Figure 63. AB Mauri UK&Ireland Revenue Growth Rate in Contract Blending Services Business (2019-2024)
Figure 64. 2v Industries Revenue Growth Rate in Contract Blending Services Business (2019-2024)
Figure 65. Grosvenor Chemicals Revenue Growth Rate in Contract Blending Services Business (2019-2024)
Figure 66. Econo Pak Revenue Growth Rate in Contract Blending Services Business (2019-2024)
Figure 67. EMCO Revenue Growth Rate in Contract Blending Services Business (2019-2024)
Figure 68. Plantgistix Revenue Growth Rate in Contract Blending Services Business (2019-2024)
Figure 69. PacMoore Revenue Growth Rate in Contract Blending Services Business (2019-2024)
Figure 70. Sabinsa Europe Revenue Growth Rate in Contract Blending Services Business (2019-2024)
Figure 71. Fair Chem Industries Revenue Growth Rate in Contract Blending Services Business (2019-2024)
Figure 72. Thermograde Revenue Growth Rate in Contract Blending Services Business (2019-2024)
Figure 73. CMC Milling Revenue Growth Rate in Contract Blending Services Business (2019-2024)
Figure 74. Haviland USA Revenue Growth Rate in Contract Blending Services Business (2019-2024)
Figure 75. Sigma Services Revenue Growth Rate in Contract Blending Services Business (2019-2024)
Figure 76. Prestige Blending Revenue Growth Rate in Contract Blending Services Business (2019-2024)
Figure 77. Bottom-up and Top-down Approaches for This Report
Figure 78. Data Triangulation
Figure 79. Key Executives Interviewed