List of Tables
Table 1. Global Nuclear Dismantling and Decommissioning Services Market Size Growth Rate by Type (US$ Million): 2020 VS 2024 VS 2031
Table 2. Key Players of Immediate Dismantling & Decommissioning
Table 3. Key Players of Deferred Dismantling & Decommissioning
Table 4. Global Nuclear Dismantling and Decommissioning Services Market Size Growth Rate by Service Phase (US$ Million): 2020 VS 2024 VS 2031
Table 5. Key Players of Planning, Engineering and Permitting
Table 6. Key Players of Site Preparation and Decontamination
Table 7. Key Players of Demolition and Dismantling
Table 8. Key Players of Waste Management
Table 9. Key Players of Others
Table 10. Global Nuclear Dismantling and Decommissioning Services Market Size Growth Rate by Dominant Technologies (US$ Million): 2020 VS 2024 VS 2031
Table 11. Key Players of Manual Demolition
Table 12. Key Players of Robot Demolition
Table 13. Global Nuclear Dismantling and Decommissioning Services Market Size Growth Rate by Management Model (US$ Million): 2020 VS 2024 VS 2031
Table 14. Key Players of Direct Government Funding and Management
Table 15. Key Players of Industry Fund System
Table 16. Key Players of General Contracting Model
Table 17. Global Nuclear Dismantling and Decommissioning Services Market Size Growth by Application (US$ Million): 2020 VS 2024 VS 2031
Table 18. Global Nuclear Dismantling and Decommissioning Services Market Size by Region (US$ Million): 2020 VS 2024 VS 2031
Table 19. Global Nuclear Dismantling and Decommissioning Services Market Size by Region (2020-2025) & (US$ Million)
Table 20. Global Nuclear Dismantling and Decommissioning Services Market Share by Region (2020-2025)
Table 21. Global Nuclear Dismantling and Decommissioning Services Forecasted Market Size by Region (2026-2031) & (US$ Million)
Table 22. Global Nuclear Dismantling and Decommissioning Services Market Share by Region (2026-2031)
Table 23. Nuclear Dismantling and Decommissioning Services Market Trends
Table 24. Nuclear Dismantling and Decommissioning Services Market Drivers
Table 25. Nuclear Dismantling and Decommissioning Services Market Challenges
Table 26. Nuclear Dismantling and Decommissioning Services Market Restraints
Table 27. Global Nuclear Dismantling and Decommissioning Services Revenue by Players (2020-2025) & (US$ Million)
Table 28. Global Nuclear Dismantling and Decommissioning Services Market Share by Players (2020-2025)
Table 29. Global Top Nuclear Dismantling and Decommissioning Services Players by Company Type (Tier 1, Tier 2, and Tier 3) & (based on the Revenue in Nuclear Dismantling and Decommissioning Services as of 2024)
Table 30. Ranking of Global Top Nuclear Dismantling and Decommissioning Services Companies by Revenue (US$ Million) in 2024
Table 31. Global 5 Largest Players Market Share by Nuclear Dismantling and Decommissioning Services Revenue (CR5 and HHI) & (2020-2025)
Table 32. Global Key Players of Nuclear Dismantling and Decommissioning Services, Headquarters and Area Served
Table 33. Global Key Players of Nuclear Dismantling and Decommissioning Services, Product and Application
Table 34. Global Key Players of Nuclear Dismantling and Decommissioning Services, Date of Enter into This Industry
Table 35. Mergers & Acquisitions, Expansion Plans
Table 36. Global Nuclear Dismantling and Decommissioning Services Market Size by Type (2020-2025) & (US$ Million)
Table 37. Global Nuclear Dismantling and Decommissioning Services Revenue Market Share by Type (2020-2025)
Table 38. Global Nuclear Dismantling and Decommissioning Services Forecasted Market Size by Type (2026-2031) & (US$ Million)
Table 39. Global Nuclear Dismantling and Decommissioning Services Revenue Market Share by Type (2026-2031)
Table 40. Global Nuclear Dismantling and Decommissioning Services Market Size by Application (2020-2025) & (US$ Million)
Table 41. Global Nuclear Dismantling and Decommissioning Services Revenue Market Share by Application (2020-2025)
Table 42. Global Nuclear Dismantling and Decommissioning Services Forecasted Market Size by Application (2026-2031) & (US$ Million)
Table 43. Global Nuclear Dismantling and Decommissioning Services Revenue Market Share by Application (2026-2031)
Table 44. North America Nuclear Dismantling and Decommissioning Services Market Size Growth Rate by Country (US$ Million): 2020 VS 2024 VS 2031
Table 45. North America Nuclear Dismantling and Decommissioning Services Market Size by Country (2020-2025) & (US$ Million)
Table 46. North America Nuclear Dismantling and Decommissioning Services Market Size by Country (2026-2031) & (US$ Million)
Table 47. Europe Nuclear Dismantling and Decommissioning Services Market Size Growth Rate by Country (US$ Million): 2020 VS 2024 VS 2031
Table 48. Europe Nuclear Dismantling and Decommissioning Services Market Size by Country (2020-2025) & (US$ Million)
Table 49. Europe Nuclear Dismantling and Decommissioning Services Market Size by Country (2026-2031) & (US$ Million)
Table 50. Asia-Pacific Nuclear Dismantling and Decommissioning Services Market Size Growth Rate by Region (US$ Million): 2020 VS 2024 VS 2031
Table 51. Asia-Pacific Nuclear Dismantling and Decommissioning Services Market Size by Region (2020-2025) & (US$ Million)
Table 52. Asia-Pacific Nuclear Dismantling and Decommissioning Services Market Size by Region (2026-2031) & (US$ Million)
Table 53. Latin America Nuclear Dismantling and Decommissioning Services Market Size Growth Rate by Country (US$ Million): 2020 VS 2024 VS 2031
Table 54. Latin America Nuclear Dismantling and Decommissioning Services Market Size by Country (2020-2025) & (US$ Million)
Table 55. Latin America Nuclear Dismantling and Decommissioning Services Market Size by Country (2026-2031) & (US$ Million)
Table 56. Middle East & Africa Nuclear Dismantling and Decommissioning Services Market Size Growth Rate by Country (US$ Million): 2020 VS 2024 VS 2031
Table 57. Middle East & Africa Nuclear Dismantling and Decommissioning Services Market Size by Country (2020-2025) & (US$ Million)
Table 58. Middle East & Africa Nuclear Dismantling and Decommissioning Services Market Size by Country (2026-2031) & (US$ Million)
Table 59. Orano Company Details
Table 60. Orano Business Overview
Table 61. Orano Nuclear Dismantling and Decommissioning Services Product
Table 62. Orano Revenue in Nuclear Dismantling and Decommissioning Services Business (2020-2025) & (US$ Million)
Table 63. Orano Recent Development
Table 64. Cabrera Services Company Details
Table 65. Cabrera Services Business Overview
Table 66. Cabrera Services Nuclear Dismantling and Decommissioning Services Product
Table 67. Cabrera Services Revenue in Nuclear Dismantling and Decommissioning Services Business (2020-2025) & (US$ Million)
Table 68. Cabrera Services Recent Development
Table 69. Ecology Services Company Details
Table 70. Ecology Services Business Overview
Table 71. Ecology Services Nuclear Dismantling and Decommissioning Services Product
Table 72. Ecology Services Revenue in Nuclear Dismantling and Decommissioning Services Business (2020-2025) & (US$ Million)
Table 73. Ecology Services Recent Development
Table 74. EDF Company Details
Table 75. EDF Business Overview
Table 76. EDF Nuclear Dismantling and Decommissioning Services Product
Table 77. EDF Revenue in Nuclear Dismantling and Decommissioning Services Business (2020-2025) & (US$ Million)
Table 78. EDF Recent Development
Table 79. Holtec International Company Details
Table 80. Holtec International Business Overview
Table 81. Holtec International Nuclear Dismantling and Decommissioning Services Product
Table 82. Holtec International Revenue in Nuclear Dismantling and Decommissioning Services Business (2020-2025) & (US$ Million)
Table 83. Holtec International Recent Development
Table 84. Mid Counties Waste Management Services Company Details
Table 85. Mid Counties Waste Management Services Business Overview
Table 86. Mid Counties Waste Management Services Nuclear Dismantling and Decommissioning Services Product
Table 87. Mid Counties Waste Management Services Revenue in Nuclear Dismantling and Decommissioning Services Business (2020-2025) & (US$ Million)
Table 88. Mid Counties Waste Management Services Recent Development
Table 89. Nuclear Research & Consultancy Group Company Details
Table 90. Nuclear Research & Consultancy Group Business Overview
Table 91. Nuclear Research & Consultancy Group Nuclear Dismantling and Decommissioning Services Product
Table 92. Nuclear Research & Consultancy Group Revenue in Nuclear Dismantling and Decommissioning Services Business (2020-2025) & (US$ Million)
Table 93. Nuclear Research & Consultancy Group Recent Development
Table 94. Swedish Nuclear Fuel and Waste Management Company Company Details
Table 95. Swedish Nuclear Fuel and Waste Management Company Business Overview
Table 96. Swedish Nuclear Fuel and Waste Management Company Nuclear Dismantling and Decommissioning Services Product
Table 97. Swedish Nuclear Fuel and Waste Management Company Revenue in Nuclear Dismantling and Decommissioning Services Business (2020-2025) & (US$ Million)
Table 98. Swedish Nuclear Fuel and Waste Management Company Recent Development
Table 99. Veolia Environmental Services Company Details
Table 100. Veolia Environmental Services Business Overview
Table 101. Veolia Environmental Services Nuclear Dismantling and Decommissioning Services Product
Table 102. Veolia Environmental Services Revenue in Nuclear Dismantling and Decommissioning Services Business (2020-2025) & (US$ Million)
Table 103. Veolia Environmental Services Recent Development
Table 104. Kurion Inc. Company Details
Table 105. Kurion Inc. Business Overview
Table 106. Kurion Inc. Nuclear Dismantling and Decommissioning Services Product
Table 107. Kurion Inc. Revenue in Nuclear Dismantling and Decommissioning Services Business (2020-2025) & (US$ Million)
Table 108. Kurion Inc. Recent Development
Table 109. GE Hitachi Nuclear Energy Company Details
Table 110. GE Hitachi Nuclear Energy Business Overview
Table 111. GE Hitachi Nuclear Energy Nuclear Dismantling and Decommissioning Services Product
Table 112. GE Hitachi Nuclear Energy Revenue in Nuclear Dismantling and Decommissioning Services Business (2020-2025) & (US$ Million)
Table 113. GE Hitachi Nuclear Energy Recent Development
Table 114. TÜV Süd Company Details
Table 115. TÜV Süd Business Overview
Table 116. TÜV Süd Nuclear Dismantling and Decommissioning Services Product
Table 117. TÜV Süd Revenue in Nuclear Dismantling and Decommissioning Services Business (2020-2025) & (US$ Million)
Table 118. TÜV Süd Recent Development
Table 119. Fortum Company Details
Table 120. Fortum Business Overview
Table 121. Fortum Nuclear Dismantling and Decommissioning Services Product
Table 122. Fortum Revenue in Nuclear Dismantling and Decommissioning Services Business (2020-2025) & (US$ Million)
Table 123. Fortum Recent Development
Table 124. Ansaldo Energia SpA Company Details
Table 125. Ansaldo Energia SpA Business Overview
Table 126. Ansaldo Energia SpA Nuclear Dismantling and Decommissioning Services Product
Table 127. Ansaldo Energia SpA Revenue in Nuclear Dismantling and Decommissioning Services Business (2020-2025) & (US$ Million)
Table 128. Ansaldo Energia SpA Recent Development
Table 129. Energy Solutions Company Details
Table 130. Energy Solutions Business Overview
Table 131. Energy Solutions Nuclear Dismantling and Decommissioning Services Product
Table 132. Energy Solutions Revenue in Nuclear Dismantling and Decommissioning Services Business (2020-2025) & (US$ Million)
Table 133. Energy Solutions Recent Development
Table 134. Studsvik AB Company Details
Table 135. Studsvik AB Business Overview
Table 136. Studsvik AB Nuclear Dismantling and Decommissioning Services Product
Table 137. Studsvik AB Revenue in Nuclear Dismantling and Decommissioning Services Business (2020-2025) & (US$ Million)
Table 138. Studsvik AB Recent Development
Table 139. Westinghouse Electric Company LLC Company Details
Table 140. Westinghouse Electric Company LLC Business Overview
Table 141. Westinghouse Electric Company LLC Nuclear Dismantling and Decommissioning Services Product
Table 142. Westinghouse Electric Company LLC Revenue in Nuclear Dismantling and Decommissioning Services Business (2020-2025) & (US$ Million)
Table 143. Westinghouse Electric Company LLC Recent Development
Table 144. NUVIA Group Company Details
Table 145. NUVIA Group Business Overview
Table 146. NUVIA Group Nuclear Dismantling and Decommissioning Services Product
Table 147. NUVIA Group Revenue in Nuclear Dismantling and Decommissioning Services Business (2020-2025) & (US$ Million)
Table 148. NUVIA Group Recent Development
Table 149. Research Programs/Design for This Report
Table 150. Key Data Information from Secondary Sources
Table 151. Key Data Information from Primary Sources
Table 152. Authors List of This Report
List of Figures
Figure 1. Nuclear Dismantling and Decommissioning Services Picture
Figure 2. Global Nuclear Dismantling and Decommissioning Services Market Size Comparison by Type (2020-2031) & (US$ Million)
Figure 3. Global Nuclear Dismantling and Decommissioning Services Market Share by Type: 2024 VS 2031
Figure 4. Immediate Dismantling & Decommissioning Features
Figure 5. Deferred Dismantling & Decommissioning Features
Figure 6. Global Nuclear Dismantling and Decommissioning Services Market Size Comparison by Service Phase (2020-2031) & (US$ Million)
Figure 7. Planning, Engineering and Permitting Features
Figure 8. Site Preparation and Decontamination Features
Figure 9. Demolition and Dismantling Features
Figure 10. Waste Management Features
Figure 11. Others Features
Figure 12. Global Nuclear Dismantling and Decommissioning Services Market Size Comparison by Dominant Technologies (2020-2031) & (US$ Million)
Figure 13. Manual Demolition Features
Figure 14. Robot Demolition Features
Figure 15. Global Nuclear Dismantling and Decommissioning Services Market Size Comparison by Management Model (2020-2031) & (US$ Million)
Figure 16. Direct Government Funding and Management Features
Figure 17. Industry Fund System Features
Figure 18. General Contracting Model Features
Figure 19. Global Nuclear Dismantling and Decommissioning Services Market Size by Application (2020-2031) & (US$ Million)
Figure 20. Global Nuclear Dismantling and Decommissioning Services Market Share by Application: 2024 VS 2031
Figure 21. Commercial Power Reactor Case Studies
Figure 22. Prototype Reactor Case Studies
Figure 23. Research Reactor Case Studies
Figure 24. Nuclear Dismantling and Decommissioning Services Report Years Considered
Figure 25. Global Nuclear Dismantling and Decommissioning Services Market Size (US$ Million), Year-over-Year: 2020-2031
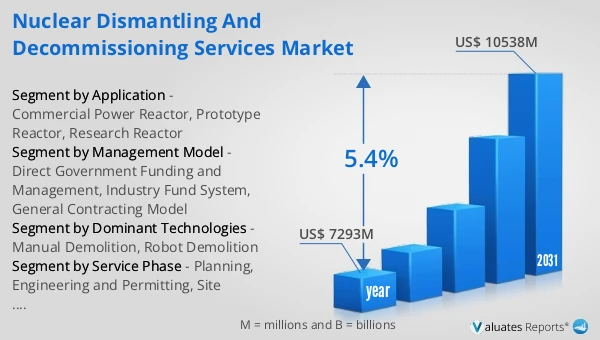
Figure 26. Global Nuclear Dismantling and Decommissioning Services Market Size, (US$ Million), 2020 VS 2024 VS 2031
Figure 27. Global Nuclear Dismantling and Decommissioning Services Market Share by Region: 2024 VS 2031
Figure 28. Global Nuclear Dismantling and Decommissioning Services Market Share by Players in 2024
Figure 29. Global Nuclear Dismantling and Decommissioning Services Market Share by Company Type (Tier 1, Tier 2, and Tier 3)
Figure 30. The Top 10 and 5 Players Market Share by Nuclear Dismantling and Decommissioning Services Revenue in 2024
Figure 31. North America Nuclear Dismantling and Decommissioning Services Market Size YoY Growth (2020-2031) & (US$ Million)
Figure 32. North America Nuclear Dismantling and Decommissioning Services Market Share by Country (2020-2031)
Figure 33. United States Nuclear Dismantling and Decommissioning Services Market Size YoY Growth (2020-2031) & (US$ Million)
Figure 34. Canada Nuclear Dismantling and Decommissioning Services Market Size YoY Growth (2020-2031) & (US$ Million)
Figure 35. Europe Nuclear Dismantling and Decommissioning Services Market Size YoY Growth (2020-2031) & (US$ Million)
Figure 36. Europe Nuclear Dismantling and Decommissioning Services Market Share by Country (2020-2031)
Figure 37. Germany Nuclear Dismantling and Decommissioning Services Market Size YoY Growth (2020-2031) & (US$ Million)
Figure 38. France Nuclear Dismantling and Decommissioning Services Market Size YoY Growth (2020-2031) & (US$ Million)
Figure 39. U.K. Nuclear Dismantling and Decommissioning Services Market Size YoY Growth (2020-2031) & (US$ Million)
Figure 40. Italy Nuclear Dismantling and Decommissioning Services Market Size YoY Growth (2020-2031) & (US$ Million)
Figure 41. Russia Nuclear Dismantling and Decommissioning Services Market Size YoY Growth (2020-2031) & (US$ Million)
Figure 42. Ireland Nuclear Dismantling and Decommissioning Services Market Size YoY Growth (2020-2031) & (US$ Million)
Figure 43. Asia-Pacific Nuclear Dismantling and Decommissioning Services Market Size YoY Growth (2020-2031) & (US$ Million)
Figure 44. Asia-Pacific Nuclear Dismantling and Decommissioning Services Market Share by Region (2020-2031)
Figure 45. China Nuclear Dismantling and Decommissioning Services Market Size YoY Growth (2020-2031) & (US$ Million)
Figure 46. Japan Nuclear Dismantling and Decommissioning Services Market Size YoY Growth (2020-2031) & (US$ Million)
Figure 47. South Korea Nuclear Dismantling and Decommissioning Services Market Size YoY Growth (2020-2031) & (US$ Million)
Figure 48. Southeast Asia Nuclear Dismantling and Decommissioning Services Market Size YoY Growth (2020-2031) & (US$ Million)
Figure 49. India Nuclear Dismantling and Decommissioning Services Market Size YoY Growth (2020-2031) & (US$ Million)
Figure 50. Australia & New Zealand Nuclear Dismantling and Decommissioning Services Market Size YoY Growth (2020-2031) & (US$ Million)
Figure 51. Latin America Nuclear Dismantling and Decommissioning Services Market Size YoY Growth (2020-2031) & (US$ Million)
Figure 52. Latin America Nuclear Dismantling and Decommissioning Services Market Share by Country (2020-2031)
Figure 53. Mexico Nuclear Dismantling and Decommissioning Services Market Size YoY Growth (2020-2031) & (US$ Million)
Figure 54. Brazil Nuclear Dismantling and Decommissioning Services Market Size YoY Growth (2020-2031) & (US$ Million)
Figure 55. Middle East & Africa Nuclear Dismantling and Decommissioning Services Market Size YoY Growth (2020-2031) & (US$ Million)
Figure 56. Middle East & Africa Nuclear Dismantling and Decommissioning Services Market Share by Country (2020-2031)
Figure 57. Israel Nuclear Dismantling and Decommissioning Services Market Size YoY Growth (2020-2031) & (US$ Million)
Figure 58. Saudi Arabia Nuclear Dismantling and Decommissioning Services Market Size YoY Growth (2020-2031) & (US$ Million)
Figure 59. UAE Nuclear Dismantling and Decommissioning Services Market Size YoY Growth (2020-2031) & (US$ Million)
Figure 60. Orano Revenue Growth Rate in Nuclear Dismantling and Decommissioning Services Business (2020-2025)
Figure 61. Cabrera Services Revenue Growth Rate in Nuclear Dismantling and Decommissioning Services Business (2020-2025)
Figure 62. Ecology Services Revenue Growth Rate in Nuclear Dismantling and Decommissioning Services Business (2020-2025)
Figure 63. EDF Revenue Growth Rate in Nuclear Dismantling and Decommissioning Services Business (2020-2025)
Figure 64. Holtec International Revenue Growth Rate in Nuclear Dismantling and Decommissioning Services Business (2020-2025)
Figure 65. Mid Counties Waste Management Services Revenue Growth Rate in Nuclear Dismantling and Decommissioning Services Business (2020-2025)
Figure 66. Nuclear Research & Consultancy Group Revenue Growth Rate in Nuclear Dismantling and Decommissioning Services Business (2020-2025)
Figure 67. Swedish Nuclear Fuel and Waste Management Company Revenue Growth Rate in Nuclear Dismantling and Decommissioning Services Business (2020-2025)
Figure 68. Veolia Environmental Services Revenue Growth Rate in Nuclear Dismantling and Decommissioning Services Business (2020-2025)
Figure 69. Kurion Inc. Revenue Growth Rate in Nuclear Dismantling and Decommissioning Services Business (2020-2025)
Figure 70. GE Hitachi Nuclear Energy Revenue Growth Rate in Nuclear Dismantling and Decommissioning Services Business (2020-2025)
Figure 71. TÜV Süd Revenue Growth Rate in Nuclear Dismantling and Decommissioning Services Business (2020-2025)
Figure 72. Fortum Revenue Growth Rate in Nuclear Dismantling and Decommissioning Services Business (2020-2025)
Figure 73. Ansaldo Energia SpA Revenue Growth Rate in Nuclear Dismantling and Decommissioning Services Business (2020-2025)
Figure 74. Energy Solutions Revenue Growth Rate in Nuclear Dismantling and Decommissioning Services Business (2020-2025)
Figure 75. Studsvik AB Revenue Growth Rate in Nuclear Dismantling and Decommissioning Services Business (2020-2025)
Figure 76. Westinghouse Electric Company LLC Revenue Growth Rate in Nuclear Dismantling and Decommissioning Services Business (2020-2025)
Figure 77. NUVIA Group Revenue Growth Rate in Nuclear Dismantling and Decommissioning Services Business (2020-2025)
Figure 78. Bottom-up and Top-down Approaches for This Report
Figure 79. Data Triangulation
Figure 80. Key Executives Interviewed