0
U.S. (TOLL FREE)
+1 (315) 215-3225
Automative

0
U.S. (TOLL FREE)
+1 (315) 215-3225
Global Agricultural Fumigants Market Research Report 2024
Published Date: February 2024
|
Report Code: QYRE-Auto-38U11924
Home | Market Reports | Business & Industrial| Agriculture & Forestry
Global Agricultural Fumigants Market Size Manufacturers Supply Chain Sales Channel and Clients 2022 2028
BUY CHAPTERS

Global Agricultural Fumigants Market Research Report 2024

Code: QYRE-Auto-38U11924
Report
February 2024
Pages:127
QYResearch
Buy Now with 15% Discount
DESCRIPTION
TABLE OF CONTENT
TABLES & FIGURES

Agricultural Fumigants Market Size

The global Agricultural Fumigants market was valued at US$ 976 million in 2023 and is anticipated to reach US$ 1179.8 million by 2030, witnessing a CAGR of 2.7% during the forecast period 2024-2030.

Agricultural Fumigants Market

Agricultural Fumigants Market

Agricultural fumigants are injected into the soil and move through the soil air and dissolve in the water in the soil where they kill pests, and also used on grains and crops post-harvest to reduce insects, ticks and mites, nematodes, slugs and snails and fungal diseases.
In the report, the statistics refer to agricultural fumigants as materials for fumigants pesticides. There are common fumigants materials such as Methyl Bromide, Phosphine, Chloropicrin, Metam Sodium, 1, 3-Dichloropropene.
Global Agricultural Fumigants key players include Dow, FMC Corporation, AMVAC, BASF, ADAMA Agricultural, etc.
USA is the largest market, with a share over 35%, followed by Europe and China, both have a share over 35%.
In terms of product, 1,3-Dichloropropene is the largest segment, with a share over 25%. And in terms of application, the largest application is Soil Consumption, followed by Warehouse Consumption, etc.
This report aims to provide a comprehensive presentation of the global market for Agricultural Fumigants, with both quantitative and qualitative analysis, to help readers develop business/growth strategies, assess the market competitive situation, analyze their position in the current marketplace, and make informed business decisions regarding Agricultural Fumigants.

Report Scope

The Agricultural Fumigants market size, estimations, and forecasts are provided in terms of output/shipments (Ton) and revenue ($ millions), considering 2023 as the base year, with history and forecast data for the period from 2019 to 2030. This report segments the global Agricultural Fumigants market comprehensively. Regional market sizes, concerning products by Type, by Application, and by players, are also provided.
For a more in-depth understanding of the market, the report provides profiles of the competitive landscape, key competitors, and their respective market ranks. The report also discusses technological trends and new product developments.
The report will help the Agricultural Fumigants manufacturers, new entrants, and industry chain related companies in this market with information on the revenues, production, and average price for the overall market and the sub-segments across the different segments, by company, by Type, by Application, and by regions.
Market Segmentation

Scope of Agricultural Fumigants Market Report

Report Metric Details
Report Name Agricultural Fumigants Market
Accounted market size in 2023 US$ 976 million
Forecasted market size in 2030 US$ 1179.8 million
CAGR 2.7%
Base Year 2023
Forecasted years 2024 - 2030
Segment by Type
  • 1,3-Dichloropropene
  • Chloropicrin
  • Methyl Bromide
  • Metam Sodium
  • Phosphine
  • Others
Segment by Application
  • Soil Consumption
  • Warehouse Consumption
Production by Region
  • North America
  • Europe
  • China
  • Japan
  • India
  • Latin America
  • Mid East & Africa
Consumption by Region
  • North America (United States, Canada)
  • Europe (Germany, France, UK, Italy, Russia)
  • Asia-Pacific (China, Japan, South Korea, Taiwan)
  • Southeast Asia (India)
  • Latin America (Mexico, Brazil)
By Company DuPont, AMVAC, ADAMA Agricultural, FMC Corporation, BASF, Syngenta, UPL Group, Detia-Degesch, Ikeda Kogyo, Arkema, Lanxess, Eastman, Solvay, ASHTA Chemicals, Jiangsu Shuangling, Dalian Dyechem, Shenyang Fengshou, Jining Shengcheng, Nantong Shizhuang, Limin Chemical, Lianyungang Dead Sea Bromine
Forecast units USD million in value
Report coverage Revenue and volume forecast, company share, competitive landscape, growth factors and trends

Chapter Outline

  • Chapter 1: Introduces the report scope of the report, executive summary of different market segments (by region, by Type, by Application, etc), including the market size of each market segment, future development potential, and so on. It offers a high-level view of the current state of the market and its likely evolution in the short to mid-term, and long term.
  • Chapter 2: Detailed analysis of Agricultural Fumigants manufacturers competitive landscape, price, production and value market share, latest development plan, merger, and acquisition information, etc.
  • Chapter 3: Production/output, value of Agricultural Fumigants by region/country. It provides a quantitative analysis of the market size and development potential of each region in the next six years.
  • Chapter 4: Consumption of Agricultural Fumigants in regional level and country level. It provides a quantitative analysis of the market size and development potential of each region and its main countries and introduces the market development, future development prospects, market space, and production of each country in the world.
  • Chapter 5: Provides the analysis of various market segments by Type, covering the market size and development potential of each market segment, to help readers find the blue ocean market in different market segments.
  • Chapter 6: Provides the analysis of various market segments by Application, covering the market size and development potential of each market segment, to help readers find the blue ocean market in different downstream markets.
  • Chapter 7: Provides profiles of key players, introducing the basic situation of the main companies in the market in detail, including product production/output, value, price, gross margin, product introduction, recent development, etc.
  • Chapter 8: Analysis of industrial chain, including the upstream and downstream of the industry.
  • Chapter 9: Introduces the market dynamics, latest developments of the market, the driving factors and restrictive factors of the market, the challenges and risks faced by manufacturers in the industry, and the analysis of relevant policies in the industry.
  • Chapter 10: The main points and conclusions of the report.

FAQ for this report

How fast is Agricultural Fumigants Market growing?

Ans: The Agricultural Fumigants Market witnessing a CAGR of 2.7% during the forecast period 2024-2030.

What is the Agricultural Fumigants Market size in 2030?

Ans: The Agricultural Fumigants Market size in 2030 will be US$ 1179.8 million.

What is the Agricultural Fumigants Market share by type?

Ans: In terms of product, 1,3-Dichloropropene is the largest segment, with a share over 25%.

Who are the main players in the Agricultural Fumigants Market report?

Ans: The main players in the Agricultural Fumigants Market are DuPont, AMVAC, ADAMA Agricultural, FMC Corporation, BASF, Syngenta, UPL Group, Detia-Degesch, Ikeda Kogyo, Arkema, Lanxess, Eastman, Solvay, ASHTA Chemicals, Jiangsu Shuangling, Dalian Dyechem, Shenyang Fengshou, Jining Shengcheng, Nantong Shizhuang, Limin Chemical, Lianyungang Dead Sea Bromine

What are the Application segmentation covered in the Agricultural Fumigants Market report?

Ans: The Applications covered in the Agricultural Fumigants Market report are Soil Consumption, Warehouse Consumption

What are the Type segmentation covered in the Agricultural Fumigants Market report?

Ans: The Types covered in the Agricultural Fumigants Market report are 1,3-Dichloropropene, Chloropicrin, Methyl Bromide, Metam Sodium, Phosphine, Others

1 Agricultural Fumigants Market Overview
1.1 Product Definition
1.2 Agricultural Fumigants Segment by Type
1.2.1 Global Agricultural Fumigants Market Value Growth Rate Analysis by Type 2023 VS 2030
1.2.2 1,3-Dichloropropene
1.2.3 Chloropicrin
1.2.4 Methyl Bromide
1.2.5 Metam Sodium
1.2.6 Phosphine
1.2.7 Others
1.3 Agricultural Fumigants Segment by Application
1.3.1 Global Agricultural Fumigants Market Value Growth Rate Analysis by Application: 2023 VS 2030
1.3.2 Soil Consumption
1.3.3 Warehouse Consumption
1.4 Global Market Growth Prospects
1.4.1 Global Agricultural Fumigants Production Value Estimates and Forecasts (2019-2030)
1.4.2 Global Agricultural Fumigants Production Capacity Estimates and Forecasts (2019-2030)
1.4.3 Global Agricultural Fumigants Production Estimates and Forecasts (2019-2030)
1.4.4 Global Agricultural Fumigants Market Average Price Estimates and Forecasts (2019-2030)
1.5 Assumptions and Limitations
2 Market Competition by Manufacturers
2.1 Global Agricultural Fumigants Production Market Share by Manufacturers (2019-2024)
2.2 Global Agricultural Fumigants Production Value Market Share by Manufacturers (2019-2024)
2.3 Global Key Players of Agricultural Fumigants, Industry Ranking, 2022 VS 2023 VS 2024
2.4 Global Agricultural Fumigants Market Share by Company Type (Tier 1, Tier 2 and Tier 3)
2.5 Global Agricultural Fumigants Average Price by Manufacturers (2019-2024)
2.6 Global Key Manufacturers of Agricultural Fumigants, Manufacturing Base Distribution and Headquarters
2.7 Global Key Manufacturers of Agricultural Fumigants, Product Offered and Application
2.8 Global Key Manufacturers of Agricultural Fumigants, Date of Enter into This Industry
2.9 Agricultural Fumigants Market Competitive Situation and Trends
2.9.1 Agricultural Fumigants Market Concentration Rate
2.9.2 Global 5 and 10 Largest Agricultural Fumigants Players Market Share by Revenue
2.10 Mergers & Acquisitions, Expansion
3 Agricultural Fumigants Production by Region
3.1 Global Agricultural Fumigants Production Value Estimates and Forecasts by Region: 2019 VS 2023 VS 2030
3.2 Global Agricultural Fumigants Production Value by Region (2019-2030)
3.2.1 Global Agricultural Fumigants Production Value Market Share by Region (2019-2024)
3.2.2 Global Forecasted Production Value of Agricultural Fumigants by Region (2025-2030)
3.3 Global Agricultural Fumigants Production Estimates and Forecasts by Region: 2019 VS 2023 VS 2030
3.4 Global Agricultural Fumigants Production by Region (2019-2030)
3.4.1 Global Agricultural Fumigants Production Market Share by Region (2019-2024)
3.4.2 Global Forecasted Production of Agricultural Fumigants by Region (2025-2030)
3.5 Global Agricultural Fumigants Market Price Analysis by Region (2019-2024)
3.6 Global Agricultural Fumigants Production and Value, Year-over-Year Growth
3.6.1 North America Agricultural Fumigants Production Value Estimates and Forecasts (2019-2030)
3.6.2 Europe Agricultural Fumigants Production Value Estimates and Forecasts (2019-2030)
3.6.3 China Agricultural Fumigants Production Value Estimates and Forecasts (2019-2030)
3.6.4 Japan Agricultural Fumigants Production Value Estimates and Forecasts (2019-2030)
3.6.5 India Agricultural Fumigants Production Value Estimates and Forecasts (2019-2030)
3.6.6 Latin America Agricultural Fumigants Production Value Estimates and Forecasts (2019-2030)
3.6.7 Mid East & Africa Agricultural Fumigants Production Value Estimates and Forecasts (2019-2030)
4 Agricultural Fumigants Consumption by Region
4.1 Global Agricultural Fumigants Consumption Estimates and Forecasts by Region: 2019 VS 2023 VS 2030
4.2 Global Agricultural Fumigants Consumption by Region (2019-2030)
4.2.1 Global Agricultural Fumigants Consumption by Region (2019-2024)
4.2.2 Global Agricultural Fumigants Forecasted Consumption by Region (2025-2030)
4.3 North America
4.3.1 North America Agricultural Fumigants Consumption Growth Rate by Country: 2019 VS 2023 VS 2030
4.3.2 North America Agricultural Fumigants Consumption by Country (2019-2030)
4.3.3 U.S.
4.3.4 Canada
4.4 Europe
4.4.1 Europe Agricultural Fumigants Consumption Growth Rate by Country: 2019 VS 2023 VS 2030
4.4.2 Europe Agricultural Fumigants Consumption by Country (2019-2030)
4.4.3 Germany
4.4.4 France
4.4.5 U.K.
4.4.6 Italy
4.4.7 Russia
4.5 Asia Pacific
4.5.1 Asia Pacific Agricultural Fumigants Consumption Growth Rate by Region: 2019 VS 2023 VS 2030
4.5.2 Asia Pacific Agricultural Fumigants Consumption by Region (2019-2030)
4.5.3 China
4.5.4 Japan
4.5.5 South Korea
4.5.6 China Taiwan
4.5.7 Southeast Asia
4.5.8 India
4.6 Latin America, Middle East & Africa
4.6.1 Latin America, Middle East & Africa Agricultural Fumigants Consumption Growth Rate by Country: 2019 VS 2023 VS 2030
4.6.2 Latin America, Middle East & Africa Agricultural Fumigants Consumption by Country (2019-2030)
4.6.3 Mexico
4.6.4 Brazil
4.6.5 Turkey
5 Segment by Type
5.1 Global Agricultural Fumigants Production by Type (2019-2030)
5.1.1 Global Agricultural Fumigants Production by Type (2019-2024)
5.1.2 Global Agricultural Fumigants Production by Type (2025-2030)
5.1.3 Global Agricultural Fumigants Production Market Share by Type (2019-2030)
5.2 Global Agricultural Fumigants Production Value by Type (2019-2030)
5.2.1 Global Agricultural Fumigants Production Value by Type (2019-2024)
5.2.2 Global Agricultural Fumigants Production Value by Type (2025-2030)
5.2.3 Global Agricultural Fumigants Production Value Market Share by Type (2019-2030)
5.3 Global Agricultural Fumigants Price by Type (2019-2030)
6 Segment by Application
6.1 Global Agricultural Fumigants Production by Application (2019-2030)
6.1.1 Global Agricultural Fumigants Production by Application (2019-2024)
6.1.2 Global Agricultural Fumigants Production by Application (2025-2030)
6.1.3 Global Agricultural Fumigants Production Market Share by Application (2019-2030)
6.2 Global Agricultural Fumigants Production Value by Application (2019-2030)
6.2.1 Global Agricultural Fumigants Production Value by Application (2019-2024)
6.2.2 Global Agricultural Fumigants Production Value by Application (2025-2030)
6.2.3 Global Agricultural Fumigants Production Value Market Share by Application (2019-2030)
6.3 Global Agricultural Fumigants Price by Application (2019-2030)
7 Key Companies Profiled
7.1 DuPont
7.1.1 DuPont Agricultural Fumigants Corporation Information
7.1.2 DuPont Agricultural Fumigants Product Portfolio
7.1.3 DuPont Agricultural Fumigants Production, Value, Price and Gross Margin (2019-2024)
7.1.4 DuPont Main Business and Markets Served
7.1.5 DuPont Recent Developments/Updates
7.2 AMVAC
7.2.1 AMVAC Agricultural Fumigants Corporation Information
7.2.2 AMVAC Agricultural Fumigants Product Portfolio
7.2.3 AMVAC Agricultural Fumigants Production, Value, Price and Gross Margin (2019-2024)
7.2.4 AMVAC Main Business and Markets Served
7.2.5 AMVAC Recent Developments/Updates
7.3 ADAMA Agricultural
7.3.1 ADAMA Agricultural Agricultural Fumigants Corporation Information
7.3.2 ADAMA Agricultural Agricultural Fumigants Product Portfolio
7.3.3 ADAMA Agricultural Agricultural Fumigants Production, Value, Price and Gross Margin (2019-2024)
7.3.4 ADAMA Agricultural Main Business and Markets Served
7.3.5 ADAMA Agricultural Recent Developments/Updates
7.4 FMC Corporation
7.4.1 FMC Corporation Agricultural Fumigants Corporation Information
7.4.2 FMC Corporation Agricultural Fumigants Product Portfolio
7.4.3 FMC Corporation Agricultural Fumigants Production, Value, Price and Gross Margin (2019-2024)
7.4.4 FMC Corporation Main Business and Markets Served
7.4.5 FMC Corporation Recent Developments/Updates
7.5 BASF
7.5.1 BASF Agricultural Fumigants Corporation Information
7.5.2 BASF Agricultural Fumigants Product Portfolio
7.5.3 BASF Agricultural Fumigants Production, Value, Price and Gross Margin (2019-2024)
7.5.4 BASF Main Business and Markets Served
7.5.5 BASF Recent Developments/Updates
7.6 Syngenta
7.6.1 Syngenta Agricultural Fumigants Corporation Information
7.6.2 Syngenta Agricultural Fumigants Product Portfolio
7.6.3 Syngenta Agricultural Fumigants Production, Value, Price and Gross Margin (2019-2024)
7.6.4 Syngenta Main Business and Markets Served
7.6.5 Syngenta Recent Developments/Updates
7.7 UPL Group
7.7.1 UPL Group Agricultural Fumigants Corporation Information
7.7.2 UPL Group Agricultural Fumigants Product Portfolio
7.7.3 UPL Group Agricultural Fumigants Production, Value, Price and Gross Margin (2019-2024)
7.7.4 UPL Group Main Business and Markets Served
7.7.5 UPL Group Recent Developments/Updates
7.8 Detia-Degesch
7.8.1 Detia-Degesch Agricultural Fumigants Corporation Information
7.8.2 Detia-Degesch Agricultural Fumigants Product Portfolio
7.8.3 Detia-Degesch Agricultural Fumigants Production, Value, Price and Gross Margin (2019-2024)
7.8.4 Detia-Degesch Main Business and Markets Served
7.7.5 Detia-Degesch Recent Developments/Updates
7.9 Ikeda Kogyo
7.9.1 Ikeda Kogyo Agricultural Fumigants Corporation Information
7.9.2 Ikeda Kogyo Agricultural Fumigants Product Portfolio
7.9.3 Ikeda Kogyo Agricultural Fumigants Production, Value, Price and Gross Margin (2019-2024)
7.9.4 Ikeda Kogyo Main Business and Markets Served
7.9.5 Ikeda Kogyo Recent Developments/Updates
7.10 Arkema
7.10.1 Arkema Agricultural Fumigants Corporation Information
7.10.2 Arkema Agricultural Fumigants Product Portfolio
7.10.3 Arkema Agricultural Fumigants Production, Value, Price and Gross Margin (2019-2024)
7.10.4 Arkema Main Business and Markets Served
7.10.5 Arkema Recent Developments/Updates
7.11 Lanxess
7.11.1 Lanxess Agricultural Fumigants Corporation Information
7.11.2 Lanxess Agricultural Fumigants Product Portfolio
7.11.3 Lanxess Agricultural Fumigants Production, Value, Price and Gross Margin (2019-2024)
7.11.4 Lanxess Main Business and Markets Served
7.11.5 Lanxess Recent Developments/Updates
7.12 Eastman
7.12.1 Eastman Agricultural Fumigants Corporation Information
7.12.2 Eastman Agricultural Fumigants Product Portfolio
7.12.3 Eastman Agricultural Fumigants Production, Value, Price and Gross Margin (2019-2024)
7.12.4 Eastman Main Business and Markets Served
7.12.5 Eastman Recent Developments/Updates
7.13 Solvay
7.13.1 Solvay Agricultural Fumigants Corporation Information
7.13.2 Solvay Agricultural Fumigants Product Portfolio
7.13.3 Solvay Agricultural Fumigants Production, Value, Price and Gross Margin (2019-2024)
7.13.4 Solvay Main Business and Markets Served
7.13.5 Solvay Recent Developments/Updates
7.14 ASHTA Chemicals
7.14.1 ASHTA Chemicals Agricultural Fumigants Corporation Information
7.14.2 ASHTA Chemicals Agricultural Fumigants Product Portfolio
7.14.3 ASHTA Chemicals Agricultural Fumigants Production, Value, Price and Gross Margin (2019-2024)
7.14.4 ASHTA Chemicals Main Business and Markets Served
7.14.5 ASHTA Chemicals Recent Developments/Updates
7.15 Jiangsu Shuangling
7.15.1 Jiangsu Shuangling Agricultural Fumigants Corporation Information
7.15.2 Jiangsu Shuangling Agricultural Fumigants Product Portfolio
7.15.3 Jiangsu Shuangling Agricultural Fumigants Production, Value, Price and Gross Margin (2019-2024)
7.15.4 Jiangsu Shuangling Main Business and Markets Served
7.15.5 Jiangsu Shuangling Recent Developments/Updates
7.16 Dalian Dyechem
7.16.1 Dalian Dyechem Agricultural Fumigants Corporation Information
7.16.2 Dalian Dyechem Agricultural Fumigants Product Portfolio
7.16.3 Dalian Dyechem Agricultural Fumigants Production, Value, Price and Gross Margin (2019-2024)
7.16.4 Dalian Dyechem Main Business and Markets Served
7.16.5 Dalian Dyechem Recent Developments/Updates
7.17 Shenyang Fengshou
7.17.1 Shenyang Fengshou Agricultural Fumigants Corporation Information
7.17.2 Shenyang Fengshou Agricultural Fumigants Product Portfolio
7.17.3 Shenyang Fengshou Agricultural Fumigants Production, Value, Price and Gross Margin (2019-2024)
7.17.4 Shenyang Fengshou Main Business and Markets Served
7.17.5 Shenyang Fengshou Recent Developments/Updates
7.18 Jining Shengcheng
7.18.1 Jining Shengcheng Agricultural Fumigants Corporation Information
7.18.2 Jining Shengcheng Agricultural Fumigants Product Portfolio
7.18.3 Jining Shengcheng Agricultural Fumigants Production, Value, Price and Gross Margin (2019-2024)
7.18.4 Jining Shengcheng Main Business and Markets Served
7.18.5 Jining Shengcheng Recent Developments/Updates
7.19 Nantong Shizhuang
7.19.1 Nantong Shizhuang Agricultural Fumigants Corporation Information
7.19.2 Nantong Shizhuang Agricultural Fumigants Product Portfolio
7.19.3 Nantong Shizhuang Agricultural Fumigants Production, Value, Price and Gross Margin (2019-2024)
7.19.4 Nantong Shizhuang Main Business and Markets Served
7.19.5 Nantong Shizhuang Recent Developments/Updates
7.20 Limin Chemical
7.20.1 Limin Chemical Agricultural Fumigants Corporation Information
7.20.2 Limin Chemical Agricultural Fumigants Product Portfolio
7.20.3 Limin Chemical Agricultural Fumigants Production, Value, Price and Gross Margin (2019-2024)
7.20.4 Limin Chemical Main Business and Markets Served
7.20.5 Limin Chemical Recent Developments/Updates
7.21 Lianyungang Dead Sea Bromine
7.21.1 Lianyungang Dead Sea Bromine Agricultural Fumigants Corporation Information
7.21.2 Lianyungang Dead Sea Bromine Agricultural Fumigants Product Portfolio
7.21.3 Lianyungang Dead Sea Bromine Agricultural Fumigants Production, Value, Price and Gross Margin (2019-2024)
7.21.4 Lianyungang Dead Sea Bromine Main Business and Markets Served
7.21.5 Lianyungang Dead Sea Bromine Recent Developments/Updates
8 Industry Chain and Sales Channels Analysis
8.1 Agricultural Fumigants Industry Chain Analysis
8.2 Agricultural Fumigants Key Raw Materials
8.2.1 Key Raw Materials
8.2.2 Raw Materials Key Suppliers
8.3 Agricultural Fumigants Production Mode & Process
8.4 Agricultural Fumigants Sales and Marketing
8.4.1 Agricultural Fumigants Sales Channels
8.4.2 Agricultural Fumigants Distributors
8.5 Agricultural Fumigants Customers
9 Agricultural Fumigants Market Dynamics
9.1 Agricultural Fumigants Industry Trends
9.2 Agricultural Fumigants Market Drivers
9.3 Agricultural Fumigants Market Challenges
9.4 Agricultural Fumigants Market Restraints
10 Research Finding and Conclusion
11 Methodology and Data Source
11.1 Methodology/Research Approach
11.1.1 Research Programs/Design
11.1.2 Market Size Estimation
11.1.3 Market Breakdown and Data Triangulation
11.2 Data Source
11.2.1 Secondary Sources
11.2.2 Primary Sources
11.3 Author List
11.4 Disclaimer
List of Tables
    Table 1. Global Agricultural Fumigants Market Value by Type, (US$ Million) & (2023 VS 2030)
    Table 2. Global Agricultural Fumigants Market Value by Application, (US$ Million) & (2023 VS 2030)
    Table 3. Global Agricultural Fumigants Production Capacity (Ton) by Manufacturers in 2023
    Table 4. Global Agricultural Fumigants Production by Manufacturers (2019-2024) & (Ton)
    Table 5. Global Agricultural Fumigants Production Market Share by Manufacturers (2019-2024)
    Table 6. Global Agricultural Fumigants Production Value by Manufacturers (2019-2024) & (US$ Million)
    Table 7. Global Agricultural Fumigants Production Value Share by Manufacturers (2019-2024)
    Table 8. Global Agricultural Fumigants Industry Ranking 2022 VS 2023 VS 2024
    Table 9. Company Type (Tier 1, Tier 2 and Tier 3) & (based on the Revenue in Agricultural Fumigants as of 2023)
    Table 10. Global Market Agricultural Fumigants Average Price by Manufacturers (USD/Ton) & (2019-2024)
    Table 11. Manufacturers Agricultural Fumigants Production Sites and Area Served
    Table 12. Manufacturers Agricultural Fumigants Product Types
    Table 13. Global Agricultural Fumigants Manufacturers Market Concentration Ratio (CR5 and HHI)
    Table 14. Mergers & Acquisitions, Expansion
    Table 15. Global Agricultural Fumigants Production Value by Region: 2019 VS 2023 VS 2030 (US$ Million)
    Table 16. Global Agricultural Fumigants Production Value (US$ Million) by Region (2019-2024)
    Table 17. Global Agricultural Fumigants Production Value Market Share by Region (2019-2024)
    Table 18. Global Agricultural Fumigants Production Value (US$ Million) Forecast by Region (2025-2030)
    Table 19. Global Agricultural Fumigants Production Value Market Share Forecast by Region (2025-2030)
    Table 20. Global Agricultural Fumigants Production Comparison by Region: 2019 VS 2023 VS 2030 (Ton)
    Table 21. Global Agricultural Fumigants Production (Ton) by Region (2019-2024)
    Table 22. Global Agricultural Fumigants Production Market Share by Region (2019-2024)
    Table 23. Global Agricultural Fumigants Production (Ton) Forecast by Region (2025-2030)
    Table 24. Global Agricultural Fumigants Production Market Share Forecast by Region (2025-2030)
    Table 25. Global Agricultural Fumigants Market Average Price (USD/Ton) by Region (2019-2024)
    Table 26. Global Agricultural Fumigants Market Average Price (USD/Ton) by Region (2025-2030)
    Table 27. Global Agricultural Fumigants Consumption Growth Rate by Region: 2019 VS 2023 VS 2030 (Ton)
    Table 28. Global Agricultural Fumigants Consumption by Region (2019-2024) & (Ton)
    Table 29. Global Agricultural Fumigants Consumption Market Share by Region (2019-2024)
    Table 30. Global Agricultural Fumigants Forecasted Consumption by Region (2025-2030) & (Ton)
    Table 31. Global Agricultural Fumigants Forecasted Consumption Market Share by Region (2019-2024)
    Table 32. North America Agricultural Fumigants Consumption Growth Rate by Country: 2019 VS 2023 VS 2030 (Ton)
    Table 33. North America Agricultural Fumigants Consumption by Country (2019-2024) & (Ton)
    Table 34. North America Agricultural Fumigants Consumption by Country (2025-2030) & (Ton)
    Table 35. Europe Agricultural Fumigants Consumption Growth Rate by Country: 2019 VS 2023 VS 2030 (Ton)
    Table 36. Europe Agricultural Fumigants Consumption by Country (2019-2024) & (Ton)
    Table 37. Europe Agricultural Fumigants Consumption by Country (2025-2030) & (Ton)
    Table 38. Asia Pacific Agricultural Fumigants Consumption Growth Rate by Region: 2019 VS 2023 VS 2030 (Ton)
    Table 39. Asia Pacific Agricultural Fumigants Consumption by Region (2019-2024) & (Ton)
    Table 40. Asia Pacific Agricultural Fumigants Consumption by Region (2025-2030) & (Ton)
    Table 41. Latin America, Middle East & Africa Agricultural Fumigants Consumption Growth Rate by Country: 2019 VS 2023 VS 2030 (Ton)
    Table 42. Latin America, Middle East & Africa Agricultural Fumigants Consumption by Country (2019-2024) & (Ton)
    Table 43. Latin America, Middle East & Africa Agricultural Fumigants Consumption by Country (2025-2030) & (Ton)
    Table 44. Global Agricultural Fumigants Production (Ton) by Type (2019-2024)
    Table 45. Global Agricultural Fumigants Production (Ton) by Type (2025-2030)
    Table 46. Global Agricultural Fumigants Production Market Share by Type (2019-2024)
    Table 47. Global Agricultural Fumigants Production Market Share by Type (2025-2030)
    Table 48. Global Agricultural Fumigants Production Value (US$ Million) by Type (2019-2024)
    Table 49. Global Agricultural Fumigants Production Value (US$ Million) by Type (2025-2030)
    Table 50. Global Agricultural Fumigants Production Value Share by Type (2019-2024)
    Table 51. Global Agricultural Fumigants Production Value Share by Type (2025-2030)
    Table 52. Global Agricultural Fumigants Price (USD/Ton) by Type (2019-2024)
    Table 53. Global Agricultural Fumigants Price (USD/Ton) by Type (2025-2030)
    Table 54. Global Agricultural Fumigants Production (Ton) by Application (2019-2024)
    Table 55. Global Agricultural Fumigants Production (Ton) by Application (2025-2030)
    Table 56. Global Agricultural Fumigants Production Market Share by Application (2019-2024)
    Table 57. Global Agricultural Fumigants Production Market Share by Application (2025-2030)
    Table 58. Global Agricultural Fumigants Production Value (US$ Million) by Application (2019-2024)
    Table 59. Global Agricultural Fumigants Production Value (US$ Million) by Application (2025-2030)
    Table 60. Global Agricultural Fumigants Production Value Share by Application (2019-2024)
    Table 61. Global Agricultural Fumigants Production Value Share by Application (2025-2030)
    Table 62. Global Agricultural Fumigants Price (USD/Ton) by Application (2019-2024)
    Table 63. Global Agricultural Fumigants Price (USD/Ton) by Application (2025-2030)
    Table 64. DuPont Agricultural Fumigants Corporation Information
    Table 65. DuPont Specification and Application
    Table 66. DuPont Agricultural Fumigants Production (Ton), Value (US$ Million), Price (USD/Ton) and Gross Margin (2019-2024)
    Table 67. DuPont Main Business and Markets Served
    Table 68. DuPont Recent Developments/Updates
    Table 69. AMVAC Agricultural Fumigants Corporation Information
    Table 70. AMVAC Specification and Application
    Table 71. AMVAC Agricultural Fumigants Production (Ton), Value (US$ Million), Price (USD/Ton) and Gross Margin (2019-2024)
    Table 72. AMVAC Main Business and Markets Served
    Table 73. AMVAC Recent Developments/Updates
    Table 74. ADAMA Agricultural Agricultural Fumigants Corporation Information
    Table 75. ADAMA Agricultural Specification and Application
    Table 76. ADAMA Agricultural Agricultural Fumigants Production (Ton), Value (US$ Million), Price (USD/Ton) and Gross Margin (2019-2024)
    Table 77. ADAMA Agricultural Main Business and Markets Served
    Table 78. ADAMA Agricultural Recent Developments/Updates
    Table 79. FMC Corporation Agricultural Fumigants Corporation Information
    Table 80. FMC Corporation Specification and Application
    Table 81. FMC Corporation Agricultural Fumigants Production (Ton), Value (US$ Million), Price (USD/Ton) and Gross Margin (2019-2024)
    Table 82. FMC Corporation Main Business and Markets Served
    Table 83. FMC Corporation Recent Developments/Updates
    Table 84. BASF Agricultural Fumigants Corporation Information
    Table 85. BASF Specification and Application
    Table 86. BASF Agricultural Fumigants Production (Ton), Value (US$ Million), Price (USD/Ton) and Gross Margin (2019-2024)
    Table 87. BASF Main Business and Markets Served
    Table 88. BASF Recent Developments/Updates
    Table 89. Syngenta Agricultural Fumigants Corporation Information
    Table 90. Syngenta Specification and Application
    Table 91. Syngenta Agricultural Fumigants Production (Ton), Value (US$ Million), Price (USD/Ton) and Gross Margin (2019-2024)
    Table 92. Syngenta Main Business and Markets Served
    Table 93. Syngenta Recent Developments/Updates
    Table 94. UPL Group Agricultural Fumigants Corporation Information
    Table 95. UPL Group Specification and Application
    Table 96. UPL Group Agricultural Fumigants Production (Ton), Value (US$ Million), Price (USD/Ton) and Gross Margin (2019-2024)
    Table 97. UPL Group Main Business and Markets Served
    Table 98. UPL Group Recent Developments/Updates
    Table 99. Detia-Degesch Agricultural Fumigants Corporation Information
    Table 100. Detia-Degesch Specification and Application
    Table 101. Detia-Degesch Agricultural Fumigants Production (Ton), Value (US$ Million), Price (USD/Ton) and Gross Margin (2019-2024)
    Table 102. Detia-Degesch Main Business and Markets Served
    Table 103. Detia-Degesch Recent Developments/Updates
    Table 104. Ikeda Kogyo Agricultural Fumigants Corporation Information
    Table 105. Ikeda Kogyo Specification and Application
    Table 106. Ikeda Kogyo Agricultural Fumigants Production (Ton), Value (US$ Million), Price (USD/Ton) and Gross Margin (2019-2024)
    Table 107. Ikeda Kogyo Main Business and Markets Served
    Table 108. Ikeda Kogyo Recent Developments/Updates
    Table 109. Arkema Agricultural Fumigants Corporation Information
    Table 110. Arkema Specification and Application
    Table 111. Arkema Agricultural Fumigants Production (Ton), Value (US$ Million), Price (USD/Ton) and Gross Margin (2019-2024)
    Table 112. Arkema Main Business and Markets Served
    Table 113. Arkema Recent Developments/Updates
    Table 114. Lanxess Agricultural Fumigants Corporation Information
    Table 115. Lanxess Specification and Application
    Table 116. Lanxess Agricultural Fumigants Production (Ton), Value (US$ Million), Price (USD/Ton) and Gross Margin (2019-2024)
    Table 117. Lanxess Main Business and Markets Served
    Table 118. Lanxess Recent Developments/Updates
    Table 119. Eastman Agricultural Fumigants Corporation Information
    Table 120. Eastman Specification and Application
    Table 121. Eastman Agricultural Fumigants Production (Ton), Value (US$ Million), Price (USD/Ton) and Gross Margin (2019-2024)
    Table 122. Eastman Main Business and Markets Served
    Table 123. Eastman Recent Developments/Updates
    Table 124. Solvay Agricultural Fumigants Corporation Information
    Table 125. Solvay Specification and Application
    Table 126. Solvay Agricultural Fumigants Production (Ton), Value (US$ Million), Price (USD/Ton) and Gross Margin (2019-2024)
    Table 127. Solvay Main Business and Markets Served
    Table 128. Solvay Recent Developments/Updates
    Table 129. ASHTA Chemicals Agricultural Fumigants Corporation Information
    Table 130. ASHTA Chemicals Specification and Application
    Table 131. ASHTA Chemicals Agricultural Fumigants Production (Ton), Value (US$ Million), Price (USD/Ton) and Gross Margin (2019-2024)
    Table 132. ASHTA Chemicals Main Business and Markets Served
    Table 133. ASHTA Chemicals Recent Developments/Updates
    Table 134. ASHTA Chemicals Agricultural Fumigants Corporation Information
    Table 135. Jiangsu Shuangling Specification and Application
    Table 136. Jiangsu Shuangling Agricultural Fumigants Production (Ton), Value (US$ Million), Price (USD/Ton) and Gross Margin (2019-2024)
    Table 137. Jiangsu Shuangling Main Business and Markets Served
    Table 138. Jiangsu Shuangling Recent Developments/Updates
    Table 139. Dalian Dyechem Agricultural Fumigants Corporation Information
    Table 140. Dalian Dyechem Agricultural Fumigants Production (Ton), Value (US$ Million), Price (USD/Ton) and Gross Margin (2019-2024)
    Table 141. Dalian Dyechem Main Business and Markets Served
    Table 142. Dalian Dyechem Recent Developments/Updates
    Table 143. Shenyang Fengshou Agricultural Fumigants Corporation Information
    Table 144. Shenyang Fengshou Specification and Application
    Table 145. Shenyang Fengshou Agricultural Fumigants Production (Ton), Value (US$ Million), Price (USD/Ton) and Gross Margin (2019-2024)
    Table 146. Shenyang Fengshou Main Business and Markets Served
    Table 147. Shenyang Fengshou Recent Developments/Updates
    Table 148. Jining Shengcheng Agricultural Fumigants Corporation Information
    Table 149. Jining Shengcheng Specification and Application
    Table 150. Jining Shengcheng Agricultural Fumigants Production (Ton), Value (US$ Million), Price (USD/Ton) and Gross Margin (2019-2024)
    Table 151. Jining Shengcheng Main Business and Markets Served
    Table 152. Jining Shengcheng Recent Developments/Updates
    Table 153. Nantong Shizhuang Agricultural Fumigants Corporation Information
    Table 154. Nantong Shizhuang Specification and Application
    Table 155. Nantong Shizhuang Agricultural Fumigants Production (Ton), Value (US$ Million), Price (USD/Ton) and Gross Margin (2019-2024)
    Table 156. Nantong Shizhuang Main Business and Markets Served
    Table 157. Nantong Shizhuang Recent Developments/Updates
    Table 158. Limin Chemical Agricultural Fumigants Corporation Information
    Table 159. Limin Chemical Specification and Application
    Table 160. Limin Chemical Agricultural Fumigants Production (Ton), Value (US$ Million), Price (USD/Ton) and Gross Margin (2019-2024)
    Table 161. Limin Chemical Main Business and Markets Served
    Table 162. Limin Chemical Recent Developments/Updates
    Table 163. Lianyungang Dead Sea Bromine Agricultural Fumigants Corporation Information
    Table 164. Lianyungang Dead Sea Bromine Specification and Application
    Table 165. Lianyungang Dead Sea Bromine Agricultural Fumigants Production (Ton), Value (US$ Million), Price (USD/Ton) and Gross Margin (2019-2024)
    Table 166. Lianyungang Dead Sea Bromine Main Business and Markets Served
    Table 167. Lianyungang Dead Sea Bromine Recent Developments/Updates
    Table 168. Key Raw Materials Lists
    Table 169. Raw Materials Key Suppliers Lists
    Table 170. Agricultural Fumigants Distributors List
    Table 171. Agricultural Fumigants Customers List
    Table 172. Agricultural Fumigants Market Trends
    Table 173. Agricultural Fumigants Market Drivers
    Table 174. Agricultural Fumigants Market Challenges
    Table 175. Agricultural Fumigants Market Restraints
    Table 176. Research Programs/Design for This Report
    Table 177. Key Data Information from Secondary Sources
    Table 178. Key Data Information from Primary Sources
List of Figures
    Figure 1. Product Picture of Agricultural Fumigants
    Figure 2. Global Agricultural Fumigants Market Value by Type, (US$ Million) & (2023 VS 2030)
    Figure 3. Global Agricultural Fumigants Market Share by Type: 2023 VS 2030
    Figure 4. 1,3-Dichloropropene Product Picture
    Figure 5. Chloropicrin Product Picture
    Figure 6. Methyl Bromide Product Picture
    Figure 7. Metam Sodium Product Picture
    Figure 8. Phosphine Product Picture
    Figure 9. Others Product Picture
    Figure 10. Global Agricultural Fumigants Market Value by Application, (US$ Million) & (2023 VS 2030)
    Figure 11. Global Agricultural Fumigants Market Share by Application: 2023 VS 2030
    Figure 12. Soil Consumption
    Figure 13. Warehouse Consumption
    Figure 14. Global Agricultural Fumigants Production Value (US$ Million), 2019 VS 2023 VS 2030
    Figure 15. Global Agricultural Fumigants Production Value (US$ Million) & (2019-2030)
    Figure 16. Global Agricultural Fumigants Production Capacity (Ton) & (2019-2030)
    Figure 17. Global Agricultural Fumigants Production (Ton) & (2019-2030)
    Figure 18. Global Agricultural Fumigants Average Price (USD/Ton) & (2019-2030)
    Figure 19. Agricultural Fumigants Report Years Considered
    Figure 20. Agricultural Fumigants Production Share by Manufacturers in 2023
    Figure 21. Agricultural Fumigants Market Share by Company Type (Tier 1, Tier 2, and Tier 3): 2019 VS 2023
    Figure 22. The Global 5 and 10 Largest Players: Market Share by Agricultural Fumigants Revenue in 2023
    Figure 23. Global Agricultural Fumigants Production Value by Region: 2019 VS 2023 VS 2030 (US$ Million)
    Figure 24. Global Agricultural Fumigants Production Value Market Share by Region: 2019 VS 2023 VS 2030
    Figure 25. Global Agricultural Fumigants Production Comparison by Region: 2019 VS 2023 VS 2030 (Ton)
    Figure 26. Global Agricultural Fumigants Production Market Share by Region: 2019 VS 2023 VS 2030
    Figure 27. North America Agricultural Fumigants Production Value (US$ Million) Growth Rate (2019-2030)
    Figure 28. Europe Agricultural Fumigants Production Value (US$ Million) Growth Rate (2019-2030)
    Figure 29. China Agricultural Fumigants Production Value (US$ Million) Growth Rate (2019-2030)
    Figure 30. Japan Agricultural Fumigants Production Value (US$ Million) Growth Rate (2019-2030)
    Figure 31. India Agricultural Fumigants Production Value (US$ Million) Growth Rate (2019-2030)
    Figure 32. Latin America Agricultural Fumigants Production Value (US$ Million) Growth Rate (2019-2030)
    Figure 33. Mid East & Africa Agricultural Fumigants Production Value (US$ Million) Growth Rate (2019-2030)
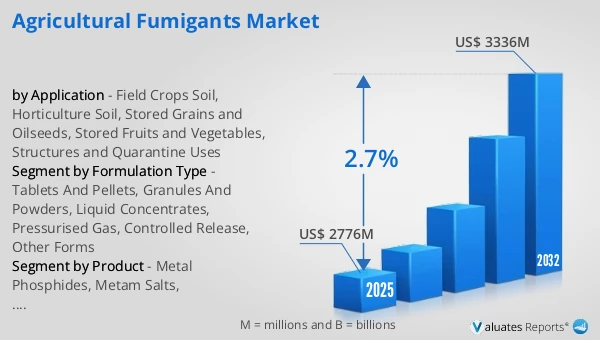
    Figure 34. Global Agricultural Fumigants Consumption by Region: 2019 VS 2023 VS 2030 (Ton)
    Figure 35. Global Agricultural Fumigants Consumption Market Share by Region: 2019 VS 2023 VS 2030
    Figure 36. North America Agricultural Fumigants Consumption and Growth Rate (2019-2024) & (Ton)
    Figure 37. North America Agricultural Fumigants Consumption Market Share by Country (2019-2030)
    Figure 38. Canada Agricultural Fumigants Consumption and Growth Rate (2019-2024) & (Ton)
    Figure 39. U.S. Agricultural Fumigants Consumption and Growth Rate (2019-2024) & (Ton)
    Figure 40. Europe Agricultural Fumigants Consumption and Growth Rate (2019-2024) & (Ton)
    Figure 41. Europe Agricultural Fumigants Consumption Market Share by Country (2019-2030)
    Figure 42. Germany Agricultural Fumigants Consumption and Growth Rate (2019-2024) & (Ton)
    Figure 43. France Agricultural Fumigants Consumption and Growth Rate (2019-2024) & (Ton)
    Figure 44. U.K. Agricultural Fumigants Consumption and Growth Rate (2019-2024) & (Ton)
    Figure 45. Italy Agricultural Fumigants Consumption and Growth Rate (2019-2024) & (Ton)
    Figure 46. Russia Agricultural Fumigants Consumption and Growth Rate (2019-2024) & (Ton)
    Figure 47. Asia Pacific Agricultural Fumigants Consumption and Growth Rate (2019-2024) & (Ton)
    Figure 48. Asia Pacific Agricultural Fumigants Consumption Market Share by Regions (2019-2030)
    Figure 49. China Agricultural Fumigants Consumption and Growth Rate (2019-2024) & (Ton)
    Figure 50. Japan Agricultural Fumigants Consumption and Growth Rate (2019-2024) & (Ton)
    Figure 51. South Korea Agricultural Fumigants Consumption and Growth Rate (2019-2024) & (Ton)
    Figure 52. China Taiwan Agricultural Fumigants Consumption and Growth Rate (2019-2024) & (Ton)
    Figure 53. Southeast Asia Agricultural Fumigants Consumption and Growth Rate (2019-2024) & (Ton)
    Figure 54. India Agricultural Fumigants Consumption and Growth Rate (2019-2024) & (Ton)
    Figure 55. Latin America, Middle East & Africa Agricultural Fumigants Consumption and Growth Rate (2019-2024) & (Ton)
    Figure 56. Latin America, Middle East & Africa Agricultural Fumigants Consumption Market Share by Country (2019-2030)
    Figure 57. Mexico Agricultural Fumigants Consumption and Growth Rate (2019-2024) & (Ton)
    Figure 58. Brazil Agricultural Fumigants Consumption and Growth Rate (2019-2024) & (Ton)
    Figure 59. Turkey Agricultural Fumigants Consumption and Growth Rate (2019-2024) & (Ton)
    Figure 60. GCC Countries Agricultural Fumigants Consumption and Growth Rate (2019-2024) & (Ton)
    Figure 61. Global Production Market Share of Agricultural Fumigants by Type (2019-2030)
    Figure 62. Global Production Value Market Share of Agricultural Fumigants by Type (2019-2030)
    Figure 63. Global Agricultural Fumigants Price (USD/Ton) by Type (2019-2030)
    Figure 64. Global Production Market Share of Agricultural Fumigants by Application (2019-2030)
    Figure 65. Global Production Value Market Share of Agricultural Fumigants by Application (2019-2030)
    Figure 66. Global Agricultural Fumigants Price (USD/Ton) by Application (2019-2030)
    Figure 67. Agricultural Fumigants Value Chain
    Figure 68. Agricultural Fumigants Production Process
    Figure 69. Channels of Distribution (Direct Vs Distribution)
    Figure 70. Distributors Profiles
    Figure 71. Bottom-up and Top-down Approaches for This Report
    Figure 72. Data Triangulation
SELECT A FORMAT
Added to Cart
Electronic (PDF)

$2900

This license allows only one user to access the PDF.
Electronic (PDF)

$4350

This license allows 1 - 5 user to access the PDF, license is suitable for small groups of 5 users working together
Electronic (PDF)

$5800

This license allows users/teams in a same Enterprise to use this report, various departments within an enterpise can use this report
Add to Cart
Buy Now (15% Discount)

OUR CUSTOMER

Accenture

SIMILAR REPORTS


RELATED REPORTS

Global Forestry Skidders Market Research Report 2024

120 Pages
Type: Report
Code: QYRE-Auto-9Q8512
Wed Apr 17 00:00:00 UTC 2024

Add to Cart

Global Field Crops Drip Irrigation Emitter Market Research Report 2024

120 Pages
Type: Report
Code: QYRE-Auto-36H8350
Wed Apr 17 00:00:00 UTC 2024

Add to Cart

Global Hay Mergers Market Research Report 2024

120 Pages
Type: Report
Code: QYRE-Auto-19A8470
Wed Apr 17 00:00:00 UTC 2024

Add to Cart

Global Forestry Winches Market Research Report 2024

120 Pages
Type: Report
Code: QYRE-Auto-38S8269
Wed Apr 17 00:00:00 UTC 2024

Add to Cart