List of Tables
Table 1. Interactive Video Wall Market Trends
Table 2. Interactive Video Wall Market Drivers & Opportunity
Table 3. Interactive Video Wall Market Challenges
Table 4. Interactive Video Wall Market Restraints
Table 5. Global Interactive Video Wall Revenue by Company (2019-2024) & (US$ Million)
Table 6. Global Interactive Video Wall Revenue Market Share by Company (2019-2024)
Table 7. Global Interactive Video Wall Sales Volume by Company (2019-2024) & (K Units)
Table 8. Global Interactive Video Wall Sales Volume Market Share by Company (2019-2024)
Table 9. Global Market Interactive Video Wall Price by Company (2019-2024) & (USD/Unit)
Table 10. Key Manufacturers Interactive Video Wall Manufacturing Base Distribution and Headquarters
Table 11. Key Manufacturers Interactive Video Wall Product Type
Table 12. Key Manufacturers Time to Begin Mass Production of Interactive Video Wall
Table 13. Global Interactive Video Wall Manufacturers Market Concentration Ratio (CR5 and HHI)
Table 14. Global Top Manufacturers Market Share by Company Type (Tier 1, Tier 2, and Tier 3) & (based on the Revenue in Interactive Video Wall as of 2023)
Table 15. Mergers & Acquisitions, Expansion Plans
Table 16. Global Interactive Video Wall Sales Value by Technology: 2019 VS 2023 VS 2030 (US$ Million)
Table 17. Global Interactive Video Wall Sales Value by Technology (2019-2024) & (US$ Million)
Table 18. Global Interactive Video Wall Sales Value by Technology (2025-2030) & (US$ Million)
Table 19. Global Interactive Video Wall Sales Market Share in Value by Technology (2019-2024) & (%)
Table 20. Global Interactive Video Wall Sales Market Share in Value by Technology (2025-2030) & (%)
Table 21. Global Interactive Video Wall Sales Volume by Technology: 2019 VS 2023 VS 2030 (K Units)
Table 22. Global Interactive Video Wall Sales Volume by Technology (2019-2024) & (K Units)
Table 23. Global Interactive Video Wall Sales Volume by Technology (2025-2030) & (K Units)
Table 24. Global Interactive Video Wall Sales Market Share in Volume by Technology (2019-2024) & (%)
Table 25. Global Interactive Video Wall Sales Market Share in Volume by Technology (2025-2030) & (%)
Table 26. Global Interactive Video Wall Price by Technology (2019-2024) & (USD/Unit)
Table 27. Global Interactive Video Wall Price by Technology (2025-2030) & (USD/Unit)
Table 28. Global Interactive Video Wall Sales Value by Application: 2019 VS 2023 VS 2030 (US$ Million)
Table 29. Global Interactive Video Wall Sales Value by Application (2019-2024) & (US$ Million)
Table 30. Global Interactive Video Wall Sales Value by Application (2025-2030) & (US$ Million)
Table 31. Global Interactive Video Wall Sales Market Share in Value by Application (2019-2024) & (%)
Table 32. Global Interactive Video Wall Sales Market Share in Value by Application (2025-2030) & (%)
Table 33. Global Interactive Video Wall Sales Volume by Application: 2019 VS 2023 VS 2030 (K Units)
Table 34. Global Interactive Video Wall Sales Volume by Application (2019-2024) & (K Units)
Table 35. Global Interactive Video Wall Sales Volume by Application (2025-2030) & (K Units)
Table 36. Global Interactive Video Wall Sales Market Share in Volume by Application (2019-2024) & (%)
Table 37. Global Interactive Video Wall Sales Market Share in Volume by Application (2025-2030) & (%)
Table 38. Global Interactive Video Wall Price by Application (2019-2024) & (USD/Unit)
Table 39. Global Interactive Video Wall Price by Application (2025-2030) & (USD/Unit)
Table 40. Global Interactive Video Wall Sales Value by Region: 2019 VS 2023 VS 2030 (US$ Million)
Table 41. Global Interactive Video Wall Sales Value by Region (2019-2024) & (US$ Million)
Table 42. Global Interactive Video Wall Sales Value by Region (2025-2030) & (US$ Million)
Table 43. Global Interactive Video Wall Sales Value by Region (2019-2024) & (%)
Table 44. Global Interactive Video Wall Sales Value by Region (2025-2030) & (%)
Table 45. Global Interactive Video Wall Sales Volume by Region (K Units): 2019 VS 2023 VS 2030
Table 46. Global Interactive Video Wall Sales Volume by Region (2019-2024) & (K Units)
Table 47. Global Interactive Video Wall Sales Volume by Region (2025-2030) & (K Units)
Table 48. Global Interactive Video Wall Sales Volume by Region (2019-2024) & (%)
Table 49. Global Interactive Video Wall Sales Volume by Region (2025-2030) & (%)
Table 50. Global Interactive Video Wall Average Price by Region (2019-2024) & (USD/Unit)
Table 51. Global Interactive Video Wall Average Price by Region (2025-2030) & (USD/Unit)
Table 52. Key Countries/Regions Interactive Video Wall Sales Value Growth Trends, (US$ Million): 2019 VS 2023 VS 2030
Table 53. Key Countries/Regions Interactive Video Wall Sales Value, (2019-2024) & (US$ Million)
Table 54. Key Countries/Regions Interactive Video Wall Sales Value, (2025-2030) & (US$ Million)
Table 55. Key Countries/Regions Interactive Video Wall Sales Volume, (2019-2024) & (K Units)
Table 56. Key Countries/Regions Interactive Video Wall Sales Volume, (2025-2030) & (K Units)
Table 57. Barco Company Information
Table 58. Barco Introduction and Business Overview
Table 59. Barco Interactive Video Wall Sales (K Units), Revenue (US$ Million), Price (USD/Unit) and Gross Margin (2019-2024)
Table 60. Barco Interactive Video Wall Product Offerings
Table 61. Barco Recent Development
Table 62. Christie Company Information
Table 63. Christie Introduction and Business Overview
Table 64. Christie Interactive Video Wall Sales (K Units), Revenue (US$ Million), Price (USD/Unit) and Gross Margin (2019-2024)
Table 65. Christie Interactive Video Wall Product Offerings
Table 66. Christie Recent Development
Table 67. Daktronics Company Information
Table 68. Daktronics Introduction and Business Overview
Table 69. Daktronics Interactive Video Wall Sales (K Units), Revenue (US$ Million), Price (USD/Unit) and Gross Margin (2019-2024)
Table 70. Daktronics Interactive Video Wall Product Offerings
Table 71. Daktronics Recent Development
Table 72. Lighthouse Company Information
Table 73. Lighthouse Introduction and Business Overview
Table 74. Lighthouse Interactive Video Wall Sales (K Units), Revenue (US$ Million), Price (USD/Unit) and Gross Margin (2019-2024)
Table 75. Lighthouse Interactive Video Wall Product Offerings
Table 76. Lighthouse Recent Development
Table 77. Planar Company Information
Table 78. Planar Introduction and Business Overview
Table 79. Planar Interactive Video Wall Sales (K Units), Revenue (US$ Million), Price (USD/Unit) and Gross Margin (2019-2024)
Table 80. Planar Interactive Video Wall Product Offerings
Table 81. Planar Recent Development
Table 82. Mitsubishi Electric Company Information
Table 83. Mitsubishi Electric Introduction and Business Overview
Table 84. Mitsubishi Electric Interactive Video Wall Sales (K Units), Revenue (US$ Million), Price (USD/Unit) and Gross Margin (2019-2024)
Table 85. Mitsubishi Electric Interactive Video Wall Product Offerings
Table 86. Mitsubishi Electric Recent Development
Table 87. Delta Company Information
Table 88. Delta Introduction and Business Overview
Table 89. Delta Interactive Video Wall Sales (K Units), Revenue (US$ Million), Price (USD/Unit) and Gross Margin (2019-2024)
Table 90. Delta Interactive Video Wall Product Offerings
Table 91. Delta Recent Development
Table 92. Samsung Company Information
Table 93. Samsung Introduction and Business Overview
Table 94. Samsung Interactive Video Wall Sales (K Units), Revenue (US$ Million), Price (USD/Unit) and Gross Margin (2019-2024)
Table 95. Samsung Interactive Video Wall Product Offerings
Table 96. Samsung Recent Development
Table 97. NEC Company Information
Table 98. NEC Introduction and Business Overview
Table 99. NEC Interactive Video Wall Sales (K Units), Revenue (US$ Million), Price (USD/Unit) and Gross Margin (2019-2024)
Table 100. NEC Interactive Video Wall Product Offerings
Table 101. NEC Recent Development
Table 102. Panasonic Company Information
Table 103. Panasonic Introduction and Business Overview
Table 104. Panasonic Interactive Video Wall Sales (K Units), Revenue (US$ Million), Price (USD/Unit) and Gross Margin (2019-2024)
Table 105. Panasonic Interactive Video Wall Product Offerings
Table 106. Panasonic Recent Development
Table 107. LG Company Information
Table 108. LG Introduction and Business Overview
Table 109. LG Interactive Video Wall Sales (K Units), Revenue (US$ Million), Price (USD/Unit) and Gross Margin (2019-2024)
Table 110. LG Interactive Video Wall Product Offerings
Table 111. LG Recent Development
Table 112. Eyevis Company Information
Table 113. Eyevis Introduction and Business Overview
Table 114. Eyevis Interactive Video Wall Sales (K Units), Revenue (US$ Million), Price (USD/Unit) and Gross Margin (2019-2024)
Table 115. Eyevis Interactive Video Wall Product Offerings
Table 116. Eyevis Recent Development
Table 117. Sharp Company Information
Table 118. Sharp Introduction and Business Overview
Table 119. Sharp Interactive Video Wall Sales (K Units), Revenue (US$ Million), Price (USD/Unit) and Gross Margin (2019-2024)
Table 120. Sharp Interactive Video Wall Product Offerings
Table 121. Sharp Recent Development
Table 122. Philips Company Information
Table 123. Philips Introduction and Business Overview
Table 124. Philips Interactive Video Wall Sales (K Units), Revenue (US$ Million), Price (USD/Unit) and Gross Margin (2019-2024)
Table 125. Philips Interactive Video Wall Product Offerings
Table 126. Philips Recent Development
Table 127. DynaScan Company Information
Table 128. DynaScan Introduction and Business Overview
Table 129. DynaScan Interactive Video Wall Sales (K Units), Revenue (US$ Million), Price (USD/Unit) and Gross Margin (2019-2024)
Table 130. DynaScan Interactive Video Wall Product Offerings
Table 131. DynaScan Recent Development
Table 132. Sony Company Information
Table 133. Sony Introduction and Business Overview
Table 134. Sony Interactive Video Wall Sales (K Units), Revenue (US$ Million), Price (USD/Unit) and Gross Margin (2019-2024)
Table 135. Sony Interactive Video Wall Product Offerings
Table 136. Sony Recent Development
Table 137. Toshiba Company Information
Table 138. Toshiba Introduction and Business Overview
Table 139. Toshiba Interactive Video Wall Sales (K Units), Revenue (US$ Million), Price (USD/Unit) and Gross Margin (2019-2024)
Table 140. Toshiba Interactive Video Wall Product Offerings
Table 141. Toshiba Recent Development
Table 142. Vtron Company Information
Table 143. Vtron Introduction and Business Overview
Table 144. Vtron Interactive Video Wall Sales (K Units), Revenue (US$ Million), Price (USD/Unit) and Gross Margin (2019-2024)
Table 145. Vtron Interactive Video Wall Product Offerings
Table 146. Vtron Recent Development
Table 147. Sansi Company Information
Table 148. Sansi Introduction and Business Overview
Table 149. Sansi Interactive Video Wall Sales (K Units), Revenue (US$ Million), Price (USD/Unit) and Gross Margin (2019-2024)
Table 150. Sansi Interactive Video Wall Product Offerings
Table 151. Sansi Recent Development
Table 152. Konka Company Information
Table 153. Konka Introduction and Business Overview
Table 154. Konka Interactive Video Wall Sales (K Units), Revenue (US$ Million), Price (USD/Unit) and Gross Margin (2019-2024)
Table 155. Konka Interactive Video Wall Product Offerings
Table 156. Konka Recent Development
Table 157. Leyard Company Information
Table 158. Leyard Introduction and Business Overview
Table 159. Leyard Interactive Video Wall Sales (K Units), Revenue (US$ Million), Price (USD/Unit) and Gross Margin (2019-2024)
Table 160. Leyard Interactive Video Wall Product Offerings
Table 161. Leyard Recent Development
Table 162. Odin Company Information
Table 163. Odin Introduction and Business Overview
Table 164. Odin Interactive Video Wall Sales (K Units), Revenue (US$ Million), Price (USD/Unit) and Gross Margin (2019-2024)
Table 165. Odin Interactive Video Wall Product Offerings
Table 166. Odin Recent Development
Table 167. Absen Company Information
Table 168. Absen Introduction and Business Overview
Table 169. Absen Interactive Video Wall Sales (K Units), Revenue (US$ Million), Price (USD/Unit) and Gross Margin (2019-2024)
Table 170. Absen Interactive Video Wall Product Offerings
Table 171. Absen Recent Development
Table 172. Dahua Company Information
Table 173. Dahua Introduction and Business Overview
Table 174. Dahua Interactive Video Wall Sales (K Units), Revenue (US$ Million), Price (USD/Unit) and Gross Margin (2019-2024)
Table 175. Dahua Interactive Video Wall Product Offerings
Table 176. Dahua Recent Development
Table 177. GQY Introduction and Business Overview
Table 178. GQY Interactive Video Wall Sales (K Units), Revenue (US$ Million), Price (USD/Unit) and Gross Margin (2019-2024)
Table 179. GQY Interactive Video Wall Product Offerings
Table 180. GQY Recent Development
Table 181. GQY Company Information
Table 182. Unilumin Company Information
Table 183. Unilumin Introduction and Business Overview
Table 184. Unilumin Interactive Video Wall Sales (K Units), Revenue (US$ Million), Price (USD/Unit) and Gross Margin (2019-2024)
Table 185. Unilumin Interactive Video Wall Product Offerings
Table 186. Unilumin Recent Development
Table 187. Changhong Company Information
Table 188. Changhong Introduction and Business Overview
Table 189. Changhong Interactive Video Wall Sales (K Units), Revenue (US$ Million), Price (USD/Unit) and Gross Margin (2019-2024)
Table 190. Changhong Interactive Video Wall Product Offerings
Table 191. Changhong Recent Development
Table 192. Liantronics Company Information
Table 193. Liantronics Introduction and Business Overview
Table 194. Liantronics Interactive Video Wall Sales (K Units), Revenue (US$ Million), Price (USD/Unit) and Gross Margin (2019-2024)
Table 195. Liantronics Interactive Video Wall Product Offerings
Table 196. Liantronics Recent Development
Table 197. Vewell Company Information
Table 198. Vewell Introduction and Business Overview
Table 199. Vewell Interactive Video Wall Sales (K Units), Revenue (US$ Million), Price (USD/Unit) and Gross Margin (2019-2024)
Table 200. Vewell Interactive Video Wall Product Offerings
Table 201. Vewell Recent Development
Table 202. Szretop Company Information
Table 203. Szretop Introduction and Business Overview
Table 204. Szretop Interactive Video Wall Sales (K Units), Revenue (US$ Million), Price (USD/Unit) and Gross Margin (2019-2024)
Table 205. Szretop Interactive Video Wall Product Offerings
Table 206. Szretop Recent Development
Table 207. Key Raw Materials Lists
Table 208. Raw Materials Key Suppliers Lists
Table 209. Interactive Video Wall Downstream Customers
Table 210. Interactive Video Wall Distributors List
Table 211. Research Programs/Design for This Report
Table 212. Key Data Information from Secondary Sources
Table 213. Key Data Information from Primary Sources
List of Figures
Figure 1. Interactive Video Wall Product Picture
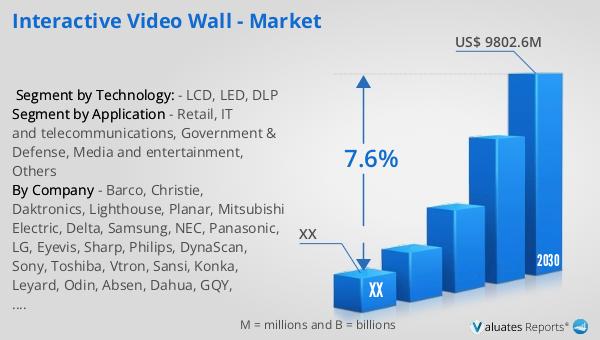
Figure 2. Global Interactive Video Wall Sales Value, 2019 VS 2023 VS 2030 (US$ Million)
Figure 3. Global Interactive Video Wall Sales Value (2019-2030) & (US$ Million)
Figure 4. Global Interactive Video Wall Sales Volume (2019-2030) & (K Units)
Figure 5. Global Interactive Video Wall Sales Price (2019-2030) & (USD/Unit)
Figure 6. Interactive Video Wall Report Years Considered
Figure 7. Global Interactive Video Wall Players Revenue Ranking (2023) & (US$ Million)
Figure 8. Global Interactive Video Wall Players Sales Volume Ranking (2023) & (K Units)
Figure 9. The 5 and 10 Largest Manufacturers in the World: Market Share by Interactive Video Wall Revenue in 2023
Figure 10. Interactive Video Wall Market Share by Company Type (Tier 1, Tier 2, and Tier 3): 2019 VS 2023
Figure 11. LCD Picture
Figure 12. LED Picture
Figure 13. DLP Picture
Figure 14. Global Interactive Video Wall Sales Value by Technology (2019 VS 2023 VS 2030) & (US$ Million)
Figure 15. Global Interactive Video Wall Sales Value Market Share by Technology, 2023 & 2030
Figure 16. Global Interactive Video Wall Sales Volume by Technology (2019 VS 2023 VS 2030) & (K Units)
Figure 17. Global Interactive Video Wall Sales Volume Market Share by Technology, 2023 & 2030
Figure 18. Global Interactive Video Wall Price by Technology (2019-2030) & (USD/Unit)
Figure 19. Product Picture of Retail
Figure 20. Product Picture of IT and telecommunications
Figure 21. Product Picture of Government & Defense
Figure 22. Product Picture of Media and entertainment
Figure 23. Product Picture of Others
Figure 24. Global Interactive Video Wall Sales Value by Application (2019 VS 2023 VS 2030) & (US$ Million)
Figure 25. Global Interactive Video Wall Sales Value Market Share by Application, 2023 & 2030
Figure 26. Global Interactive Video Wall Sales Volume by Application (2019 VS 2023 VS 2030) & (K Units)
Figure 27. Global Interactive Video Wall Sales Volume Market Share by Application, 2023 & 2030
Figure 28. Global Interactive Video Wall Price by Application (2019-2030) & (USD/Unit)
Figure 29. North America Interactive Video Wall Sales Value (2019-2030) & (US$ Million)
Figure 30. North America Interactive Video Wall Sales Value by Country (%), 2023 VS 2030
Figure 31. Europe Interactive Video Wall Sales Value (2019-2030) & (US$ Million)
Figure 32. Europe Interactive Video Wall Sales Value by Country (%), 2023 VS 2030
Figure 33. Asia Pacific Interactive Video Wall Sales Value (2019-2030) & (US$ Million)
Figure 34. Asia Pacific Interactive Video Wall Sales Value by Country (%), 2023 VS 2030
Figure 35. South America Interactive Video Wall Sales Value (2019-2030) & (US$ Million)
Figure 36. South America Interactive Video Wall Sales Value by Country (%), 2023 VS 2030
Figure 37. Middle East & Africa Interactive Video Wall Sales Value (2019-2030) & (US$ Million)
Figure 38. Middle East & Africa Interactive Video Wall Sales Value by Country (%), 2023 VS 2030
Figure 39. Key Countries/Regions Interactive Video Wall Sales Value (%), (2019-2030)
Figure 40. Key Countries/Regions Interactive Video Wall Sales Volume (%), (2019-2030)
Figure 41. United States Interactive Video Wall Sales Value, (2019-2030) & (US$ Million)
Figure 42. United States Interactive Video Wall Sales Value by Technology (%), 2023 VS 2030
Figure 43. United States Interactive Video Wall Sales Value by Application (%), 2023 VS 2030
Figure 44. Europe Interactive Video Wall Sales Value, (2019-2030) & (US$ Million)
Figure 45. Europe Interactive Video Wall Sales Value by Technology (%), 2023 VS 2030
Figure 46. Europe Interactive Video Wall Sales Value by Application (%), 2023 VS 2030
Figure 47. China Interactive Video Wall Sales Value, (2019-2030) & (US$ Million)
Figure 48. China Interactive Video Wall Sales Value by Technology (%), 2023 VS 2030
Figure 49. China Interactive Video Wall Sales Value by Application (%), 2023 VS 2030
Figure 50. Japan Interactive Video Wall Sales Value, (2019-2030) & (US$ Million)
Figure 51. Japan Interactive Video Wall Sales Value by Technology (%), 2023 VS 2030
Figure 52. Japan Interactive Video Wall Sales Value by Application (%), 2023 VS 2030
Figure 53. South Korea Interactive Video Wall Sales Value, (2019-2030) & (US$ Million)
Figure 54. South Korea Interactive Video Wall Sales Value by Technology (%), 2023 VS 2030
Figure 55. South Korea Interactive Video Wall Sales Value by Application (%), 2023 VS 2030
Figure 56. Southeast Asia Interactive Video Wall Sales Value, (2019-2030) & (US$ Million)
Figure 57. Southeast Asia Interactive Video Wall Sales Value by Technology (%), 2023 VS 2030
Figure 58. Southeast Asia Interactive Video Wall Sales Value by Application (%), 2023 VS 2030
Figure 59. India Interactive Video Wall Sales Value, (2019-2030) & (US$ Million)
Figure 60. India Interactive Video Wall Sales Value by Technology (%), 2023 VS 2030
Figure 61. India Interactive Video Wall Sales Value by Application (%), 2023 VS 2030
Figure 62. Interactive Video Wall Industrial Chain
Figure 63. Interactive Video Wall Manufacturing Cost Structure
Figure 64. Channels of Distribution (Direct Sales, and Distribution)
Figure 65. Bottom-up and Top-down Approaches for This Report
Figure 66. Data Triangulation
Figure 67. Key Executives Interviewed