1 Market Overview
1.1 Prefabricated E-House Product Introduction
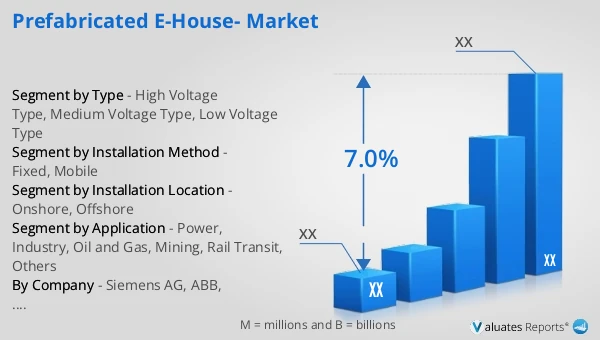
1.2 Global Prefabricated E-House Market Size Forecast
1.2.1 Global Prefabricated E-House Sales Value (2021–2032)
1.2.2 Global Prefabricated E-House Sales Volume (2021–2032)
1.2.3 Global Prefabricated E-House Sales Price (2021–2032)
1.3 Prefabricated E-House Market Trends & Drivers
1.3.1 Prefabricated E-House Industry Trends
1.3.2 Prefabricated E-House Market Drivers & Opportunities
1.3.3 Prefabricated E-House Market Challenges
1.3.4 Prefabricated E-House Market Restraints
1.3.5 Impact of U.S. Tariffs
1.4 Assumptions and Limitations
1.5 Study Objectives
1.6 Years Considered
2 Competitive Analysis by Company
2.1 Global Prefabricated E-House Players Revenue Ranking (2025)
2.2 Global Prefabricated E-House Revenue by Company (2021–2026)
2.3 Global Prefabricated E-House Sales Volume Ranking of Players (2025)
2.4 Global Prefabricated E-House Sales Volume by Company (2021–2026)
2.5 Global Prefabricated E-House Average Price by Company (2021–2026)
2.6 Key Manufacturers Prefabricated E-House Manufacturing Base and Headquarters
2.7 Key Manufacturers Prefabricated E-House Product Offerings
2.8 Key Manufacturers Start of Mass Production of Prefabricated E-House
2.9 Prefabricated E-House Market Competitive Analysis
2.9.1 Prefabricated E-House Market Concentration Rate (2021–2026)
2.9.2 Global 5 and 10 Largest Manufacturers by Prefabricated E-House Revenue in 2025
2.9.3 Global Companies by Tier (Tier 1, Tier 2, Tier 3), based on Prefabricated E-House revenue, 2025
2.10 Mergers & Acquisitions and Expansion
3 Segmentation Prefabricated E-House Market Classification
3.1 Introduction by Type
3.1.1 High Voltage Type
3.1.2 Medium Voltage Type
3.1.3 Low Voltage Type
3.1.4 Global Prefabricated E-House Sales Value by Type
3.1.4.1 Global Prefabricated E-House Sales Value by Type (2021 vs 2025 vs 2032)
3.1.4.2 Global Prefabricated E-House Sales Value, by Type (2021–2032)
3.1.4.3 Global Prefabricated E-House Sales Value, by Type (%), 2021–2032
3.1.5 Global Prefabricated E-House Sales Volume by Type
3.1.5.1 Global Prefabricated E-House Sales Volume by Type (2021 vs 2025 vs 2032)
3.1.5.2 Global Prefabricated E-House Sales Volume, by Type (2021–2032)
3.1.5.3 Global Prefabricated E-House Sales Volume, by Type (%), 2021–2032
3.1.6 Global Prefabricated E-House Average Price by Type (2021–2032)
3.2 Introduction by Installation Method
3.2.1 Fixed
3.2.2 Mobile
3.2.3 Global Prefabricated E-House Sales Value by Installation Method
3.2.3.1 Global Prefabricated E-House Sales Value by Installation Method (2021 vs 2025 vs 2032)
3.2.3.2 Global Prefabricated E-House Sales Value, by Installation Method (2021–2032)
3.2.3.3 Global Prefabricated E-House Sales Value, by Installation Method (%), 2021–2032
3.2.4 Global Prefabricated E-House Sales Volume by Installation Method
3.2.4.1 Global Prefabricated E-House Sales Volume by Installation Method (2021 vs 2025 vs 2032)
3.2.4.2 Global Prefabricated E-House Sales Volume, by Installation Method (2021–2032)
3.2.4.3 Global Prefabricated E-House Sales Volume, by Installation Method (%), 2021–2032
3.2.5 Global Prefabricated E-House Average Price by Installation Method (2021–2032)
3.3 Introduction by Installation Location
3.3.1 Onshore
3.3.2 Offshore
3.3.3 Global Prefabricated E-House Sales Value by Installation Location
3.3.3.1 Global Prefabricated E-House Sales Value by Installation Location (2021 vs 2025 vs 2032)
3.3.3.2 Global Prefabricated E-House Sales Value, by Installation Location (2021–2032)
3.3.3.3 Global Prefabricated E-House Sales Value, by Installation Location (%), 2021–2032
3.3.4 Global Prefabricated E-House Sales Volume by Installation Location
3.3.4.1 Global Prefabricated E-House Sales Volume by Installation Location (2021 vs 2025 vs 2032)
3.3.4.2 Global Prefabricated E-House Sales Volume, by Installation Location (2021–2032)
3.3.4.3 Global Prefabricated E-House Sales Volume, by Installation Location (%), 2021–2032
3.3.5 Global Prefabricated E-House Average Price by Installation Location (2021–2032)
4 Segmentation by Application
4.1 Introduction by Application
4.1.1 Power
4.1.2 Industry
4.1.3 Oil and Gas
4.1.4 Mining
4.1.5 Rail Transit
4.1.6 Others
4.2 Global Prefabricated E-House Sales Value by Application
4.2.1 Global Prefabricated E-House Sales Value by Application (2021 vs 2025 vs 2032)
4.2.2 Global Prefabricated E-House Sales Value, by Application (2021–2032)
4.2.3 Global Prefabricated E-House Sales Value, by Application (%), 2021–2032
4.3 Global Prefabricated E-House Sales Volume by Application
4.3.1 Global Prefabricated E-House Sales Volume by Application (2021 vs 2025 vs 2032)
4.3.2 Global Prefabricated E-House Sales Volume, by Application (2021–2032)
4.3.3 Global Prefabricated E-House Sales Volume, by Application (%), 2021–2032
4.4 Global Prefabricated E-House Average Price by Application (2021–2032)
5 Segmentation by Region
5.1 Global Prefabricated E-House Sales Value by Region
5.1.1 Global Prefabricated E-House Sales Value by Region: 2021 vs 2025 vs 2032
5.1.2 Global Prefabricated E-House Sales Value by Region (2021–2026)
5.1.3 Global Prefabricated E-House Sales Value by Region (2027–2032)
5.1.4 Global Prefabricated E-House Sales Value by Region (%), 2021–2032
5.2 Global Prefabricated E-House Sales Volume by Region
5.2.1 Global Prefabricated E-House Sales Volume by Region: 2021 vs 2025 vs 2032
5.2.2 Global Prefabricated E-House Sales Volume by Region (2021–2026)
5.2.3 Global Prefabricated E-House Sales Volume by Region (2027–2032)
5.2.4 Global Prefabricated E-House Sales Volume by Region (%), 2021–2032
5.3 Global Prefabricated E-House Average Price by Region (2021–2032)
5.4 North America
5.4.1 North America Prefabricated E-House Sales Value, 2021–2032
5.4.2 North America Prefabricated E-House Sales Value by Country (%), 2025 vs 2032
5.5 Europe
5.5.1 Europe Prefabricated E-House Sales Value, 2021–2032
5.5.2 Europe Prefabricated E-House Sales Value by Country (%), 2025 vs 2032
5.6 Asia Pacific
5.6.1 Asia Pacific Prefabricated E-House Sales Value, 2021–2032
5.6.2 Asia Pacific Prefabricated E-House Sales Value by Region (%), 2025 vs 2032
5.7 South America
5.7.1 South America Prefabricated E-House Sales Value, 2021–2032
5.7.2 South America Prefabricated E-House Sales Value by Country (%), 2025 vs 2032
5.8 Middle East & Africa
5.8.1 Middle East & Africa Prefabricated E-House Sales Value, 2021–2032
5.8.2 Middle East & Africa Prefabricated E-House Sales Value by Country (%), 2025 vs 2032
6 Segmentation by Key Countries/Regions
6.1 Key Countries/Regions Prefabricated E-House Sales Value Growth Trends, 2021 vs 2025 vs 2032
6.2 Key Countries/Regions Prefabricated E-House Sales Value and Sales Volume
6.2.1 Key Countries/Regions Prefabricated E-House Sales Value, 2021–2032
6.2.2 Key Countries/Regions Prefabricated E-House Sales Volume, 2021–2032
6.3 United States
6.3.1 United States Prefabricated E-House Sales Value, 2021–2032
6.3.2 United States Prefabricated E-House Sales Value by Type (%), 2025 vs 2032
6.3.3 United States Prefabricated E-House Sales Value by Application, 2025 vs 2032
6.4 Europe
6.4.1 Europe Prefabricated E-House Sales Value, 2021–2032
6.4.2 Europe Prefabricated E-House Sales Value by Type (%), 2025 vs 2032
6.4.3 Europe Prefabricated E-House Sales Value by Application, 2025 vs 2032
6.5 China
6.5.1 China Prefabricated E-House Sales Value, 2021–2032
6.5.2 China Prefabricated E-House Sales Value by Type (%), 2025 vs 2032
6.5.3 China Prefabricated E-House Sales Value by Application, 2025 vs 2032
6.6 Japan
6.6.1 Japan Prefabricated E-House Sales Value, 2021–2032
6.6.2 Japan Prefabricated E-House Sales Value by Type (%), 2025 vs 2032
6.6.3 Japan Prefabricated E-House Sales Value by Application, 2025 vs 2032
6.7 South Korea
6.7.1 South Korea Prefabricated E-House Sales Value, 2021–2032
6.7.2 South Korea Prefabricated E-House Sales Value by Type (%), 2025 vs 2032
6.7.3 South Korea Prefabricated E-House Sales Value by Application, 2025 vs 2032
6.8 Southeast Asia
6.8.1 Southeast Asia Prefabricated E-House Sales Value, 2021–2032
6.8.2 Southeast Asia Prefabricated E-House Sales Value by Type (%), 2025 vs 2032
6.8.3 Southeast Asia Prefabricated E-House Sales Value by Application, 2025 vs 2032
6.9 India
6.9.1 India Prefabricated E-House Sales Value, 2021–2032
6.9.2 India Prefabricated E-House Sales Value by Type (%), 2025 vs 2032
6.9.3 India Prefabricated E-House Sales Value by Application, 2025 vs 2032
7 Company Profiles
7.1 Siemens AG
7.1.1 Siemens AG Company Information
7.1.2 Siemens AG Introduction and Business Overview
7.1.3 Siemens AG Prefabricated E-House Sales, Revenue, Price and Gross Margin (2021–2026)
7.1.4 Siemens AG Prefabricated E-House Product Offerings
7.1.5 Siemens AG Recent Developments
7.2 ABB
7.2.1 ABB Company Information
7.2.2 ABB Introduction and Business Overview
7.2.3 ABB Prefabricated E-House Sales, Revenue, Price and Gross Margin (2021–2026)
7.2.4 ABB Prefabricated E-House Product Offerings
7.2.5 ABB Recent Developments
7.3 Hitachi Energy
7.3.1 Hitachi Energy Company Information
7.3.2 Hitachi Energy Introduction and Business Overview
7.3.3 Hitachi Energy Prefabricated E-House Sales, Revenue, Price and Gross Margin (2021–2026)
7.3.4 Hitachi Energy Prefabricated E-House Product Offerings
7.3.5 Hitachi Energy Recent Developments
7.4 Schneider Electric
7.4.1 Schneider Electric Company Information
7.4.2 Schneider Electric Introduction and Business Overview
7.4.3 Schneider Electric Prefabricated E-House Sales, Revenue, Price and Gross Margin (2021–2026)
7.4.4 Schneider Electric Prefabricated E-House Product Offerings
7.4.5 Schneider Electric Recent Developments
7.5 Eaton
7.5.1 Eaton Company Information
7.5.2 Eaton Introduction and Business Overview
7.5.3 Eaton Prefabricated E-House Sales, Revenue, Price and Gross Margin (2021–2026)
7.5.4 Eaton Prefabricated E-House Product Offerings
7.5.5 Eaton Recent Developments
7.6 iQUORD, SL
7.6.1 iQUORD, SL Company Information
7.6.2 iQUORD, SL Introduction and Business Overview
7.6.3 iQUORD, SL Prefabricated E-House Sales, Revenue, Price and Gross Margin (2021–2026)
7.6.4 iQUORD, SL Prefabricated E-House Product Offerings
7.6.5 iQUORD, SL Recent Developments
7.7 LS ELECTRIC
7.7.1 LS ELECTRIC Company Information
7.7.2 LS ELECTRIC Introduction and Business Overview
7.7.3 LS ELECTRIC Prefabricated E-House Sales, Revenue, Price and Gross Margin (2021–2026)
7.7.4 LS ELECTRIC Prefabricated E-House Product Offerings
7.7.5 LS ELECTRIC Recent Developments
7.8 WEG
7.8.1 WEG Company Information
7.8.2 WEG Introduction and Business Overview
7.8.3 WEG Prefabricated E-House Sales, Revenue, Price and Gross Margin (2021–2026)
7.8.4 WEG Prefabricated E-House Product Offerings
7.8.5 WEG Recent Developments
7.9 Powell Industries
7.9.1 Powell Industries Company Information
7.9.2 Powell Industries Introduction and Business Overview
7.9.3 Powell Industries Prefabricated E-House Sales, Revenue, Price and Gross Margin (2021–2026)
7.9.4 Powell Industries Prefabricated E-House Product Offerings
7.9.5 Powell Industries Recent Developments
7.10 Matelec Group
7.10.1 Matelec Group Company Information
7.10.2 Matelec Group Introduction and Business Overview
7.10.3 Matelec Group Prefabricated E-House Sales, Revenue, Price and Gross Margin (2021–2026)
7.10.4 Matelec Group Prefabricated E-House Product Offerings
7.10.5 Matelec Group Recent Developments
7.11 Aktif Group
7.11.1 Aktif Group Company Information
7.11.2 Aktif Group Introduction and Business Overview
7.11.3 Aktif Group Prefabricated E-House Sales, Revenue, Price and Gross Margin (2021–2026)
7.11.4 Aktif Group Prefabricated E-House Product Offerings
7.11.5 Aktif Group Recent Developments
7.12 Sécheron
7.12.1 Sécheron Company Information
7.12.2 Sécheron Introduction and Business Overview
7.12.3 Sécheron Prefabricated E-House Sales, Revenue, Price and Gross Margin (2021–2026)
7.12.4 Sécheron Prefabricated E-House Product Offerings
7.12.5 Sécheron Recent Developments
7.13 Ampcontrol Pty Ltd
7.13.1 Ampcontrol Pty Ltd Company Information
7.13.2 Ampcontrol Pty Ltd Introduction and Business Overview
7.13.3 Ampcontrol Pty Ltd Prefabricated E-House Sales, Revenue, Price and Gross Margin (2021–2026)
7.13.4 Ampcontrol Pty Ltd Prefabricated E-House Product Offerings
7.13.5 Ampcontrol Pty Ltd Recent Developments
7.14 VEO Group
7.14.1 VEO Group Company Information
7.14.2 VEO Group Introduction and Business Overview
7.14.3 VEO Group Prefabricated E-House Sales, Revenue, Price and Gross Margin (2021–2026)
7.14.4 VEO Group Prefabricated E-House Product Offerings
7.14.5 VEO Group Recent Developments
7.15 Ingeteam
7.15.1 Ingeteam Company Information
7.15.2 Ingeteam Introduction and Business Overview
7.15.3 Ingeteam Prefabricated E-House Sales, Revenue, Price and Gross Margin (2021–2026)
7.15.4 Ingeteam Prefabricated E-House Product Offerings
7.15.5 Ingeteam Recent Developments
7.16 Wasco Berhad
7.16.1 Wasco Berhad Company Information
7.16.2 Wasco Berhad Introduction and Business Overview
7.16.3 Wasco Berhad Prefabricated E-House Sales, Revenue, Price and Gross Margin (2021–2026)
7.16.4 Wasco Berhad Prefabricated E-House Product Offerings
7.16.5 Wasco Berhad Recent Developments
7.17 Meidensha
7.17.1 Meidensha Company Information
7.17.2 Meidensha Introduction and Business Overview
7.17.3 Meidensha Prefabricated E-House Sales, Revenue, Price and Gross Margin (2021–2026)
7.17.4 Meidensha Prefabricated E-House Product Offerings
7.17.5 Meidensha Recent Developments
7.18 VRT
7.18.1 VRT Company Information
7.18.2 VRT Introduction and Business Overview
7.18.3 VRT Prefabricated E-House Sales, Revenue, Price and Gross Margin (2021–2026)
7.18.4 VRT Prefabricated E-House Product Offerings
7.18.5 VRT Recent Developments
7.19 EKOS Group
7.19.1 EKOS Group Company Information
7.19.2 EKOS Group Introduction and Business Overview
7.19.3 EKOS Group Prefabricated E-House Sales, Revenue, Price and Gross Margin (2021–2026)
7.19.4 EKOS Group Prefabricated E-House Product Offerings
7.19.5 EKOS Group Recent Developments
7.20 TGOOD ELECTRIC
7.20.1 TGOOD ELECTRIC Company Information
7.20.2 TGOOD ELECTRIC Introduction and Business Overview
7.20.3 TGOOD ELECTRIC Prefabricated E-House Sales, Revenue, Price and Gross Margin (2021–2026)
7.20.4 TGOOD ELECTRIC Prefabricated E-House Product Offerings
7.20.5 TGOOD ELECTRIC Recent Developments
7.21 XJ ELECTRIC
7.21.1 XJ ELECTRIC Company Information
7.21.2 XJ ELECTRIC Introduction and Business Overview
7.21.3 XJ ELECTRIC Prefabricated E-House Sales, Revenue, Price and Gross Margin (2021–2026)
7.21.4 XJ ELECTRIC Prefabricated E-House Product Offerings
7.21.5 XJ ELECTRIC Recent Developments
7.22 Henan Pinggao Electric
7.22.1 Henan Pinggao Electric Company Information
7.22.2 Henan Pinggao Electric Introduction and Business Overview
7.22.3 Henan Pinggao Electric Prefabricated E-House Sales, Revenue, Price and Gross Margin (2021–2026)
7.22.4 Henan Pinggao Electric Prefabricated E-House Product Offerings
7.22.5 Henan Pinggao Electric Recent Developments
7.23 Sieyuan Electric
7.23.1 Sieyuan Electric Company Information
7.23.2 Sieyuan Electric Introduction and Business Overview
7.23.3 Sieyuan Electric Prefabricated E-House Sales, Revenue, Price and Gross Margin (2021–2026)
7.23.4 Sieyuan Electric Prefabricated E-House Product Offerings
7.23.5 Sieyuan Electric Recent Developments
7.24 Shanghai Electric
7.24.1 Shanghai Electric Company Information
7.24.2 Shanghai Electric Introduction and Business Overview
7.24.3 Shanghai Electric Prefabricated E-House Sales, Revenue, Price and Gross Margin (2021–2026)
7.24.4 Shanghai Electric Prefabricated E-House Product Offerings
7.24.5 Shanghai Electric Recent Developments
7.25 Guodian Nanjing Automation
7.25.1 Guodian Nanjing Automation Company Information
7.25.2 Guodian Nanjing Automation Introduction and Business Overview
7.25.3 Guodian Nanjing Automation Prefabricated E-House Sales, Revenue, Price and Gross Margin (2021–2026)
7.25.4 Guodian Nanjing Automation Prefabricated E-House Product Offerings
7.25.5 Guodian Nanjing Automation Recent Developments
7.26 Guangdong Mingyang Electric
7.26.1 Guangdong Mingyang Electric Company Information
7.26.2 Guangdong Mingyang Electric Introduction and Business Overview
7.26.3 Guangdong Mingyang Electric Prefabricated E-House Sales, Revenue, Price and Gross Margin (2021–2026)
7.26.4 Guangdong Mingyang Electric Prefabricated E-House Product Offerings
7.26.5 Guangdong Mingyang Electric Recent Developments
7.27 TBEA
7.27.1 TBEA Company Information
7.27.2 TBEA Introduction and Business Overview
7.27.3 TBEA Prefabricated E-House Sales, Revenue, Price and Gross Margin (2021–2026)
7.27.4 TBEA Prefabricated E-House Product Offerings
7.27.5 TBEA Recent Developments
7.28 China XD Group
7.28.1 China XD Group Company Information
7.28.2 China XD Group Introduction and Business Overview
7.28.3 China XD Group Prefabricated E-House Sales, Revenue, Price and Gross Margin (2021–2026)
7.28.4 China XD Group Prefabricated E-House Product Offerings
7.28.5 China XD Group Recent Developments
7.29 Qingdao Yihe Electric Group
7.29.1 Qingdao Yihe Electric Group Company Information
7.29.2 Qingdao Yihe Electric Group Introduction and Business Overview
7.29.3 Qingdao Yihe Electric Group Prefabricated E-House Sales, Revenue, Price and Gross Margin (2021–2026)
7.29.4 Qingdao Yihe Electric Group Prefabricated E-House Product Offerings
7.29.5 Qingdao Yihe Electric Group Recent Developments
7.30 Henan Senyuan Electric
7.30.1 Henan Senyuan Electric Company Information
7.30.2 Henan Senyuan Electric Introduction and Business Overview
7.30.3 Henan Senyuan Electric Prefabricated E-House Sales, Revenue, Price and Gross Margin (2021–2026)
7.30.4 Henan Senyuan Electric Prefabricated E-House Product Offerings
7.30.5 Henan Senyuan Electric Recent Developments
7.31 Huayi Electric Company
7.31.1 Huayi Electric Company Company Information
7.31.2 Huayi Electric Company Introduction and Business Overview
7.31.3 Huayi Electric Company Prefabricated E-House Sales, Revenue, Price and Gross Margin (2021–2026)
7.31.4 Huayi Electric Company Prefabricated E-House Product Offerings
7.31.5 Huayi Electric Company Recent Developments
7.32 Shandong Taikai High-Volt Switchgear
7.32.1 Shandong Taikai High-Volt Switchgear Company Information
7.32.2 Shandong Taikai High-Volt Switchgear Introduction and Business Overview
7.32.3 Shandong Taikai High-Volt Switchgear Prefabricated E-House Sales, Revenue, Price and Gross Margin (2021–2026)
7.32.4 Shandong Taikai High-Volt Switchgear Prefabricated E-House Product Offerings
7.32.5 Shandong Taikai High-Volt Switchgear Recent Developments
7.33 Zhongdian Xinyuan (Langfang) Electric Group
7.33.1 Zhongdian Xinyuan (Langfang) Electric Group Company Information
7.33.2 Zhongdian Xinyuan (Langfang) Electric Group Introduction and Business Overview
7.33.3 Zhongdian Xinyuan (Langfang) Electric Group Prefabricated E-House Sales, Revenue, Price and Gross Margin (2021–2026)
7.33.4 Zhongdian Xinyuan (Langfang) Electric Group Prefabricated E-House Product Offerings
7.33.5 Zhongdian Xinyuan (Langfang) Electric Group Recent Developments
7.34 Shijiazhuang Kelin Automation
7.34.1 Shijiazhuang Kelin Automation Company Information
7.34.2 Shijiazhuang Kelin Automation Introduction and Business Overview
7.34.3 Shijiazhuang Kelin Automation Prefabricated E-House Sales, Revenue, Price and Gross Margin (2021–2026)
7.34.4 Shijiazhuang Kelin Automation Prefabricated E-House Product Offerings
7.34.5 Shijiazhuang Kelin Automation Recent Developments
7.35 Beijing Hezong Science&Technology
7.35.1 Beijing Hezong Science&Technology Company Information
7.35.2 Beijing Hezong Science&Technology Introduction and Business Overview
7.35.3 Beijing Hezong Science&Technology Prefabricated E-House Sales, Revenue, Price and Gross Margin (2021–2026)
7.35.4 Beijing Hezong Science&Technology Prefabricated E-House Product Offerings
7.35.5 Beijing Hezong Science&Technology Recent Developments
7.36 Fujian CEE Installations
7.36.1 Fujian CEE Installations Company Information
7.36.2 Fujian CEE Installations Introduction and Business Overview
7.36.3 Fujian CEE Installations Prefabricated E-House Sales, Revenue, Price and Gross Margin (2021–2026)
7.36.4 Fujian CEE Installations Prefabricated E-House Product Offerings
7.36.5 Fujian CEE Installations Recent Developments
7.37 Jiangsu Huachen Transformer
7.37.1 Jiangsu Huachen Transformer Company Information
7.37.2 Jiangsu Huachen Transformer Introduction and Business Overview
7.37.3 Jiangsu Huachen Transformer Prefabricated E-House Sales, Revenue, Price and Gross Margin (2021–2026)
7.37.4 Jiangsu Huachen Transformer Prefabricated E-House Product Offerings
7.37.5 Jiangsu Huachen Transformer Recent Developments
7.38 Chongqing Wangjiang Transformer Factory
7.38.1 Chongqing Wangjiang Transformer Factory Company Information
7.38.2 Chongqing Wangjiang Transformer Factory Introduction and Business Overview
7.38.3 Chongqing Wangjiang Transformer Factory Prefabricated E-House Sales, Revenue, Price and Gross Margin (2021–2026)
7.38.4 Chongqing Wangjiang Transformer Factory Prefabricated E-House Product Offerings
7.38.5 Chongqing Wangjiang Transformer Factory Recent Developments
7.39 Liaoning-EFACEC Electrical Equipment
7.39.1 Liaoning-EFACEC Electrical Equipment Company Information
7.39.2 Liaoning-EFACEC Electrical Equipment Introduction and Business Overview
7.39.3 Liaoning-EFACEC Electrical Equipment Prefabricated E-House Sales, Revenue, Price and Gross Margin (2021–2026)
7.39.4 Liaoning-EFACEC Electrical Equipment Prefabricated E-House Product Offerings
7.39.5 Liaoning-EFACEC Electrical Equipment Recent Developments
7.40 Anhui Derun Electric & Technology
7.40.1 Anhui Derun Electric & Technology Company Information
7.40.2 Anhui Derun Electric & Technology Introduction and Business Overview
7.40.3 Anhui Derun Electric & Technology Prefabricated E-House Sales, Revenue, Price and Gross Margin (2021–2026)
7.40.4 Anhui Derun Electric & Technology Prefabricated E-House Product Offerings
7.40.5 Anhui Derun Electric & Technology Recent Developments
8 Industry Chain Analysis
8.1 Prefabricated E-House Industrial Chain
8.2 Prefabricated E-House Upstream Analysis
8.2.1 Key Raw Materials
8.2.2 Key Suppliers of Raw Materials
8.2.3 Manufacturing Cost Structure
8.3 Midstream Analysis
8.4 Downstream Analysis (Customer Analysis)
8.5 Sales Model and Sales Channelss
8.5.1 Prefabricated E-House Sales Model
8.5.2 Sales Channels
8.5.3 Prefabricated E-House Distributors
9 Research Findings and Conclusion
10 Appendix
10.1 Research Methodology
10.1.1 Methodology/Research Approach
10.1.1.1 Research Programs/Design
10.1.1.2 Market Size Estimation
10.1.1.3 Market Breakdown and Data Triangulation
10.1.2 Data Source
10.1.2.1 Secondary Sources
10.1.2.2 Primary Sources
10.2 Author Details
10.3 Disclaimer