0
U.S. (TOLL FREE)
+1 (315) 215-3225
Automative

0
U.S. (TOLL FREE)
+1 (315) 215-3225
Global Data Monetization Sales Market Report 2023
Published Date: January 2023
|
Report Code: QYRE-Auto-11U9355
Home | Market Reports | Computers & Electronics| Enterprise Technology
Global Data Monetization Market Insights and Forecast to 2028
BUY CHAPTERS

Global Data Monetization Sales Market Report 2023

Code: QYRE-Auto-11U9355
Report
January 2023
Pages:135
QYResearch
Buy Now with 15% Discount
DESCRIPTION
TABLE OF CONTENT
TABLES & FIGURES

Data Monetization Market 

Data monetization, a form of monetization, is the act of generating measurable economic benefits from available data sources. Typically these benefits accrue as revenue or expense savings, but may also include market share or corporate market value gains. Data monetization leverages data generated through business operations, available exogenous data or content, as well as data associated with individual actors such as that collected via electronic devices and sensors participating in the internet of things. For example, the ubiquity of the internet of things is generating location data and other data from sensors and mobile devices at an ever increasing rate. The data in this report is based on data analytics software fees and service fees for Data Monetization.

Due to the COVID-19 pandemic, the global Data Monetization market size is estimated to be worth US$ 1656.1 million in 2022 and is forecast to a readjusted size of US$ 26340 million by 2029 with a CAGR of 47.9% during the forecast period 2023-2029.

Fully considering the economic change by this health crisis, On-Premises accounting for % of the Data Monetization global market in 2022, is projected to value US$ million by 2029, growing at a revised % CAGR from 2023 to 2029.

Data Monetization Market

Scope of Global Data Monetization Market Report

Report Metric Details
Report Name Global Data Monetization Market
Base Year 2022
Forecasted years 2023-2029
By Company
  • Accenture
  • Viavi Solutions
  • Infosys
  • SAP
  • Adastra
  • Mahindra Comviva
  • Alepo
  • EMC
  • ALC
  • Redknee
  • SAS
  • Monetize Solutions
  • Reltio
  • IBM
Segment by Type
  • On-Premises
  • Cloud
Segment by Application
  • Telecom
  • Finance & Banking
  • E-Commerce & Retail
  • Network & Software
  • Manufacturing
Consumption by Region
  • North America (United States, Canada)
  • Europe (Germany, France, UK, Italy, Russia)
  • Asia-Pacific (China, Japan, South Korea, Taiwan)
  • Southeast Asia (India)
  • Latin America (Mexico, Brazil)
Forecast units USD million in value
Report coverage Revenue and volume forecast, company share, competitive landscape, growth factors and trends
1 Report Overview
1.1 Study Scope
1.2 Market Analysis by Type
1.2.1 Global Data Monetization Market Size by Type (2018 VS 2022 VS 2029)
1.2.2 On-Premises
1.2.3 Cloud
1.3 Market by Application
1.3.1 Global Data Monetization Market Share by Application (2018 VS 2022 VS 2029)
1.3.2 Telecom
1.3.3 Finance & Banking
1.3.4 E-Commerce & Retail
1.3.5 Network & Software
1.3.6 Manufacturing
1.3.7 Others
1.4 Study Objectives
1.5 Years Considered
2 Global Growth Trends
2.1 Global Data Monetization Market Perspective (2018-2029)
2.2 Global Data Monetization Market Size by Region: 2018 VS 2022 VS 2029
2.3 Global Data Monetization Revenue Market Share by Region (2018-2023)
2.4 Global Data Monetization Revenue Forecast by Region (2024-2029)
2.5 Geographic Market Analysis: Market Facts & Figures
2.5.1 United States Data Monetization Estimates and Projections (2018-2029)
2.5.2 Europe Data Monetization Estimates and Projections (2018-2029)
2.5.3 China Data Monetization Estimates and Projections (2018-2029)
2.5.4 Japan Data Monetization Estimates and Projections (2018-2029)
2.5.5 Southeast Asia Data Monetization Estimates and Projections (2018-2029)
2.5.6 India Data Monetization Estimates and Projections (2018-2029)
3 Global Data Monetization Competition Landscape by Players
3.1 Global Top Data Monetization Players by Revenue (2018-2023)
3.1.1 Global Top Data Monetization Players by Revenue (2018-2023)
3.1.2 Global Data Monetization Revenue Market Share by Players (2018-2023)
3.2 Global Data Monetization Market Share by Company Type (Tier 1, Tier 2 and Tier 3)
3.3 Players Covered: Ranking by Data Monetization Revenue
3.4 Global Data Monetization Market Concentration Ratio
3.4.1 Global Data Monetization Market Concentration Ratio (CR5 and HHI)
3.4.2 Global Top 10 and Top 5 Companies by Data Monetization Revenue in 2022
3.5 Data Monetization Key Players Head office and Area Served
3.6 Key Players Data Monetization Product Solution and Service
3.7 Date of Enter into Data Monetization Market
3.8 Mergers & Acquisitions, Expansion Plans
4 Data Monetization Breakdown Data by Type
4.1 Global Data Monetization Historic Market Size by Type (2018-2023)
4.2 Global Data Monetization Forecasted Market Size by Type (2024-2029)
5 Data Monetization Breakdown Data by Application
5.1 Global Data Monetization Historic Market Size by Application (2018-2023)
5.2 Global Data Monetization Forecasted Market Size by Application (2024-2029)
6 United States Data Monetization Market Facts & Figures
6.1 United States Data Monetization Revenue by Company (2018-2023)
6.2 United States Data Monetization Market Size by Type
6.2.1 United States Data Monetization Market Size by Type (2018-2023)
6.2.2 United States Data Monetization Market Size by Type (2024-2029)
6.2.3 United States Data Monetization Market Share by Type (2018-2029)
6.3 United States Data Monetization Market Size by Application
6.3.1 United States Data Monetization Market Size by Application (2018-2023)
6.3.2 United States Data Monetization Market Size by Application (2024-2029)
6.3.3 United States Data Monetization Market Share by Application (2018-2029)
7 Europe Data Monetization Market Facts & Figures
7.1 Europe Data Monetization Revenue by Company (2018-2023)
7.2 Europe Data Monetization Market Size by Type
7.2.1 Europe Data Monetization Market Size by Type (2018-2023)
7.2.2 Europe Data Monetization Market Size by Type (2024-2029)
7.2.3 Europe Data Monetization Market Share by Type (2018-2029)
7.3 Europe Data Monetization Market Size by Application
7.3.1 Europe Data Monetization Market Size by Application (2018-2023)
7.3.2 Europe Data Monetization Market Size by Application (2024-2029)
7.3.3 Europe Data Monetization Market Share by Application (2018-2029)
8 China Data Monetization Market Facts & Figures
8.1 China Data Monetization Revenue by Company (2018-2023)
8.2 China Data Monetization Market Size by Type
8.2.1 China Data Monetization Market Size by Type (2018-2023)
8.2.2 China Data Monetization Market Size by Type (2024-2029)
8.2.3 China Data Monetization Market Share by Type (2018-2029)
8.3 China Data Monetization Market Size by Application
8.3.1 China Data Monetization Market Size by Application (2018-2023)
8.3.2 China Data Monetization Market Size by Application (2024-2029)
8.3.3 China Data Monetization Market Share by Application (2018-2029)
9 Japan Data Monetization Market Facts & Figures
9.1 Japan Data Monetization Revenue by Company (2018-2023)
9.2 Japan Data Monetization Market Size by Type
9.2.1 Japan Data Monetization Market Size by Type (2018-2023)
9.2.2 Japan Data Monetization Market Size by Type (2024-2029)
9.2.3 Japan Data Monetization Market Share by Type (2018-2029)
9.3 Japan Data Monetization Market Size by Application
9.3.1 Japan Data Monetization Market Size by Application (2018-2023)
9.3.2 Japan Data Monetization Market Size by Application (2024-2029)
9.3.3 Japan Data Monetization Market Share by Application (2018-2029)
10 Southeast Asia Data Monetization Market Facts & Figures
10.1 Southeast Asia Data Monetization Revenue by Company (2018-2023)
10.2 Southeast Asia Data Monetization Market Size by Type
10.2.1 Southeast Asia Data Monetization Market Size by Type (2018-2023)
10.2.2 Southeast Asia Data Monetization Market Size by Type (2024-2029)
10.2.3 Southeast Asia Data Monetization Market Share by Type (2018-2029)
10.3 Southeast Asia Data Monetization Market Size by Application
10.3.1 Southeast Asia Data Monetization Market Size by Application (2018-2023)
10.3.2 Southeast Asia Data Monetization Market Size by Application (2024-2029)
10.3.3 Southeast Asia Data Monetization Market Share by Application (2018-2029)
11 India Data Monetization Market Facts & Figures
11.1 India Data Monetization Revenue by Company (2018-2023)
11.2 India Data Monetization Market Size by Type
11.2.1 India Data Monetization Market Size by Type (2018-2023)
11.2.2 India Data Monetization Market Size by Type (2024-2029)
11.2.3 India Data Monetization Market Share by Type (2018-2029)
11.3 India Data Monetization Market Size by Application
11.3.1 India Data Monetization Market Size by Application (2018-2023)
11.3.2 India Data Monetization Market Size by Application (2024-2029)
11.3.3 India Data Monetization Market Share by Application (2018-2029)
12 Key Players Profiles
12.1 Accenture
12.1.1 Accenture Company Details
12.1.2 Accenture Business Overview
12.1.3 Accenture Data Monetization Introduction
12.1.4 Accenture Revenue in Data Monetization Business (2018-2023)
12.1.5 Accenture Recent Development
12.2 Viavi Solutions
12.2.1 Viavi Solutions Company Details
12.2.2 Viavi Solutions Business Overview
12.2.3 Viavi Solutions Data Monetization Introduction
12.2.4 Viavi Solutions Revenue in Data Monetization Business (2018-2023)
12.2.5 Viavi Solutions Recent Development
12.3 Infosys
12.3.1 Infosys Company Details
12.3.2 Infosys Business Overview
12.3.3 Infosys Data Monetization Introduction
12.3.4 Infosys Revenue in Data Monetization Business (2018-2023)
12.3.5 Infosys Recent Development
12.4 SAP
12.4.1 SAP Company Details
12.4.2 SAP Business Overview
12.4.3 SAP Data Monetization Introduction
12.4.4 SAP Revenue in Data Monetization Business (2018-2023)
12.4.5 SAP Recent Development
12.5 Adastra
12.5.1 Adastra Company Details
12.5.2 Adastra Business Overview
12.5.3 Adastra Data Monetization Introduction
12.5.4 Adastra Revenue in Data Monetization Business (2018-2023)
12.5.5 Adastra Recent Development
12.6 Mahindra Comviva
12.6.1 Mahindra Comviva Company Details
12.6.2 Mahindra Comviva Business Overview
12.6.3 Mahindra Comviva Data Monetization Introduction
12.6.4 Mahindra Comviva Revenue in Data Monetization Business (2018-2023)
12.6.5 Mahindra Comviva Recent Development
12.7 Alepo
12.7.1 Alepo Company Details
12.7.2 Alepo Business Overview
12.7.3 Alepo Data Monetization Introduction
12.7.4 Alepo Revenue in Data Monetization Business (2018-2023)
12.7.5 Alepo Recent Development
12.8 EMC
12.8.1 EMC Company Details
12.8.2 EMC Business Overview
12.8.3 EMC Data Monetization Introduction
12.8.4 EMC Revenue in Data Monetization Business (2018-2023)
12.8.5 EMC Recent Development
12.9 ALC
12.9.1 ALC Company Details
12.9.2 ALC Business Overview
12.9.3 ALC Data Monetization Introduction
12.9.4 ALC Revenue in Data Monetization Business (2018-2023)
12.9.5 ALC Recent Development
12.10 Redknee
12.10.1 Redknee Company Details
12.10.2 Redknee Business Overview
12.10.3 Redknee Data Monetization Introduction
12.10.4 Redknee Revenue in Data Monetization Business (2018-2023)
12.10.5 Redknee Recent Development
12.11 SAS
12.11.1 SAS Company Details
12.11.2 SAS Business Overview
12.11.3 SAS Data Monetization Introduction
12.11.4 SAS Revenue in Data Monetization Business (2018-2023)
12.11.5 SAS Recent Development
12.12 Monetize Solutions
12.12.1 Monetize Solutions Company Details
12.12.2 Monetize Solutions Business Overview
12.12.3 Monetize Solutions Data Monetization Introduction
12.12.4 Monetize Solutions Revenue in Data Monetization Business (2018-2023)
12.12.5 Monetize Solutions Recent Development
12.13 Reltio
12.13.1 Reltio Company Details
12.13.2 Reltio Business Overview
12.13.3 Reltio Data Monetization Introduction
12.13.4 Reltio Revenue in Data Monetization Business (2018-2023)
12.13.5 Reltio Recent Development
12.14 IBM
12.14.1 IBM Company Details
12.14.2 IBM Business Overview
12.14.3 IBM Data Monetization Introduction
12.14.4 IBM Revenue in Data Monetization Business (2018-2023)
12.14.5 IBM Recent Development
12.15 Teradata
12.15.1 Teradata Company Details
12.15.2 Teradata Business Overview
12.15.3 Teradata Data Monetization Introduction
12.15.4 Teradata Revenue in Data Monetization Business (2018-2023)
12.15.5 Teradata Recent Development
12.16 CellOS Software
12.16.1 CellOS Software Company Details
12.16.2 CellOS Software Business Overview
12.16.3 CellOS Software Data Monetization Introduction
12.16.4 CellOS Software Revenue in Data Monetization Business (2018-2023)
12.16.5 CellOS Software Recent Development
12.17 Altruist India/Connectiva
12.17.1 Altruist India/Connectiva Company Details
12.17.2 Altruist India/Connectiva Business Overview
12.17.3 Altruist India/Connectiva Data Monetization Introduction
12.17.4 Altruist India/Connectiva Revenue in Data Monetization Business (2018-2023)
12.17.5 Altruist India/Connectiva Recent Development
12.18 Samsung ARTIK
12.18.1 Samsung ARTIK Company Details
12.18.2 Samsung ARTIK Business Overview
12.18.3 Samsung ARTIK Data Monetization Introduction
12.18.4 Samsung ARTIK Revenue in Data Monetization Business (2018-2023)
12.18.5 Samsung ARTIK Recent Development
12.19 1010DATA
12.19.1 1010DATA Company Details
12.19.2 1010DATA Business Overview
12.19.3 1010DATA Data Monetization Introduction
12.19.4 1010DATA Revenue in Data Monetization Business (2018-2023)
12.19.5 1010DATA Recent Development
12.20 Dawex Systems
12.20.1 Dawex Systems Company Details
12.20.2 Dawex Systems Business Overview
12.20.3 Dawex Systems Data Monetization Introduction
12.20.4 Dawex Systems Revenue in Data Monetization Business (2018-2023)
12.20.5 Dawex Systems Recent Development
13 Market Dynamics
13.1 Data Monetization Industry Trends
13.2 Data Monetization Market Drivers
13.3 Data Monetization Market Challenges
13.4 Data Monetization Market Restraints
14 Research Findings and Conclusion
15 Appendix
15.1 Research Methodology
15.1.1 Methodology/Research Approach
15.1.2 Data Source
15.2 Author List
15.3 Disclaimer
List of Tables
    Table 1. Global Data Monetization Market Size Growth Rate by Type (US$ Million): (2018 VS 2022 VS 2029)
    Table 2. Major Players of On-Premises
    Table 3. Major Players of Cloud
    Table 4. Global Data Monetization Market Size Growth by Application (2018 VS 2022 VS 2029)
    Table 5. Global Data Monetization Market Size (US$ Million) by Region: 2018 VS 2022 VS 2029
    Table 6. Global Data Monetization Revenue (US$ Million) Market Share by Region (2018-2023))
    Table 7. Global Data Monetization Revenue Share by Region (2018-2023)
    Table 8. Global Data Monetization Revenue (US$ Million) Forecast by Region (2024-2029)
    Table 9. Global Data Monetization Revenue Share Forecast by Region (2024-2029)
    Table 10. Global Data Monetization Revenue by Players (2018-2023) & (US$ Million)
    Table 11. Global Data Monetization Revenue Share by Players (2018-2023)
    Table 12. Global Data Monetization Players by Company Type (Tier 1, Tier 2 and Tier 3) (based on the Revenue in Data Monetization as of 2022)
    Table 13. Ranking of Global Top Data Monetization Companies by Revenue (US$ Million) in 2021
    Table 14. Global 5 Largest Players Market Share by Data Monetization Revenue (CR5 and HHI) & (2018-2023)
    Table 15. Key Players Headquarters and Area Served
    Table 16. Key Players Data Monetization Product Solution and Service
    Table 17. Date of Enter into Data Monetization Market
    Table 18. Mergers & Acquisitions, Expansion Plans
    Table 19. Global Data Monetization Market Size by Type (2018-2023) & (US$ Million)
    Table 20. Global Data Monetization Revenue Market Share by Type (2018-2023)
    Table 21. Global Data Monetization Forecasted Market Size by Type (2024-2029) & (US$ Million)
    Table 22. Global Data Monetization Revenue Market Share by Type (2024-2029)
    Table 23. Global Data Monetization Market Size by Application (2018-2023) & (US$ Million)
    Table 24. Global Data Monetization Revenue Market Share by Application (2018-2023)
    Table 25. Global Data Monetization Forecasted Market Size by Application (2024-2029) & (US$ Million)
    Table 26. Global Data Monetization Revenue Market Share by Application (2024-2029)
    Table 27. United States Data Monetization Revenue by Company (2018-2023) & (US$ Million)
    Table 28. United States Data Monetization Revenue Market Share by Company (2018-2023)
    Table 29. United States Data Monetization Market Size by Type (2018-2023) & (K Units)
    Table 30. United States Data Monetization Market Size by Type (2024-2029) & (K Units)
    Table 31. United States Data Monetization Market Size by Application (2018-2023) & (K Units)
    Table 32. United States Data Monetization Market Size by Application (2024-2029) & (K Units)
    Table 33. Europe Data Monetization Revenue by Company (2018-2023) & (US$ Million)
    Table 34. Europe Data Monetization Revenue Market Share by Company (2018-2023)
    Table 35. Europe Data Monetization Market Size by Type (2018-2023) & (US$ Million)
    Table 36. Europe Data Monetization Market Size by Type (2024-2029) & (US$ Million)
    Table 37. Europe Data Monetization Market Size by Application (2018-2023) & (US$ Million)
    Table 38. Europe Data Monetization Market Size by Application (2024-2029) & (US$ Million)
    Table 39. China Data Monetization Revenue by Company (2018-2023) & (US$ Million)
    Table 40. China Data Monetization Revenue Market Share by Company (2018-2023)
    Table 41. China Data Monetization Market Size by Type (2018-2023) & (US$ Million)
    Table 42. China Data Monetization Market Size by Type (2024-2029) & (US$ Million)
    Table 43. China Data Monetization Market Size by Application (2018-2023) & (US$ Million)
    Table 44. China Data Monetization Market Size by Application (2024-2029) & (US$ Million)
    Table 45. Japan Data Monetization Revenue by Company (2018-2023) & (US$ Million)
    Table 46. Japan Data Monetization Revenue Market Share by Company (2018-2023)
    Table 47. Japan Data Monetization Market Size by Type (2018-2023) & (US$ Million)
    Table 48. Japan Data Monetization Market Size by Type (2024-2029) & (US$ Million)
    Table 49. Japan Data Monetization Market Size by Application (2018-2023) & (US$ Million)
    Table 50. Japan Data Monetization Market Size by Application (2024-2029) & (US$ Million)
    Table 51. Southeast Asia Data Monetization Revenue by Company (2018-2023) & (US$ Million)
    Table 52. Southeast Asia Data Monetization Revenue Market Share by Company (2018-2023)
    Table 53. Southeast Asia Data Monetization Market Size by Type (2018-2023) & (US$ Million)
    Table 54. Southeast Asia Data Monetization Market Size by Type (2024-2029) & (US$ Million)
    Table 55. Southeast Asia Data Monetization Market Size by Application (2018-2023) & (US$ Million)
    Table 56. Southeast Asia Data Monetization Market Size by Application (2024-2029) & (US$ Million)
    Table 57. India Data Monetization Revenue by Company (2018-2023) & (US$ Million)
    Table 58. India Data Monetization Revenue Market Share by Company (2018-2023)
    Table 59. India Data Monetization Market Size by Type (2018-2023) & (US$ Million)
    Table 60. India Data Monetization Market Size by Type (2024-2029) & (US$ Million)
    Table 61. India Data Monetization Market Size by Application (2018-2023) & (US$ Million)
    Table 62. India Data Monetization Market Size by Application (2024-2029) & (US$ Million)
    Table 63. Accenture Company Details
    Table 64. Accenture Description and Business Overview
    Table 65. Accenture Data Monetization Product
    Table 66. Accenture Revenue in Data Monetization Business (2018-2023) & (US$ Million)
    Table 67. Accenture Recent Development
    Table 68. Viavi Solutions Company Details
    Table 69. Viavi Solutions Description and Business Overview
    Table 70. Viavi Solutions Data Monetization Product
    Table 71. Viavi Solutions Revenue in Data Monetization Business (2018-2023) & (US$ Million)
    Table 72. Viavi Solutions Recent Development
    Table 73. Infosys Company Details
    Table 74. Infosys Description and Business Overview
    Table 75. Infosys Data Monetization Product
    Table 76. Infosys Revenue in Data Monetization Business (2018-2023) & (US$ Million)
    Table 77. Infosys Recent Development
    Table 78. SAP Company Details
    Table 79. SAP Description and Business Overview
    Table 80. SAP Data Monetization Product
    Table 81. SAP Revenue in Data Monetization Business (2018-2023) & (US$ Million)
    Table 82. SAP Recent Development
    Table 83. Adastra Company Details
    Table 84. Adastra Description and Business Overview
    Table 85. Adastra Data Monetization Product
    Table 86. Adastra Revenue in Data Monetization Business (2018-2023) & (US$ Million)
    Table 87. Adastra Recent Development
    Table 88. Mahindra Comviva Company Details
    Table 89. Mahindra Comviva Description and Business Overview
    Table 90. Mahindra Comviva Data Monetization Product
    Table 91. Mahindra Comviva Revenue in Data Monetization Business (2018-2023) & (US$ Million)
    Table 92. Mahindra Comviva Recent Development
    Table 93. Alepo Company Details
    Table 94. Alepo Description and Business Overview
    Table 95. Alepo Data Monetization Product
    Table 96. Alepo Revenue in Data Monetization Business (2018-2023) & (US$ Million)
    Table 97. Alepo Recent Development
    Table 98. EMC Company Details
    Table 99. EMC Data Monetization Product
    Table 100. EMC Description and Business Overview
    Table 101. EMC Revenue in Data Monetization Business (2018-2023) & (US$ Million)
    Table 102. EMC Recent Development
    Table 103. ALC Company Details
    Table 104. ALC Data Monetization Product
    Table 105. ALC Description and Business Overview
    Table 106. ALC Revenue in Data Monetization Business (2018-2023) & (US$ Million)
    Table 107. ALC Recent Development
    Table 108. Redknee Company Details
    Table 109. Redknee Description and Business Overview
    Table 110. Redknee Data Monetization Product
    Table 111. Redknee Revenue in Data Monetization Business (2018-2023) & (US$ Million)
    Table 112. Redknee Recent Development
    Table 113. SAS Company Details
    Table 114. SAS Description and Business Overview
    Table 115. SAS Data Monetization Product
    Table 116. SAS Revenue in Data Monetization Business (2018-2023) & (US$ Million)
    Table 117. SAS Recent Development
    Table 118. Monetize Solutions Company Details
    Table 119. Monetize Solutions Description and Business Overview
    Table 120. Monetize Solutions Data Monetization Product
    Table 121. Monetize Solutions Revenue in Data Monetization Business (2018-2023) & (US$ Million)
    Table 122. Monetize Solutions Recent Development
    Table 123. Reltio Company Details
    Table 124. Reltio Description and Business Overview
    Table 125. Reltio Data Monetization Product
    Table 126. Reltio Revenue in Data Monetization Business (2018-2023) & (US$ Million)
    Table 127. Reltio Recent Development
    Table 128. IBM Company Details
    Table 129. IBM Description and Business Overview
    Table 130. IBM Data Monetization Product
    Table 131. IBM Revenue in Data Monetization Business (2018-2023) & (US$ Million)
    Table 132. IBM Recent Development
    Table 133. Teradata Company Details
    Table 134. Teradata Description and Business Overview
    Table 135. Teradata Data Monetization Product
    Table 136. Teradata Revenue in Data Monetization Business (2018-2023) & (US$ Million)
    Table 137. Teradata Recent Development
    Table 138. CellOS Software Company Details
    Table 139. CellOS Software Description and Business Overview
    Table 140. CellOS Software Data Monetization Product
    Table 141. CellOS Software Revenue in Data Monetization Business (2018-2023) & (US$ Million)
    Table 142. CellOS Software Recent Development
    Table 143. Altruist India/Connectiva Company Details
    Table 144. Altruist India/Connectiva Description and Business Overview
    Table 145. Altruist India/Connectiva Data Monetization Product
    Table 146. Altruist India/Connectiva Revenue in Data Monetization Business (2018-2023) & (US$ Million)
    Table 147. Altruist India/Connectiva Recent Development
    Table 148. Samsung ARTIK Company Details
    Table 149. Samsung ARTIK Description and Business Overview
    Table 150. Samsung ARTIK Data Monetization Product
    Table 151. Samsung ARTIK Revenue in Data Monetization Business (2018-2023) & (US$ Million)
    Table 152. Samsung ARTIK Recent Development
    Table 153. 1010DATA Company Details
    Table 154. 1010DATA Description and Business Overview
    Table 155. 1010DATA Data Monetization Product
    Table 156. 1010DATA Revenue in Data Monetization Business (2018-2023) & (US$ Million)
    Table 157. 1010DATA Recent Development
    Table 158. Dawex Systems Company Details
    Table 159. Dawex Systems Description and Business Overview
    Table 160. Dawex Systems Data Monetization Product
    Table 161. Dawex Systems Revenue in Data Monetization Business (2018-2023) & (US$ Million)
    Table 162. Dawex Systems Recent Development
    Table 163. Data Monetization Market Trends
    Table 164. Data Monetization Market Drivers
    Table 165. Data Monetization Market Challenges
    Table 166. Data Monetization Market Restraints
    Table 167. Research Programs/Design for This Report
    Table 168. Key Data Information from Secondary Sources
    Table 169. Key Data Information from Primary Sources
List of Figures
    Figure 1. Global Data Monetization Market Share by Type: 2022 VS 2029
    Figure 2. On-Premises Features
    Figure 3. Cloud Features
    Figure 4. Global Data Monetization Market Share by Application: 2022 VS 2029
    Figure 5. Telecom Case Studies
    Figure 6. Finance & Banking Case Studies
    Figure 7. E-Commerce & Retail Case Studies
    Figure 8. Network & Software Case Studies
    Figure 9. Manufacturing Case Studies
    Figure 10. Others Case Studies
    Figure 11. Data Monetization Report Years Considered
    Figure 12. Global Data Monetization Market Size (US$ Million), Year-over-Year: 2018-2029
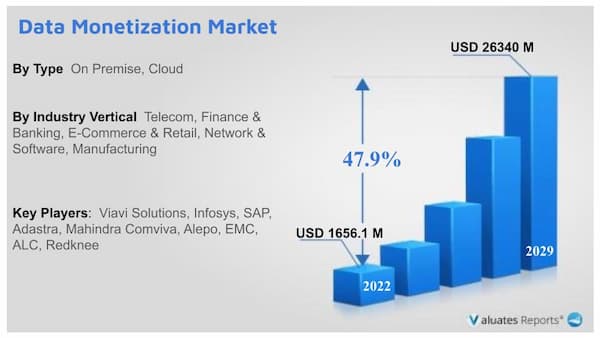
    Figure 13. Global Data Monetization Market Size, (US$ Million), 2018 VS 2022 VS 2029
    Figure 14. Global Data Monetization Revenue Market Share by Region: 2018 VS 2022
    Figure 15. United States Data Monetization Revenue (Million USD) Growth Rate (2018-2029)
    Figure 16. Europe Data Monetization Revenue (Million USD) Growth Rate (2018-2029)
    Figure 17. China Data Monetization Revenue (Million USD) Growth Rate (2018-2029)
    Figure 18. Japan Data Monetization Revenue (Million USD) Growth Rate (2018-2029)
    Figure 19. Southeast Asia Data Monetization Revenue (Million USD) Growth Rate (2018-2029)
    Figure 20. India Data Monetization Revenue (Million USD) Growth Rate (2018-2029)
    Figure 21. Global Data Monetization Market Share by Players in 2022
    Figure 22. Global Top Data Monetization Players by Company Type (Tier 1, Tier 2, and Tier 3) & (based on the Revenue in Data Monetization as of 2022)
    Figure 23. The Top 10 and 5 Players Market Share by Data Monetization Revenue in 2022
    Figure 24. United States Data Monetization Market Share by Type (2018-2029)
    Figure 25. United States Data Monetization Market Share by Application (2018-2029)
    Figure 26. Europe Data Monetization Market Share by Type (2018-2029)
    Figure 27. Europe Data Monetization Market Share by Application (2018-2029)
    Figure 28. China Data Monetization Market Share by Type (2018-2029)
    Figure 29. China Data Monetization Market Share by Application (2018-2029)
    Figure 30. Japan Data Monetization Market Share by Type (2018-2029)
    Figure 31. Japan Data Monetization Market Share by Application (2018-2029)
    Figure 32. Southeast Asia Data Monetization Market Share by Type (2018-2029)
    Figure 33. Southeast Asia Data Monetization Market Share by Application (2018-2029)
    Figure 34. India Data Monetization Market Share by Type (2018-2029)
    Figure 35. India Data Monetization Market Share by Application (2018-2029)
    Figure 36. Accenture Revenue Growth Rate in Data Monetization Business (2018-2023)
    Figure 37. Viavi Solutions Revenue Growth Rate in Data Monetization Business (2018-2023)
    Figure 38. Infosys Revenue Growth Rate in Data Monetization Business (2018-2023)
    Figure 39. SAP Revenue Growth Rate in Data Monetization Business (2018-2023)
    Figure 40. Adastra Revenue Growth Rate in Data Monetization Business (2018-2023)
    Figure 41. Mahindra Comviva Revenue Growth Rate in Data Monetization Business (2018-2023)
    Figure 42. Alepo Revenue Growth Rate in Data Monetization Business (2018-2023)
    Figure 43. EMC Revenue Growth Rate in Data Monetization Business (2018-2023)
    Figure 44. ALC Revenue Growth Rate in Data Monetization Business (2018-2023)
    Figure 45. Redknee Revenue Growth Rate in Data Monetization Business (2018-2023)
    Figure 46. SAS Revenue Growth Rate in Data Monetization Business (2018-2023)
    Figure 47. Monetize Solutions Revenue Growth Rate in Data Monetization Business (2018-2023)
    Figure 48. Reltio Revenue Growth Rate in Data Monetization Business (2018-2023)
    Figure 49. IBM Revenue Growth Rate in Data Monetization Business (2018-2023)
    Figure 50. Teradata Revenue Growth Rate in Data Monetization Business (2018-2023)
    Figure 51. CellOS Software Revenue Growth Rate in Data Monetization Business (2018-2023)
    Figure 52. Altruist India/Connectiva Revenue Growth Rate in Data Monetization Business (2018-2023)
    Figure 53. Samsung ARTIK Revenue Growth Rate in Data Monetization Business (2018-2023)
    Figure 54. 1010DATA Revenue Growth Rate in Data Monetization Business (2018-2023)
    Figure 55. Dawex Systems Revenue Growth Rate in Data Monetization Business (2018-2023)
    Figure 56. Bottom-up and Top-down Approaches for This Report
    Figure 57. Data Triangulation
    Figure 58. Key Executives Interviewed
SELECT A FORMAT
Added to Cart
Electronic (PDF)

$4000

This license allows only one user to access the PDF.
Electronic (PDF)

$6000

This license allows 1 - 5 user to access the PDF, license is suitable for small groups of 5 users working together
Electronic (PDF)

$8000

This license allows users/teams in a same Enterprise to use this report, various departments within an enterpise can use this report
Add to Cart
Buy Now (15% Discount)

OUR CUSTOMER

Strategic Venue Partners

SIMILAR REPORTS


RELATED REPORTS

Global Team Collaboration and Web Conferencing Market Research Report 2024

120 Pages
Type: Report
Code: QYRE-Auto-28P8232
Wed Apr 17 00:00:00 UTC 2024

Add to Cart

Global Datacenter Transformation System Implementation Services Market Research Report 2024

120 Pages
Type: Report
Code: QYRE-Auto-32D6052
Mon Apr 15 00:00:00 UTC 2024

Add to Cart

Global CRM Lead Management Market Research Report 2024

120 Pages
Type: Report
Code: QYRE-Auto-27F5910
Mon Apr 15 00:00:00 UTC 2024

Add to Cart

Global Credit Processing Solution Market Research Report 2024

120 Pages
Type: Report
Code: QYRE-Auto-5A6258
Mon Apr 15 00:00:00 UTC 2024

Add to Cart