FEATURED COMPANIES
Amcor Limited
WestRock Company
Sonoco Products Company
Sealed Air Corporation
Eco-Friendly Packaging Market Size
The global Eco-Friendly Packaging market was valued at US$ 269360 million in 2025 and is anticipated to reach US$ 369277 million by 2032, at a CAGR of 5.1% from 2026 to 2032.
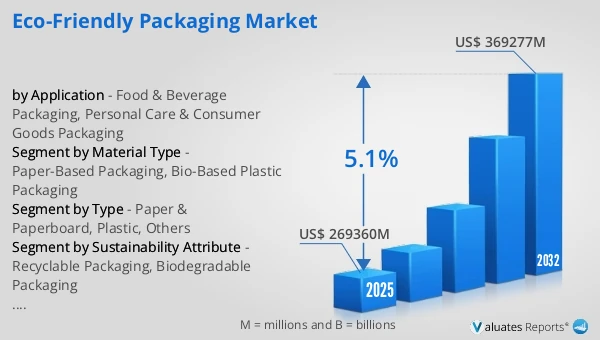
Eco-Friendly Packaging Market
The 2025 U.S. tariff policies introduce profound uncertainty into the global economic landscape. This report critically examines the implications of recent tariff adjustments and international strategic countermeasures on Eco-Friendly Packaging competitive dynamics, regional economic interdependencies, and supply chain reconfigurations.
In 2025, global eco-friendly packaging output reached approximately 182 million tons, with an average selling price of around USD 1480 per ton. Total production capacity was about 205 million tons, and the overall gross margin was approximately 28%.
Eco-friendly packaging refers to packaging solutions designed to minimize environmental impact across material selection, structure design, production, and end-of-life stages. It typically uses recyclable, renewable, or biodegradable materials—such as paper-based materials, bio-based plastics, and recyclable composites—to reduce resource consumption, carbon emissions, and waste while fulfilling protection, transportation, and display functions.
The global eco-friendly packaging market is driven by stricter regulations, brand sustainability commitments, and rising consumer environmental awareness, with demand concentrated in food and beverage, personal care, and e-commerce packaging. On the supply side, manufacturers are accelerating shifts toward mono-material designs, lightweighting, and higher recyclability, while balancing cost and performance remains a key challenge. Overall, the market is large in scale, grows steadily, and shows clear regional differences.
This report delivers a comprehensive overview of the global Eco-Friendly Packaging market, with both quantitative and qualitative analyses, to help readers develop growth strategies, assess the competitive landscape, evaluate their position in the current market, and make informed business decisions regarding Eco-Friendly Packaging. The Eco-Friendly Packaging market size, estimates, and forecasts are provided in terms of output/shipments (Kiloton) and revenue (US$ millions), with 2025 as the base year and historical and forecast data for 2021–2032.
The report segments the global Eco-Friendly Packaging market comprehensively. Regional market sizes by Type, by Application, by Material Type, and by company are also provided. For deeper insight, the report profiles the competitive landscape, key competitors, and their respective market rankings, and discusses technological trends and new product developments.
This report will assist Eco-Friendly Packaging manufacturers, new entrants, and companies across the industry value chain with information on revenues, production, and average prices for the overall market and its sub-segments, by company, by Type, by Application, and by region.
Market Segmentation
Scope of Eco-Friendly Packaging Market Report
| Report Metric |
Details |
| Report Name |
Eco-Friendly Packaging Market |
| Accounted market size in 2025 |
US$ 269360 million |
| Forecasted market size in 2032 |
US$ 369277 million |
| CAGR |
5.1% |
| Base Year |
2025 |
| Forecasted years |
2026 - 2032 |
| Segment by Type |
- Paper & Paperboard
- Plastic
- Others
|
| Segment by Material Type |
- Paper-Based Packaging
- Bio-Based Plastic Packaging
|
| Segment by Sustainability Attribute |
- Recyclable Packaging
- Biodegradable Packaging
|
| Segment by Packaging Format |
- Flexible Packaging
- Rigid Packaging
|
| by Application |
- Food & Beverage Packaging
- Personal Care & Consumer Goods Packaging
|
| Production by Region |
- North America
- Europe
- China
- Japan
|
| Consumption by Region |
- North America (United States, Canada)
- Europe (Germany, France, UK, Italy, Russia)
- Asia-Pacific (China, Japan, South Korea, Taiwan)
- Southeast Asia (India)
- Latin America (Mexico, Brazil)
|
| By Company |
Huhtamaki, DS Smith PLC, Ball Corporation, Tetra Pak, Printpack, Mondi Group, Sealed Air Corporation, WestRock Company, Sonoco Products Company, Pactiv Evergreen Inc, Berry Global Inc, Emerald Packaging, Amcor Limited, UFlex Limited, Nampak Ltd, PlastiPak Holdings Inc, Crown Holdings Incorporated, Ardagh Group SA, Smurfit Kappa, Elopak AS |
| Forecast units |
USD million in value |
| Report coverage |
Revenue and volume forecast, company share, competitive landscape, growth factors and trends |
Chapter Outline
- Chapter 1: Defines the scope of the report and presents an executive summary of market segments (by Type, by Application, by Material Type, etc.), including the size of each segment and its future growth potential. It offers a high-level view of the current market and its likely evolution in the short, medium, and long term.
- Chapter 2: Provides a detailed analysis of the competitive landscape for Eco-Friendly Packaging manufacturers, including prices, production, value-based market shares, latest development plans, and information on mergers and acquisitions.
- Chapter 3: Examines Eco-Friendly Packaging production/output and value by region and country, providing a quantitative assessment of market size and growth potential for each region over the next six years.
- Chapter 4: Analyzes Eco-Friendly Packaging consumption at the regional and country levels. It quantifies market size and growth potential for each region and its key countries, and outlines market development, outlook, addressable space, and national production.
- Chapter 5: Analyzes market segments by Type, covering the size and growth potential of each segment to help readers identify “blue ocean” opportunities.
- Chapter 6: Analyzes market segments by Application, covering the size and growth potential of each segment to help readers identify “blue ocean” opportunities in downstream markets.
- Chapter 7: Profiles key players, detailing the fundamentals of major companies, including product production/output, value, price, gross margin, product portfolio/introductions, and recent developments.
- Chapter 8: Reviews the industry value chain, including upstream and downstream segments.
- Chapter 9: Discusses market dynamics and recent developments, including drivers, restraints, challenges and risks for manufacturers, U.S. Tariffs and relevant policy analysis.
- Chapter 10: Summarizes the key findings and conclusions of the report.
FAQ for this report
How fast is Eco-Friendly Packaging Market growing?
Ans: The Eco-Friendly Packaging Market witnessing a CAGR of 5.1% during the forecast period 2026-2032.
What is the Eco-Friendly Packaging Market size in 2032?
Ans: The Eco-Friendly Packaging Market size in 2032 will be US$ 369277 million.
Who are the main players in the Eco-Friendly Packaging Market report?
Ans: The main players in the Eco-Friendly Packaging Market are Huhtamaki, DS Smith PLC, Ball Corporation, Tetra Pak, Printpack, Mondi Group, Sealed Air Corporation, WestRock Company, Sonoco Products Company, Pactiv Evergreen Inc, Berry Global Inc, Emerald Packaging, Amcor Limited, UFlex Limited, Nampak Ltd, PlastiPak Holdings Inc, Crown Holdings Incorporated, Ardagh Group SA, Smurfit Kappa, Elopak AS
What are the Application segmentation covered in the Eco-Friendly Packaging Market report?
Ans: The Applications covered in the Eco-Friendly Packaging Market report are Food & Beverage Packaging, Personal Care & Consumer Goods Packaging
What are the Type segmentation covered in the Eco-Friendly Packaging Market report?
Ans: The Types covered in the Eco-Friendly Packaging Market report are Paper-Based Packaging, Bio-Based Plastic Packaging

