0
U.S. (TOLL FREE)
+1 (315) 215-3225
Automative

0
U.S. (TOLL FREE)
+1 (315) 215-3225
Global and India Binoculars Market Report & Forecast 2023-2029
Published Date: 2023-11-22
|
Report Code: QYRE-Auto-39F15751
Home | Market Reports | Computers & Electronics| Consumer Electronics| Camera & Photo Equipment
Global and India Binoculars Market Report Forecast 2023 2029
BUY CHAPTERS

Global and India Binoculars Market Report & Forecast 2023-2029

Code: QYRE-Auto-39F15751
Report
2023-11-22
Pages:125
QYResearch
Buy Now with 15% Discount
DESCRIPTION
TABLE OF CONTENT
TABLES & FIGURES

and India Binoculars Market Size

The global Binoculars revenue was US$ 1014 million in 2022 and is forecast to a readjusted size of US$ 1174.8 million by 2029 with a CAGR of 2.1% during the forecast period (2023-2029).

and India Binoculars Market

and India Binoculars Market

Binoculars are a pair of identical or mirror-symmetrical telescopes mounted side-by-side and aligned to point accurately in the same direction, allowing the viewer to use both eyes (binocular vision) when viewing distant objects. Binoculars have countless practical applications for both hobbyists and professionals.
In India, the Binoculars revenue is expected to grow from US$ million in 2022 to US$ million by 2029, at a CAGR of % during the forecast period (2023-2029).
Global Binoculars key players include Canon, Leica, Zeiss, Bushnell, Swarovski Optik, etc. Global top five manufacturers hold a share about 35%. Asia-Pacific is the largest market, with a share about 40%, followed by Europe, with a share about 30 percent. In terms of product, Roof Prism Binoculars is the largest segment, with a share about 60%. And in terms of application, the largest application is Outdoor Series, followed by Marine Series, Hunting & Shooting Series, Tactical and Military Series, etc.
This report focuses on global and India Binoculars market, also covers the segmentation data of other regions in regional level and county level.
India is now the world’s most populous country. According to IMF (its July update to its World Economic Outlook), India’s GDP growth is projected at 6.1% in 2023, powered by domestic investment. First and foremost, the key factor in India's rapid economic growth is the huge supply and demand from a large population base. Demand and supply sides working in both directions to support India's economic stability.
India is a market full of opportunities, and the demand for Binoculars will continue to grow rapidly in the future.
Global Binoculars Scope and Market Size
Binoculars market is segmented in regional and country, by players, by type and by application. Companies, stakeholders, and other participants in the global Binoculars market will be able to gain the upper hand as they use the report as a powerful resource. The segmental analysis focuses on revenue and forecast by type and by application for the period 2018-2029.
For India market, this report focuses on the Binoculars market size by players, by Type and by Application, for the period 2018-2029. The key players include the global and local players, which play important roles in India.

Scope of and India Binoculars Market Report

Report Metric Details
Report Name and India Binoculars Market
Forecasted market size in 2029 US$ 1174.8 million
CAGR 2.1%
Forecasted years 2023 - 2029
Segment by Type
Segment by Application
  • Hunting & Shooting Series
  • Outdoor Series
  • Marine Series
  • Tactical and Military Series
  • Others
By Region
  • North America (United States, Canada)
  • Europe (Germany, France, UK, Italy, Russia) Rest of Europe
  • Nordic Countries
  • Asia-Pacific (China, Japan, South Korea)
  • Southeast Asia (India, Australia)
  • Rest of Asia
  • Latin America (Mexico, Brazil)
  • Rest of Latin America
  • Middle East & Africa (Turkey, Saudi Arabia, UAE, Rest of MEA)
By Company Leica, Canon, Zeiss, Bushnell, Swarovski Optik, Kowa, Nikon, Guangzhou Jinghua Precision Optics Co., Ltd, Pulsar, Steiner, Fujifilm, Olympus, Ricoh, Meopta, Leupold, Yunnan Yuanjin Optical Instruments, Bosma, Celestron, Levenhuk, Vixen, Lunt Engineering
Forecast units USD million in value
Report coverage Revenue and volume forecast, company share, competitive landscape, growth factors and trends

FAQ for this report

What is the and India Binoculars Market size in 2029?

Ans: The and India Binoculars Market size in 2029 will be US$ 1174.8 million.

What is the market share of major companies in and India Binoculars Market?

Ans: Global top five manufacturers hold a share about 35%.

What is the and India Binoculars Market share by type?

Ans: In terms of product, Roof Prism Binoculars is the largest segment, with a share about 60%.

What is the and India Binoculars Market share by region?

Ans: According to IMF (its July update to its World Economic Outlook), India’s GDP growth is projected at 6.1% in 2023, powered by domestic investment.

Who are the main players in the and India Binoculars Market report?

Ans: The main players in the and India Binoculars Market are Leica, Canon, Zeiss, Bushnell, Swarovski Optik, Kowa, Nikon, Guangzhou Jinghua Precision Optics Co., Ltd, Pulsar, Steiner, Fujifilm, Olympus, Ricoh, Meopta, Leupold, Yunnan Yuanjin Optical Instruments, Bosma, Celestron, Levenhuk, Vixen, Lunt Engineering

What are the Application segmentation covered in the and India Binoculars Market report?

Ans: The Applications covered in the and India Binoculars Market report are Hunting & Shooting Series, Outdoor Series, Marine Series, Tactical and Military Series, Others

What are the Type segmentation covered in the and India Binoculars Market report?

Ans: The Types covered in the and India Binoculars Market report are Roof Prism Binoculars, Porro Prism Binoculars

Recommended Reports

Binoculars & Accessories

Night Vision & Thermal

Binoculars Optics & Prisms

1 Study Coverage
1.1 Binoculars Product Introduction
1.2 Global Binoculars Outlook 2018 VS 2022 VS 2029
1.2.1 Global Binoculars Sales in US$ Million for the Year 2018-2029
1.2.2 Global Binoculars Sales in Volume for the Year 2018-2029
1.3 India Binoculars Outlook 2018 VS 2022 VS 2029
1.3.1 India Binoculars Sales in US$ Million for the Year 2018-2029
1.3.2 India Binoculars Sales in Volume for the Year 2018-2029
1.4 Binoculars Market Size, India VS Global, 2018 VS 2022 VS 2029
1.4.1 The Market Share of India Binoculars in Global, 2018 VS 2022 VS 2029
1.4.2 The Growth Rate of Binoculars Market Size, India VS Global, 2018 VS 2022 VS 2029
1.5 Binoculars Market Dynamics
1.5.1 Binoculars Industry Trends
1.5.2 Binoculars Market Drivers
1.5.3 Binoculars Market Challenges
1.5.4 Binoculars Market Restraints
1.6 Study Objectives
1.7 Years Considered
1.8 Years Considered
2 Binoculars by Type
2.1 Binoculars Market Segment by Type
2.1.1 Roof Prism Binoculars
2.1.2 Porro Prism Binoculars
2.2 Global Binoculars Market Size by Type
2.2.1 Global Binoculars Sales in Value, by Type (2018, 2022 & 2029)
2.2.2 Global Binoculars Sales in Volume, by Type (2018, 2022 & 2029)
2.2.3 Global Binoculars Average Selling Price (ASP) by Type (2018, 2022 & 2029)
2.3 India Binoculars Market Size by Type
2.3.1 India Binoculars Sales in Value, by Type (2018, 2022 & 2029)
2.3.2 India Binoculars Sales in Volume, by Type (2018, 2022 & 2029)
2.3.3 India Binoculars Average Selling Price (ASP) by Type (2018, 2022 & 2029)
3 Binoculars by Application
3.1 Binoculars Market Segment by Application
3.1.1 Hunting & Shooting Series
3.1.2 Outdoor Series
3.1.3 Marine Series
3.1.4 Tactical and Military Series
3.1.5 Others
3.2 Global Binoculars Market Size by Application
3.2.1 Global Binoculars Sales in Value, by Application (2018, 2022 & 2029)
3.2.2 Global Binoculars Sales in Volume, by Application (2018, 2022 & 2029)
3.3.3 Global Binoculars Average Selling Price (ASP) by Application (2018, 2022 & 2029)
3.3 India Binoculars Market Size by Application
3.3.1 India Binoculars Sales in Value, by Application (2018, 2022 & 2029)
3.3.2 India Binoculars Sales in Volume, by Application (2018, 2022 & 2029)
3.3.3 India Binoculars Average Selling Price (ASP) by Application (2018, 2022 & 2029)
4 Global Binoculars Competitor Landscape by Company
4.1 Global Binoculars Market Size by Company
4.1.1 Global Key Manufacturers of Binoculars, Ranked by Revenue (2022)
4.1.2 Global Binoculars Revenue by Manufacturer (2018-2023)
4.1.3 Global Binoculars Sales by Manufacturer (2018-2023)
4.1.4 Global Binoculars Price by Manufacturer (2018-2023)
4.2 Global Binoculars Concentration Ratio (CR)
4.2.1 Binoculars Market Concentration Ratio (CR)
4.2.2 Global Top 5 and Top 10 Largest Manufacturers of Binoculars in 2022
4.2.3 Global Binoculars Market Share by Company Type (Tier 1, Tier 2, and Tier 3)
4.3 Global Key Manufacturers of Binoculars, Manufacturing Base Distribution and Headquarters
4.4 Global Key Manufacturers of Binoculars, Product Offered and Application
4.5 Global Key Manufacturers of Binoculars, Date of Enter into This Industry
4.6 Manufacturers Mergers & Acquisitions, Expansion Plans
4.7 India Binoculars Market Size by Company
4.7.1 Key Players of Binoculars in India, Ranked by Revenue (2022)
4.7.2 India Binoculars Revenue by Players (2018-2023)
4.7.3 India Binoculars Sales by Players (2018-2023)
5 Global Binoculars Market Size by Region
5.1 Global Binoculars Market Size by Region: 2018 VS 2022 VS 2029
5.2 Global Binoculars Market Size in Volume by Region (2018-2029)
5.2.1 Global Binoculars Sales in Volume by Region: 2018-2023
5.2.2 Global Binoculars Sales in Volume Forecast by Region (2024-2029)
5.3 Global Binoculars Market Size in Value by Region (2018-2029)
5.3.1 Global Binoculars Sales in Value by Region: 2018-2023
5.3.2 Global Binoculars Sales in Value by Region: 2024-2029
6 Americas
6.1 Americas Binoculars Market Size YoY Growth 2018-2029
6.2 Americas Binoculars Sales in Volume, by Type (2018, 2022 & 2029)
6.3 Americas Binoculars Sales in Volume, by Application (2018, 2022 & 2029)
6.4 Americas Binoculars Market Facts & Figures by Country (2018, 2022 & 2029)
6.4.1 Americas Binoculars Sales in Value by Country (2018, 2022 & 2029)
6.4.2 Americas Binoculars Sales in Volume by Country (2018, 2022 & 2029)
6.4.3 United States
6.4.4 Canada
6.4.5 Mexico
6.4.6 Brazil
7 EMEA
7.1 EMEA Binoculars Market Size YoY Growth 2018-2029
7.2 EMEA Binoculars Sales in Volume, by Type (2018, 2022 & 2029)
7.3 EMEA Binoculars Sales in Volume, by Application (2018, 2022 & 2029)
7.4 EMEA Binoculars Market Facts & Figures by Country (2018, 2022 & 2029)
7.4.1 EMEA Binoculars Sales in Value by Country (2018, 2022 & 2029)
7.4.2 EMEA Binoculars Sales in Volume by Country (2018, 2022 & 2029)
7.4.3 Europe
7.4.4 Middle East
7.4.5 Africa
8 China
8.1 China Binoculars Market Size YoY Growth 2018-2029
8.2 China Binoculars Sales in Volume, by Type (2018, 2022 & 2029)
8.3 China Binoculars Sales in Volume, by Application (2018, 2022 & 2029)
9 APAC
9.1 APAC Binoculars Market Size YoY Growth 2018-2029
9.2 APAC Binoculars Sales in Volume, by Type (2018, 2022 & 2029)
9.3 APAC Binoculars Sales in Volume, by Application (2018, 2022 & 2029)
9.4 APAC Binoculars Market Facts & Figures by Region (2018, 2022 & 2029)
9.4.1 APAC Binoculars Sales in Value by Region (2018, 2022 & 2029)
9.4.2 APAC Binoculars Sales in Volume by Region (2018, 2022 & 2029)
9.4.3 Japan
9.4.4 South Korea
9.4.5 China Taiwan
9.4.6 Southeast Asia
9.4.7 India
10 Company Profiles
10.1 Leica
10.1.1 Leica Company Information
10.1.2 Leica Description and Business Overview
10.1.3 Leica Binoculars Sales, Revenue and Gross Margin (2018-2023)
10.1.4 Leica Binoculars Products Offered
10.1.5 Leica Recent Development
10.2 Canon
10.2.1 Canon Company Information
10.2.2 Canon Description and Business Overview
10.2.3 Canon Binoculars Sales, Revenue and Gross Margin (2018-2023)
10.2.4 Canon Binoculars Products Offered
10.2.5 Canon Recent Development
10.3 Zeiss
10.3.1 Zeiss Company Information
10.3.2 Zeiss Description and Business Overview
10.3.3 Zeiss Binoculars Sales, Revenue and Gross Margin (2018-2023)
10.3.4 Zeiss Binoculars Products Offered
10.3.5 Zeiss Recent Development
10.4 Bushnell
10.4.1 Bushnell Company Information
10.4.2 Bushnell Description and Business Overview
10.4.3 Bushnell Binoculars Sales, Revenue and Gross Margin (2018-2023)
10.4.4 Bushnell Binoculars Products Offered
10.4.5 Bushnell Recent Development
10.5 Swarovski Optik
10.5.1 Swarovski Optik Company Information
10.5.2 Swarovski Optik Description and Business Overview
10.5.3 Swarovski Optik Binoculars Sales, Revenue and Gross Margin (2018-2023)
10.5.4 Swarovski Optik Binoculars Products Offered
10.5.5 Swarovski Optik Recent Development
10.6 Kowa
10.6.1 Kowa Company Information
10.6.2 Kowa Description and Business Overview
10.6.3 Kowa Binoculars Sales, Revenue and Gross Margin (2018-2023)
10.6.4 Kowa Binoculars Products Offered
10.6.5 Kowa Recent Development
10.7 Nikon
10.7.1 Nikon Company Information
10.7.2 Nikon Description and Business Overview
10.7.3 Nikon Binoculars Sales, Revenue and Gross Margin (2018-2023)
10.7.4 Nikon Binoculars Products Offered
10.7.5 Nikon Recent Development
10.8 Guangzhou Jinghua Precision Optics Co., Ltd
10.8.1 Guangzhou Jinghua Precision Optics Co., Ltd Company Information
10.8.2 Guangzhou Jinghua Precision Optics Co., Ltd Description and Business Overview
10.8.3 Guangzhou Jinghua Precision Optics Co., Ltd Binoculars Sales, Revenue and Gross Margin (2018-2023)
10.8.4 Guangzhou Jinghua Precision Optics Co., Ltd Binoculars Products Offered
10.8.5 Guangzhou Jinghua Precision Optics Co., Ltd Recent Development
10.9 Pulsar
10.9.1 Pulsar Company Information
10.9.2 Pulsar Description and Business Overview
10.9.3 Pulsar Binoculars Sales, Revenue and Gross Margin (2018-2023)
10.9.4 Pulsar Binoculars Products Offered
10.9.5 Pulsar Recent Development
10.10 Steiner
10.10.1 Steiner Company Information
10.10.2 Steiner Description and Business Overview
10.10.3 Steiner Binoculars Sales, Revenue and Gross Margin (2018-2023)
10.10.4 Steiner Binoculars Products Offered
10.10.5 Steiner Recent Development
10.11 Fujifilm
10.11.1 Fujifilm Company Information
10.11.2 Fujifilm Description and Business Overview
10.11.3 Fujifilm Binoculars Sales, Revenue and Gross Margin (2018-2023)
10.11.4 Fujifilm Binoculars Products Offered
10.11.5 Fujifilm Recent Development
10.12 Olympus
10.12.1 Olympus Company Information
10.12.2 Olympus Description and Business Overview
10.12.3 Olympus Binoculars Sales, Revenue and Gross Margin (2018-2023)
10.12.4 Olympus Binoculars Products Offered
10.12.5 Olympus Recent Development
10.13 Ricoh
10.13.1 Ricoh Company Information
10.13.2 Ricoh Description and Business Overview
10.13.3 Ricoh Binoculars Sales, Revenue and Gross Margin (2018-2023)
10.13.4 Ricoh Binoculars Products Offered
10.13.5 Ricoh Recent Development
10.14 Meopta
10.14.1 Meopta Company Information
10.14.2 Meopta Description and Business Overview
10.14.3 Meopta Binoculars Sales, Revenue and Gross Margin (2018-2023)
10.14.4 Meopta Binoculars Products Offered
10.14.5 Meopta Recent Development
10.15 Leupold
10.15.1 Leupold Company Information
10.15.2 Leupold Description and Business Overview
10.15.3 Leupold Binoculars Sales, Revenue and Gross Margin (2018-2023)
10.15.4 Leupold Binoculars Products Offered
10.15.5 Leupold Recent Development
10.16 Yunnan Yuanjin Optical Instruments
10.16.1 Yunnan Yuanjin Optical Instruments Company Information
10.16.2 Yunnan Yuanjin Optical Instruments Description and Business Overview
10.16.3 Yunnan Yuanjin Optical Instruments Binoculars Sales, Revenue and Gross Margin (2018-2023)
10.16.4 Yunnan Yuanjin Optical Instruments Binoculars Products Offered
10.16.5 Yunnan Yuanjin Optical Instruments Recent Development
10.17 Bosma
10.17.1 Bosma Company Information
10.17.2 Bosma Description and Business Overview
10.17.3 Bosma Binoculars Sales, Revenue and Gross Margin (2018-2023)
10.17.4 Bosma Binoculars Products Offered
10.17.5 Bosma Recent Development
10.18 Celestron
10.18.1 Celestron Company Information
10.18.2 Celestron Description and Business Overview
10.18.3 Celestron Binoculars Sales, Revenue and Gross Margin (2018-2023)
10.18.4 Celestron Binoculars Products Offered
10.18.5 Celestron Recent Development
10.19 Levenhuk
10.19.1 Levenhuk Company Information
10.19.2 Levenhuk Description and Business Overview
10.19.3 Levenhuk Binoculars Sales, Revenue and Gross Margin (2018-2023)
10.19.4 Levenhuk Binoculars Products Offered
10.19.5 Levenhuk Recent Development
10.20 Vixen
10.20.1 Vixen Company Information
10.20.2 Vixen Description and Business Overview
10.20.3 Vixen Binoculars Sales, Revenue and Gross Margin (2018-2023)
10.20.4 Vixen Binoculars Products Offered
10.20.5 Vixen Recent Development
10.21 Lunt Engineering
10.21.1 Lunt Engineering Company Information
10.21.2 Lunt Engineering Description and Business Overview
10.21.3 Lunt Engineering Binoculars Sales, Revenue and Gross Margin (2018-2023)
10.21.4 Lunt Engineering Binoculars Products Offered
10.21.5 Lunt Engineering Recent Development
11 Industry Chain and Sales Channels Analysis
11.1 Binoculars Industry Chain Analysis
11.2 Binoculars Key Raw Materials
11.2.1 Key Raw Materials
11.2.2 Raw Materials Key Suppliers
11.3 Binoculars Production Mode & Process
11.4 Binoculars Sales and Marketing
11.4.1 Binoculars Sales Channels
11.4.2 Binoculars Distributors
11.5 Binoculars Customers
12 Research Findings and Conclusion
13 Appendix
13.1 Research Methodology
13.1.1 Methodology/Research Approach
13.1.2 Data Source
13.2 Author Details
13.3 Disclaimer
List of Tables
    Table 1. Binoculars CAGR in Value, India VS Global, 2018 VS 2022 VS 2029
    Table 2. Binoculars Market Trends
    Table 3. Binoculars Market Drivers
    Table 4. Binoculars Market Challenges
    Table 5. Binoculars Market Restraints
    Table 6. Global Binoculars Sales Growth Rate (CAGR) by Type: 2018 VS 2022 VS 2029 (US$ Million)
    Table 7. India Binoculars Sales Growth Rate (CAGR) by Type: 2018 VS 2022 VS 2029 (US$ Million)
    Table 8. Global Binoculars Sales Growth Rate (CAGR) by Application: 2018 VS 2022 VS 2029 (US$ Million)
    Table 9. India Binoculars Sales Growth Rate (CAGR) by Application: 2018 VS 2022 VS 2029 (US$ Million)
    Table 10. Global Key Manufacturers of Binoculars, Ranked by Revenue (2022) & (US$ Million)
    Table 11. Global Binoculars Revenue by Manufacturer, (US$ Million), 2018-2023
    Table 12. Global Binoculars Revenue Share by Manufacturer, 2018-2023
    Table 13. Global Binoculars Sales by Manufacturer, (K Units), 2018-2023
    Table 14. Global Binoculars Sales Share by Manufacturer, 2018-2023
    Table 15. Global Binoculars Price by Manufacturer (2018-2023) & (USD/Unit)
    Table 16. Global Binoculars Manufacturers Market Concentration Ratio (CR5 and HHI)
    Table 17. Global Binoculars by Company Type (Tier 1, Tier 2, and Tier 3) & (based on the Revenue in Binoculars as of 2022)
    Table 18. Global Key Manufacturers of Binoculars, Manufacturing Base Distribution and Headquarters
    Table 19. Global Key Manufacturers of Binoculars, Product Offered and Application
    Table 20. Global Key Manufacturers of Binoculars, Date of Enter into This Industry
    Table 21. Manufacturers Mergers & Acquisitions, Expansion Plans
    Table 22. Key Players of Binoculars in India, Ranked by Revenue (2022) & (US$ million)
    Table 23. India Binoculars Revenue by Players, (US$ Million), (2018-2023)
    Table 24. India Binoculars Revenue Share by Players, (2018-2023)
    Table 25. India Binoculars Sales by Players, (K Units), (2018-2023)
    Table 26. India Binoculars Sales Share by Players, (2018-2023)
    Table 27. Global Binoculars Market Size Growth Rate (CAGR) by Region (US$ Million): 2018 VS 2022 VS 2029
    Table 28. Global Binoculars Sales in Volume by Region (2018-2023) & (K Units)
    Table 29. Global Binoculars Sales in Volume Forecast by Region (2024-2029) & (K Units)
    Table 30. Global Binoculars Sales in Value by Region (2018-2023) & (US$ Million)
    Table 31. Global Binoculars Sales in Value Forecast by Region (2024-2029) & (US$ Million)
    Table 32. Americas Binoculars Market Size Growth Rate (CAGR) by Country (US$ Million): 2018 VS 2022 VS 2029
    Table 33. Americas Binoculars Sales in Value by Country (2018-2023) & (US$ Million)
    Table 34. Americas Binoculars Sales in Value by Country (2024-2029) & (US$ Million)
    Table 35. Americas Binoculars Sales in Volume by Country (2018-2023) & (K Units)
    Table 36. Americas Binoculars Sales in Volume by Country (2024-2029) & (K Units)
    Table 37. EMEA Binoculars Market Size Growth Rate (CAGR) by Country (US$ Million): 2018 VS 2022 VS 2029
    Table 38. EMEA Binoculars Sales in Value by Country (2018-2023) & (US$ Million)
    Table 39. EMEA Binoculars Sales in Value by Country (2024-2029) & (US$ Million)
    Table 40. EMEA Binoculars Sales in Volume by Country (2018-2023) & (K Units)
    Table 41. EMEA Binoculars Sales in Volume by Country (2024-2029) & (K Units)
    Table 42. APAC Binoculars Market Size Growth Rate (CAGR) by Country (US$ Million): 2018 VS 2022 VS 2029
    Table 43. APAC Binoculars Sales in Value by Country (2018-2023) & (US$ Million)
    Table 44. APAC Binoculars Sales in Value by Country (2024-2029) & (US$ Million)
    Table 45. APAC Binoculars Sales in Volume by Country (2018-2023) & (K Units)
    Table 46. APAC Binoculars Sales in Volume by Country (2024-2029) & (K Units)
    Table 47. Leica Company Information
    Table 48. Leica Description and Business Overview
    Table 49. Leica Binoculars Sales (K Units), Revenue (US$ Million), Price (USD/Unit) and Gross Margin (2018-2023)
    Table 50. Leica Binoculars Product
    Table 51. Leica Recent Development
    Table 52. Canon Company Information
    Table 53. Canon Description and Business Overview
    Table 54. Canon Binoculars Sales (K Units), Revenue (US$ Million), Price (USD/Unit) and Gross Margin (2018-2023)
    Table 55. Canon Binoculars Product
    Table 56. Canon Recent Development
    Table 57. Zeiss Company Information
    Table 58. Zeiss Description and Business Overview
    Table 59. Zeiss Binoculars Sales (K Units), Revenue (US$ Million), Price (USD/Unit) and Gross Margin (2018-2023)
    Table 60. Zeiss Binoculars Product
    Table 61. Zeiss Recent Development
    Table 62. Bushnell Company Information
    Table 63. Bushnell Description and Business Overview
    Table 64. Bushnell Binoculars Sales (K Units), Revenue (US$ Million), Price (USD/Unit) and Gross Margin (2018-2023)
    Table 65. Bushnell Binoculars Product
    Table 66. Bushnell Recent Development
    Table 67. Swarovski Optik Company Information
    Table 68. Swarovski Optik Description and Business Overview
    Table 69. Swarovski Optik Binoculars Sales (K Units), Revenue (US$ Million), Price (USD/Unit) and Gross Margin (2018-2023)
    Table 70. Swarovski Optik Binoculars Product
    Table 71. Swarovski Optik Recent Development
    Table 72. Kowa Company Information
    Table 73. Kowa Description and Business Overview
    Table 74. Kowa Binoculars Sales (K Units), Revenue (US$ Million), Price (USD/Unit) and Gross Margin (2018-2023)
    Table 75. Kowa Binoculars Product
    Table 76. Kowa Recent Development
    Table 77. Nikon Company Information
    Table 78. Nikon Description and Business Overview
    Table 79. Nikon Binoculars Sales (K Units), Revenue (US$ Million), Price (USD/Unit) and Gross Margin (2018-2023)
    Table 80. Nikon Binoculars Product
    Table 81. Nikon Recent Development
    Table 82. Guangzhou Jinghua Precision Optics Co., Ltd Company Information
    Table 83. Guangzhou Jinghua Precision Optics Co., Ltd Description and Business Overview
    Table 84. Guangzhou Jinghua Precision Optics Co., Ltd Binoculars Sales (K Units), Revenue (US$ Million), Price (USD/Unit) and Gross Margin (2018-2023)
    Table 85. Guangzhou Jinghua Precision Optics Co., Ltd Binoculars Product
    Table 86. Guangzhou Jinghua Precision Optics Co., Ltd Recent Development
    Table 87. Pulsar Company Information
    Table 88. Pulsar Description and Business Overview
    Table 89. Pulsar Binoculars Sales (K Units), Revenue (US$ Million), Price (USD/Unit) and Gross Margin (2018-2023)
    Table 90. Pulsar Binoculars Product
    Table 91. Pulsar Recent Development
    Table 92. Steiner Company Information
    Table 93. Steiner Description and Business Overview
    Table 94. Steiner Binoculars Sales (K Units), Revenue (US$ Million), Price (USD/Unit) and Gross Margin (2018-2023)
    Table 95. Steiner Binoculars Product
    Table 96. Steiner Recent Development
    Table 97. Fujifilm Company Information
    Table 98. Fujifilm Description and Business Overview
    Table 99. Fujifilm Binoculars Sales (K Units), Revenue (US$ Million), Price (USD/Unit) and Gross Margin (2018-2023)
    Table 100. Fujifilm Binoculars Product
    Table 101. Fujifilm Recent Development
    Table 102. Olympus Company Information
    Table 103. Olympus Description and Business Overview
    Table 104. Olympus Binoculars Sales (K Units), Revenue (US$ Million), Price (USD/Unit) and Gross Margin (2018-2023)
    Table 105. Olympus Binoculars Product
    Table 106. Olympus Recent Development
    Table 107. Ricoh Company Information
    Table 108. Ricoh Description and Business Overview
    Table 109. Ricoh Binoculars Sales (K Units), Revenue (US$ Million), Price (USD/Unit) and Gross Margin (2018-2023)
    Table 110. Ricoh Binoculars Product
    Table 111. Ricoh Recent Development
    Table 112. Meopta Company Information
    Table 113. Meopta Description and Business Overview
    Table 114. Meopta Binoculars Sales (K Units), Revenue (US$ Million), Price (USD/Unit) and Gross Margin (2018-2023)
    Table 115. Meopta Binoculars Product
    Table 116. Meopta Recent Development
    Table 117. Leupold Company Information
    Table 118. Leupold Description and Business Overview
    Table 119. Leupold Binoculars Sales (K Units), Revenue (US$ Million), Price (USD/Unit) and Gross Margin (2018-2023)
    Table 120. Leupold Binoculars Product
    Table 121. Leupold Recent Development
    Table 122. Yunnan Yuanjin Optical Instruments Company Information
    Table 123. Yunnan Yuanjin Optical Instruments Description and Business Overview
    Table 124. Yunnan Yuanjin Optical Instruments Binoculars Sales (K Units), Revenue (US$ Million), Price (USD/Unit) and Gross Margin (2018-2023)
    Table 125. Yunnan Yuanjin Optical Instruments Binoculars Product
    Table 126. Yunnan Yuanjin Optical Instruments Recent Development
    Table 127. Bosma Company Information
    Table 128. Bosma Description and Business Overview
    Table 129. Bosma Binoculars Sales (K Units), Revenue (US$ Million), Price (USD/Unit) and Gross Margin (2018-2023)
    Table 130. Bosma Binoculars Product
    Table 131. Bosma Recent Development
    Table 132. Celestron Company Information
    Table 133. Celestron Description and Business Overview
    Table 134. Celestron Binoculars Sales (K Units), Revenue (US$ Million), Price (USD/Unit) and Gross Margin (2018-2023)
    Table 135. Celestron Binoculars Product
    Table 136. Celestron Recent Development
    Table 137. Levenhuk Company Information
    Table 138. Levenhuk Description and Business Overview
    Table 139. Levenhuk Binoculars Sales (K Units), Revenue (US$ Million), Price (USD/Unit) and Gross Margin (2018-2023)
    Table 140. Levenhuk Binoculars Product
    Table 141. Levenhuk Recent Development
    Table 142. Vixen Company Information
    Table 143. Vixen Description and Business Overview
    Table 144. Vixen Binoculars Sales (K Units), Revenue (US$ Million), Price (USD/Unit) and Gross Margin (2018-2023)
    Table 145. Vixen Binoculars Product
    Table 146. Vixen Recent Development
    Table 147. Lunt Engineering Company Information
    Table 148. Lunt Engineering Description and Business Overview
    Table 149. Lunt Engineering Binoculars Sales (K Units), Revenue (US$ Million), Price (USD/Unit) and Gross Margin (2018-2023)
    Table 150. Lunt Engineering Binoculars Product
    Table 151. Lunt Engineering Recent Development
    Table 152. Key Raw Materials Lists
    Table 153. Raw Materials Key Suppliers Lists
    Table 154. Binoculars Customers List
    Table 155. Binoculars Distributors List
    Table 156. Research Programs/Design for This Report
    Table 157. Key Data Information from Secondary Sources
    Table 158. Key Data Information from Primary Sources
List of Figures
    Figure 1. Binoculars Product Picture
    Figure 2. Global Binoculars Revenue, (US$ Million), 2018 VS 2022 VS 2029
    Figure 3. Global Binoculars Market Size 2018-2029 (US$ Million)
    Figure 4. Global Binoculars Sales 2018-2029 (K Units)
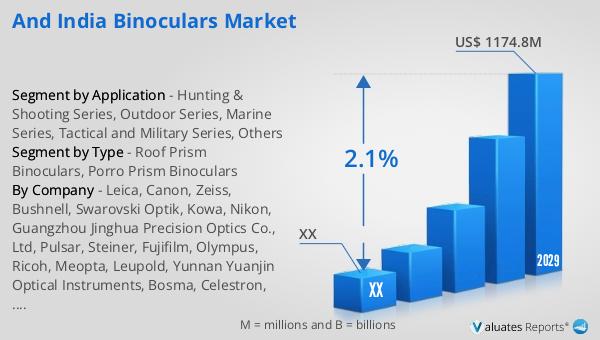
    Figure 5. India Binoculars Revenue, (US$ Million), 2018 VS 2022 VS 2029
    Figure 6. India Binoculars Market Size 2018-2029 (US$ Million)
    Figure 7. India Binoculars Sales 2018-2029 (K Units)
    Figure 8. India Binoculars Market Share in Global, in Value (US$ Million) 2018-2029
    Figure 9. India Binoculars Market Share in Global, in Volume (K Units) 2018-2029
    Figure 10. Binoculars Report Years Considered
    Figure 11. Product Picture of Roof Prism Binoculars
    Figure 12. Product Picture of Porro Prism Binoculars
    Figure 13. Global Binoculars Market Share by Type in 2022 & 2029
    Figure 14. Global Binoculars Sales in Value by Type (2018-2029) & (US$ Million)
    Figure 15. Global Binoculars Sales Market Share in Value by Type (2018-2029)
    Figure 16. Global Binoculars Sales by Type (2018-2029) & (K Units)
    Figure 17. Global Binoculars Sales Market Share in Volume by Type (2018-2029)
    Figure 18. Global Binoculars Price by Type (2018-2029) & (USD/Unit)
    Figure 19. India Binoculars Market Share by Type in 2022 & 2029
    Figure 20. India Binoculars Sales in Value by Type (2018-2029) & (US$ Million)
    Figure 21. India Binoculars Sales Market Share in Value by Type (2018-2029)
    Figure 22. India Binoculars Sales by Type (2018-2029) & (K Units)
    Figure 23. India Binoculars Sales Market Share in Volume by Type (2018-2029)
    Figure 24. India Binoculars Price by Type (2018-2029) & (USD/Unit)
    Figure 25. Product Picture of Hunting & Shooting Series
    Figure 26. Product Picture of Outdoor Series
    Figure 27. Product Picture of Marine Series
    Figure 28. Product Picture of Tactical and Military Series
    Figure 29. Product Picture of Others
    Figure 30. Global Binoculars Market Share by Application in 2022 & 2029
    Figure 31. Global Binoculars Sales in Value by Application (2018-2029) & (US$ Million)
    Figure 32. Global Binoculars Sales Market Share in Value by Application (2018-2029)
    Figure 33. Global Binoculars Sales by Application (2018-2029) & (K Units)
    Figure 34. Global Binoculars Sales Market Share in Volume by Application (2018-2029)
    Figure 35. Global Binoculars Price by Application (2018-2029) & (USD/Unit)
    Figure 36. India Binoculars Market Share by Application in 2022 & 2029
    Figure 37. India Binoculars Sales in Value by Application (2018-2029) & (US$ Million)
    Figure 38. India Binoculars Sales Market Share in Value by Application (2018-2029)
    Figure 39. India Binoculars Sales by Application (2018-2029) & (K Units)
    Figure 40. India Binoculars Sales Market Share in Volume by Application (2018-2029)
    Figure 41. India Binoculars Price by Application (2018-2029) & (USD/Unit)
    Figure 42. Americas Binoculars Sales in Volume Growth Rate 2018-2029 (K Units)
    Figure 43. Americas Binoculars Sales in Value Growth Rate 2018-2029 (US$ Million)
    Figure 44. Americas Binoculars Sales by Type (2018-2029) & (K Units)
    Figure 45. Americas Binoculars Sales Market Share in Volume by Type (2018-2029)
    Figure 46. Americas Binoculars Sales by Application (2018-2029) & (K Units)
    Figure 47. Americas Binoculars Sales Market Share in Volume by Application (2018-2029)
    Figure 48. United States Binoculars Sales in Value Growth Rate (2018-2029) & (US$ Million)
    Figure 49. Canada Binoculars Sales in Value Growth Rate (2018-2029) & (US$ Million)
    Figure 50. Mexico Binoculars Sales in Value Growth Rate (2018-2029) & (US$ Million)
    Figure 51. Brazil Binoculars Sales in Value Growth Rate (2018-2029) & (US$ Million)
    Figure 52. EMEA Binoculars Sales in Volume Growth Rate 2018-2029 (K Units)
    Figure 53. EMEA Binoculars Sales in Value Growth Rate 2018-2029 (US$ Million)
    Figure 54. EMEA Binoculars Sales by Type (2018-2029) & (K Units)
    Figure 55. EMEA Binoculars Sales Market Share in Volume by Type (2018-2029)
    Figure 56. EMEA Binoculars Sales by Application (2018-2029) & (K Units)
    Figure 57. EMEA Binoculars Sales Market Share in Volume by Application (2018-2029)
    Figure 58. Europe Binoculars Sales in Value Growth Rate (2018-2029) & (US$ Million)
    Figure 59. Middle East Binoculars Sales in Value Growth Rate (2018-2029) & (US$ Million)
    Figure 60. Africa Binoculars Sales in Value Growth Rate (2018-2029) & (US$ Million)
    Figure 61. China Binoculars Sales in Volume Growth Rate 2018-2029 (K Units)
    Figure 62. China Binoculars Sales in Value Growth Rate 2018-2029 (US$ Million)
    Figure 63. China Binoculars Sales by Type (2018-2029) & (K Units)
    Figure 64. China Binoculars Sales Market Share in Volume by Type (2018-2029)
    Figure 65. China Binoculars Sales by Application (2018-2029) & (K Units)
    Figure 66. China Binoculars Sales Market Share in Volume by Application (2018-2029)
    Figure 67. APAC Binoculars Sales in Volume Growth Rate 2018-2029 (K Units)
    Figure 68. APAC Binoculars Sales in Value Growth Rate 2018-2029 (US$ Million)
    Figure 69. APAC Binoculars Sales by Type (2018-2029) & (K Units)
    Figure 70. APAC Binoculars Sales Market Share in Volume by Type (2018-2029)
    Figure 71. APAC Binoculars Sales by Application (2018-2029) & (K Units)
    Figure 72. APAC Binoculars Sales Market Share in Volume by Application (2018-2029)
    Figure 73. Japan Binoculars Sales in Value Growth Rate (2018-2029) & (US$ Million)
    Figure 74. South Korea Binoculars Sales in Value Growth Rate (2018-2029) & (US$ Million)
    Figure 75. China Taiwan Binoculars Sales in Value Growth Rate (2018-2029) & (US$ Million)
    Figure 76. Southeast Asia Binoculars Sales in Value Growth Rate (2018-2029) & (US$ Million)
    Figure 77. India Binoculars Sales in Value Growth Rate (2018-2029) & (US$ Million)
    Figure 78. Binoculars Value Chain
    Figure 79. Binoculars Production Process
    Figure 80. Channels of Distribution
    Figure 81. Distributors Profiles
    Figure 82. Bottom-up and Top-down Approaches for This Report
    Figure 83. Data Triangulation
    Figure 84. Key Executives Interviewed
SELECT A FORMAT
Added to Cart
Electronic

$4350

Single User License
Electronic

$6525

Multi User License
Electronic

$8700

Enterprise License
Add to Cart
Buy Now (15% Discount)

OUR CUSTOMER

Bioinformatics Barcelona

SIMILAR REPORTS