List of Tables
Table 1. Global Carbon Recycling Service Market Size Growth Rate by Type (US$ Million): 2021 vs 2025 vs 2032
Table 2. Key Players of Industrial Sources
Table 3. Key Players of Atmospheric Sources
Table 4. Key Players of Biological Sources
Table 5. Key Players of Carbon Materials
Table 6. Key Players of Others
Table 7. Global Carbon Recycling Service Market Size Growth Rate by CO₂ Capture Technology (US$ Million): 2021 vs 2025 vs 2032
Table 8. Key Players of Chemical Absorption
Table 9. Key Players of Physical Adsorption
Table 10. Key Players of Membrane Separation
Table 11. Key Players of Cryogenic Distillation
Table 12. Key Players of Biological Immobilization
Table 13. Key Players of Direct Air Capture (DAC)
Table 14. Global Carbon Recycling Service Market Size Growth Rate by CO₂ Storage Methods (US$ Million): 2021 vs 2025 vs 2032
Table 15. Key Players of Geological Sequestration
Table 16. Key Players of Marine Sequestration
Table 17. Key Players of Mineral Sequestration
Table 18. Key Players of Biosequestration
Table 19. Key Players of Artificial Carbon Sequestration
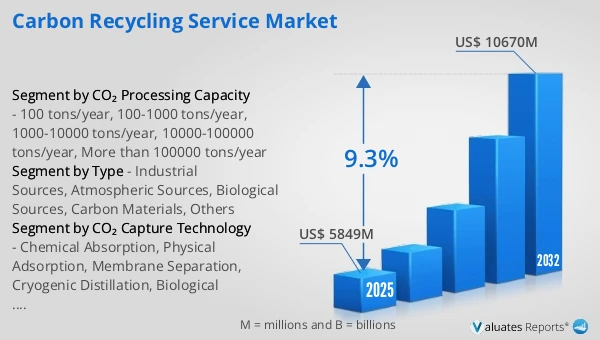
Table 20. Global Carbon Recycling Service Market Size Growth Rate by CO₂ Processing Capacity (US$ Million): 2021 vs 2025 vs 2032
Table 21. Key Players of 100 tons/year
Table 22. Key Players of 100-1000 tons/year
Table 23. Key Players of 1000-10000 tons/year
Table 24. Key Players of 10000-100000 tons/year
Table 25. Key Players of More than 100000 tons/year
Table 26. Global Carbon Recycling Service Market Size Growth by Application (US$ Million): 2021 vs 2025 vs 2032
Table 27. Global Carbon Recycling Service Market Size by Region (US$ Million): 2021 vs 2025 vs 2032
Table 28. Global Carbon Recycling Service Market Size by Region (US$ Million), 2021–2026
Table 29. Global Carbon Recycling Service Market Share by Region (2021–2026)
Table 30. Global Carbon Recycling Service Forecasted Market Size by Region (US$ Million), 2027–2032
Table 31. Global Carbon Recycling Service Market Share by Region (2027–2032)
Table 32. Carbon Recycling Service Market Trends
Table 33. Carbon Recycling Service Market Drivers
Table 34. Carbon Recycling Service Market Challenges
Table 35. Carbon Recycling Service Market Restraints
Table 36. Global Carbon Recycling Service Revenue by Players (US$ Million), 2021–2026
Table 37. Global Carbon Recycling Service Market Share by Players (2021–2026)
Table 38. Global Top Carbon Recycling Service Players by Tier (Tier 1, Tier 2, and Tier 3), based on Carbon Recycling Service Revenue, 2025
Table 39. Ranking of Global Top Carbon Recycling Service Companies by Revenue (US$ Million) in 2025
Table 40. Global 5 Largest Players Market Share by Carbon Recycling Service Revenue (CR5 and HHI), 2021–2026
Table 41. Global Key Players of Carbon Recycling Service, Headquarters and Area Served
Table 42. Global Key Players of Carbon Recycling Service, Products and Applications
Table 43. Global Key Players of Carbon Recycling Service, Date of General Availability (GA)
Table 44. Mergers and Acquisitions, Expansion Plans
Table 45. Global Carbon Recycling Service Market Size by Type (US$ Million), 2021–2026
Table 46. Global Carbon Recycling Service Revenue Market Share by Type (2021–2026)
Table 47. Global Carbon Recycling Service Forecasted Market Size by Type (US$ Million), 2027–2032
Table 48. Global Carbon Recycling Service Revenue Market Share by Type (2027–2032)
Table 49. Global Carbon Recycling Service Market Size by Application (US$ Million), 2021–2026
Table 50. Global Carbon Recycling Service Revenue Market Share by Application (2021–2026)
Table 51. Global Carbon Recycling Service Forecasted Market Size by Application (US$ Million), 2027–2032
Table 52. Global Carbon Recycling Service Revenue Market Share by Application (2027–2032)
Table 53. North America Carbon Recycling Service Market Size Growth Rate by Country (US$ Million): 2021 vs 2025 vs 2032
Table 54. North America Carbon Recycling Service Market Size by Country (US$ Million), 2021–2026
Table 55. North America Carbon Recycling Service Market Size by Country (US$ Million), 2027–2032
Table 56. Europe Carbon Recycling Service Market Size Growth Rate by Country (US$ Million): 2021 vs 2025 vs 2032
Table 57. Europe Carbon Recycling Service Market Size by Country (US$ Million), 2021–2026
Table 58. Europe Carbon Recycling Service Market Size by Country (US$ Million), 2027–2032
Table 59. Asia-Pacific Carbon Recycling Service Market Size Growth Rate by Region (US$ Million): 2021 vs 2025 vs 2032
Table 60. Asia-Pacific Carbon Recycling Service Market Size by Region (US$ Million), 2021–2026
Table 61. Asia-Pacific Carbon Recycling Service Market Size by Region (US$ Million), 2027–2032
Table 62. Latin America Carbon Recycling Service Market Size Growth Rate by Country (US$ Million): 2021 vs 2025 vs 2032
Table 63. Latin America Carbon Recycling Service Market Size by Country (US$ Million), 2021–2026
Table 64. Latin America Carbon Recycling Service Market Size by Country (US$ Million), 2027–2032
Table 65. Middle East & Africa Carbon Recycling Service Market Size Growth Rate by Country (US$ Million): 2021 vs 2025 vs 2032
Table 66. Middle East & Africa Carbon Recycling Service Market Size by Country (US$ Million), 2021–2026
Table 67. Middle East & Africa Carbon Recycling Service Market Size by Country (US$ Million), 2027–2032
Table 68. Air Liquide Company Details
Table 69. Air Liquide Business Overview
Table 70. Air Liquide Carbon Recycling Service Product
Table 71. Air Liquide Revenue in Carbon Recycling Service Business (US$ Million), 2021–2026
Table 72. Air Liquide Recent Development
Table 73. Linde Company Details
Table 74. Linde Business Overview
Table 75. Linde Carbon Recycling Service Product
Table 76. Linde Revenue in Carbon Recycling Service Business (US$ Million), 2021–2026
Table 77. Linde Recent Development
Table 78. Air Products Company Details
Table 79. Air Products Business Overview
Table 80. Air Products Carbon Recycling Service Product
Table 81. Air Products Revenue in Carbon Recycling Service Business (US$ Million), 2021–2026
Table 82. Air Products Recent Development
Table 83. BASF Company Details
Table 84. BASF Business Overview
Table 85. BASF Carbon Recycling Service Product
Table 86. BASF Revenue in Carbon Recycling Service Business (US$ Million), 2021–2026
Table 87. BASF Recent Development
Table 88. Chiyoda Company Details
Table 89. Chiyoda Business Overview
Table 90. Chiyoda Carbon Recycling Service Product
Table 91. Chiyoda Revenue in Carbon Recycling Service Business (US$ Million), 2021–2026
Table 92. Chiyoda Recent Development
Table 93. TOYO Engineering Company Details
Table 94. TOYO Engineering Business Overview
Table 95. TOYO Engineering Carbon Recycling Service Product
Table 96. TOYO Engineering Revenue in Carbon Recycling Service Business (US$ Million), 2021–2026
Table 97. TOYO Engineering Recent Development
Table 98. JGC Company Details
Table 99. JGC Business Overview
Table 100. JGC Carbon Recycling Service Product
Table 101. JGC Revenue in Carbon Recycling Service Business (US$ Million), 2021–2026
Table 102. JGC Recent Development
Table 103. Carbon Recycling International Company Details
Table 104. Carbon Recycling International Business Overview
Table 105. Carbon Recycling International Carbon Recycling Service Product
Table 106. Carbon Recycling International Revenue in Carbon Recycling Service Business (US$ Million), 2021–2026
Table 107. Carbon Recycling International Recent Development
Table 108. LanzaTech Company Details
Table 109. LanzaTech Business Overview
Table 110. LanzaTech Carbon Recycling Service Product
Table 111. LanzaTech Revenue in Carbon Recycling Service Business (US$ Million), 2021–2026
Table 112. LanzaTech Recent Development
Table 113. LanzaJet Company Details
Table 114. LanzaJet Business Overview
Table 115. LanzaJet Carbon Recycling Service Product
Table 116. LanzaJet Revenue in Carbon Recycling Service Business (US$ Million), 2021–2026
Table 117. LanzaJet Recent Development
Table 118. European Energy Company Details
Table 119. European Energy Business Overview
Table 120. European Energy Carbon Recycling Service Product
Table 121. European Energy Revenue in Carbon Recycling Service Business (US$ Million), 2021–2026
Table 122. European Energy Recent Development
Table 123. Liquid Wind Company Details
Table 124. Liquid Wind Business Overview
Table 125. Liquid Wind Carbon Recycling Service Product
Table 126. Liquid Wind Revenue in Carbon Recycling Service Business (US$ Million), 2021–2026
Table 127. Liquid Wind Recent Development
Table 128. HIF Global Company Details
Table 129. HIF Global Business Overview
Table 130. HIF Global Carbon Recycling Service Product
Table 131. HIF Global Revenue in Carbon Recycling Service Business (US$ Million), 2021–2026
Table 132. HIF Global Recent Development
Table 133. Infinium Company Details
Table 134. Infinium Business Overview
Table 135. Infinium Carbon Recycling Service Product
Table 136. Infinium Revenue in Carbon Recycling Service Business (US$ Million), 2021–2026
Table 137. Infinium Recent Development
Table 138. Twelve Company Details
Table 139. Twelve Business Overview
Table 140. Twelve Carbon Recycling Service Product
Table 141. Twelve Revenue in Carbon Recycling Service Business (US$ Million), 2021–2026
Table 142. Twelve Recent Development
Table 143. AIR COMPANY Company Details
Table 144. AIR COMPANY Business Overview
Table 145. AIR COMPANY Carbon Recycling Service Product
Table 146. AIR COMPANY Revenue in Carbon Recycling Service Business (US$ Million), 2021–2026
Table 147. AIR COMPANY Recent Development
Table 148. Covestro Company Details
Table 149. Covestro Business Overview
Table 150. Covestro Carbon Recycling Service Product
Table 151. Covestro Revenue in Carbon Recycling Service Business (US$ Million), 2021–2026
Table 152. Covestro Recent Development
Table 153. Econic Technologies Company Details
Table 154. Econic Technologies Business Overview
Table 155. Econic Technologies Carbon Recycling Service Product
Table 156. Econic Technologies Revenue in Carbon Recycling Service Business (US$ Million), 2021–2026
Table 157. Econic Technologies Recent Development
Table 158. Newlight Technologies Company Details
Table 159. Newlight Technologies Business Overview
Table 160. Newlight Technologies Carbon Recycling Service Product
Table 161. Newlight Technologies Revenue in Carbon Recycling Service Business (US$ Million), 2021–2026
Table 162. Newlight Technologies Recent Development
Table 163. Novomer Company Details
Table 164. Novomer Business Overview
Table 165. Novomer Carbon Recycling Service Product
Table 166. Novomer Revenue in Carbon Recycling Service Business (US$ Million), 2021–2026
Table 167. Novomer Recent Development
Table 168. CarbonCure Technologies Company Details
Table 169. CarbonCure Technologies Business Overview
Table 170. CarbonCure Technologies Carbon Recycling Service Product
Table 171. CarbonCure Technologies Revenue in Carbon Recycling Service Business (US$ Million), 2021–2026
Table 172. CarbonCure Technologies Recent Development
Table 173. CarbonBuilt Company Details
Table 174. CarbonBuilt Business Overview
Table 175. CarbonBuilt Carbon Recycling Service Product
Table 176. CarbonBuilt Revenue in Carbon Recycling Service Business (US$ Million), 2021–2026
Table 177. CarbonBuilt Recent Development
Table 178. neustark Company Details
Table 179. neustark Business Overview
Table 180. neustark Carbon Recycling Service Product
Table 181. neustark Revenue in Carbon Recycling Service Business (US$ Million), 2021–2026
Table 182. neustark Recent Development
Table 183. Blue Planet Systems Company Details
Table 184. Blue Planet Systems Business Overview
Table 185. Blue Planet Systems Carbon Recycling Service Product
Table 186. Blue Planet Systems Revenue in Carbon Recycling Service Business (US$ Million), 2021–2026
Table 187. Blue Planet Systems Recent Development
Table 188. CarbiCrete Company Details
Table 189. CarbiCrete Business Overview
Table 190. CarbiCrete Carbon Recycling Service Product
Table 191. CarbiCrete Revenue in Carbon Recycling Service Business (US$ Million), 2021–2026
Table 192. CarbiCrete Recent Development
Table 193. Carbon Upcycling Technologies Company Details
Table 194. Carbon Upcycling Technologies Business Overview
Table 195. Carbon Upcycling Technologies Carbon Recycling Service Product
Table 196. Carbon Upcycling Technologies Revenue in Carbon Recycling Service Business (US$ Million), 2021–2026
Table 197. Carbon Upcycling Technologies Recent Development
Table 198. MCi Carbon Company Details
Table 199. MCi Carbon Business Overview
Table 200. MCi Carbon Carbon Recycling Service Product
Table 201. MCi Carbon Revenue in Carbon Recycling Service Business (US$ Million), 2021–2026
Table 202. MCi Carbon Recent Development
Table 203. Carbon8 Systems Company Details
Table 204. Carbon8 Systems Business Overview
Table 205. Carbon8 Systems Carbon Recycling Service Product
Table 206. Carbon8 Systems Revenue in Carbon Recycling Service Business (US$ Million), 2021–2026
Table 207. Carbon8 Systems Recent Development
Table 208. Research Programs/Design for This Report
Table 209. Key Data Information from Secondary Sources
Table 210. Key Data Information from Primary Sources
Table 211. Authors List of This Report
List of Figures
Figure 1. Carbon Recycling Service Picture
Figure 2. Global Carbon Recycling Service Market Size Comparison by Type (US$ Million), 2021–2032
Figure 3. Global Carbon Recycling Service Market Share by Type: 2025 vs 2032
Figure 4. Industrial Sources Features
Figure 5. Atmospheric Sources Features
Figure 6. Biological Sources Features
Figure 7. Carbon Materials Features
Figure 8. Others Features
Figure 9. Global Carbon Recycling Service Market Size Comparison by CO₂ Capture Technology (US$ Million), 2021–2032
Figure 10. Chemical Absorption Features
Figure 11. Physical Adsorption Features
Figure 12. Membrane Separation Features
Figure 13. Cryogenic Distillation Features
Figure 14. Biological Immobilization Features
Figure 15. Direct Air Capture (DAC) Features
Figure 16. Global Carbon Recycling Service Market Size Comparison by CO₂ Storage Methods (US$ Million), 2021–2032
Figure 17. Geological Sequestration Features
Figure 18. Marine Sequestration Features
Figure 19. Mineral Sequestration Features
Figure 20. Biosequestration Features
Figure 21. Artificial Carbon Sequestration Features
Figure 22. Global Carbon Recycling Service Market Size Comparison by CO₂ Processing Capacity (US$ Million), 2021–2032
Figure 23. 100 tons/year Features
Figure 24. 100-1000 tons/year Features
Figure 25. 1000-10000 tons/year Features
Figure 26. 10000-100000 tons/year Features
Figure 27. More than 100000 tons/year Features
Figure 28. Global Carbon Recycling Service Market Size by Application (US$ Million), 2021–2032
Figure 29. Global Carbon Recycling Service Market Share by Application: 2025 vs 2032
Figure 30. Power Case Studies
Figure 31. Steel Case Studies
Figure 32. Chemical Case Studies
Figure 33. Building Materials Case Studies
Figure 34. Agriculture Case Studies
Figure 35. Carbon Recycling Service Report Years Considered
Figure 36. Global Carbon Recycling Service Market Size (US$ Million), Year-over-Year: 2021–2032
Figure 37. Global Carbon Recycling Service Market Size, (US$ Million), 2021 vs 2025 vs 2032
Figure 38. Global Carbon Recycling Service Market Share by Region: 2025 vs 2032
Figure 39. Global Carbon Recycling Service Market Share by Players in 2025
Figure 40. Global Carbon Recycling Service Market Share by Company Type (Tier 1, Tier 2, and Tier 3)
Figure 41. The Top 10 and 5 Players Market Share by Carbon Recycling Service Revenue in 2025
Figure 42. North America Carbon Recycling Service Market Size YoY Growth (US$ Million), 2021–2032
Figure 43. North America Carbon Recycling Service Market Share by Country (2021–2032)
Figure 44. United States Carbon Recycling Service Market Size YoY Growth (US$ Million), 2021–2032
Figure 45. Canada Carbon Recycling Service Market Size YoY Growth (US$ Million), 2021–2032
Figure 46. Europe Carbon Recycling Service Market Size YoY Growth (US$ Million), 2021–2032
Figure 47. Europe Carbon Recycling Service Market Share by Country (2021–2032)
Figure 48. Germany Carbon Recycling Service Market Size YoY Growth (US$ Million), 2021–2032
Figure 49. France Carbon Recycling Service Market Size YoY Growth (US$ Million), 2021–2032
Figure 50. U.K. Carbon Recycling Service Market Size YoY Growth (US$ Million), 2021–2032
Figure 51. Italy Carbon Recycling Service Market Size YoY Growth (US$ Million), 2021–2032
Figure 52. Russia Carbon Recycling Service Market Size YoY Growth (US$ Million), 2021–2032
Figure 53. Ireland Carbon Recycling Service Market Size YoY Growth (US$ Million), 2021–2032
Figure 54. Asia-Pacific Carbon Recycling Service Market Size YoY Growth (US$ Million), 2021–2032
Figure 55. Asia-Pacific Carbon Recycling Service Market Share by Region (2021–2032)
Figure 56. China Carbon Recycling Service Market Size YoY Growth (US$ Million), 2021–2032
Figure 57. Japan Carbon Recycling Service Market Size YoY Growth (US$ Million), 2021–2032
Figure 58. South Korea Carbon Recycling Service Market Size YoY Growth (US$ Million), 2021–2032
Figure 59. Southeast Asia Carbon Recycling Service Market Size YoY Growth (US$ Million), 2021–2032
Figure 60. India Carbon Recycling Service Market Size YoY Growth (US$ Million), 2021–2032
Figure 61. Australia & New Zealand Carbon Recycling Service Market Size YoY Growth (US$ Million), 2021–2032
Figure 62. Latin America Carbon Recycling Service Market Size YoY Growth (US$ Million), 2021–2032
Figure 63. Latin America Carbon Recycling Service Market Share by Country (2021–2032)
Figure 64. Mexico Carbon Recycling Service Market Size YoY Growth (US$ Million), 2021–2032
Figure 65. Brazil Carbon Recycling Service Market Size YoY Growth (US$ Million), 2021–2032
Figure 66. Middle East & Africa Carbon Recycling Service Market Size YoY Growth (US$ Million), 2021–2032
Figure 67. Middle East & Africa Carbon Recycling Service Market Share by Country (2021–2032)
Figure 68. Israel Carbon Recycling Service Market Size YoY Growth (US$ Million), 2021–2032
Figure 69. Saudi Arabia Carbon Recycling Service Market Size YoY Growth (US$ Million), 2021–2032
Figure 70. UAE Carbon Recycling Service Market Size YoY Growth (US$ Million), 2021–2032
Figure 71. Air Liquide Revenue Growth Rate in Carbon Recycling Service Business (2021–2026)
Figure 72. Linde Revenue Growth Rate in Carbon Recycling Service Business (2021–2026)
Figure 73. Air Products Revenue Growth Rate in Carbon Recycling Service Business (2021–2026)
Figure 74. BASF Revenue Growth Rate in Carbon Recycling Service Business (2021–2026)
Figure 75. Chiyoda Revenue Growth Rate in Carbon Recycling Service Business (2021–2026)
Figure 76. TOYO Engineering Revenue Growth Rate in Carbon Recycling Service Business (2021–2026)
Figure 77. JGC Revenue Growth Rate in Carbon Recycling Service Business (2021–2026)
Figure 78. Carbon Recycling International Revenue Growth Rate in Carbon Recycling Service Business (2021–2026)
Figure 79. LanzaTech Revenue Growth Rate in Carbon Recycling Service Business (2021–2026)
Figure 80. LanzaJet Revenue Growth Rate in Carbon Recycling Service Business (2021–2026)
Figure 81. European Energy Revenue Growth Rate in Carbon Recycling Service Business (2021–2026)
Figure 82. Liquid Wind Revenue Growth Rate in Carbon Recycling Service Business (2021–2026)
Figure 83. HIF Global Revenue Growth Rate in Carbon Recycling Service Business (2021–2026)
Figure 84. Infinium Revenue Growth Rate in Carbon Recycling Service Business (2021–2026)
Figure 85. Twelve Revenue Growth Rate in Carbon Recycling Service Business (2021–2026)
Figure 86. AIR COMPANY Revenue Growth Rate in Carbon Recycling Service Business (2021–2026)
Figure 87. Covestro Revenue Growth Rate in Carbon Recycling Service Business (2021–2026)
Figure 88. Econic Technologies Revenue Growth Rate in Carbon Recycling Service Business (2021–2026)
Figure 89. Newlight Technologies Revenue Growth Rate in Carbon Recycling Service Business (2021–2026)
Figure 90. Novomer Revenue Growth Rate in Carbon Recycling Service Business (2021–2026)
Figure 91. CarbonCure Technologies Revenue Growth Rate in Carbon Recycling Service Business (2021–2026)
Figure 92. CarbonBuilt Revenue Growth Rate in Carbon Recycling Service Business (2021–2026)
Figure 93. neustark Revenue Growth Rate in Carbon Recycling Service Business (2021–2026)
Figure 94. Blue Planet Systems Revenue Growth Rate in Carbon Recycling Service Business (2021–2026)
Figure 95. CarbiCrete Revenue Growth Rate in Carbon Recycling Service Business (2021–2026)
Figure 96. Carbon Upcycling Technologies Revenue Growth Rate in Carbon Recycling Service Business (2021–2026)
Figure 97. MCi Carbon Revenue Growth Rate in Carbon Recycling Service Business (2021–2026)
Figure 98. Carbon8 Systems Revenue Growth Rate in Carbon Recycling Service Business (2021–2026)
Figure 99. Bottom-up and Top-down Approaches for This Report
Figure 100. Data Triangulation
Figure 101. Key Executives Interviewed