List of Tables
Table 1. Egg Protein CAGR in Value, India VS Global, 2018 VS 2022 VS 2029
Table 2. Egg Protein Market Trends
Table 3. Egg Protein Market Drivers
Table 4. Egg Protein Market Challenges
Table 5. Egg Protein Market Restraints
Table 6. Global Egg Protein Sales Growth Rate (CAGR) by Type: 2018 VS 2022 VS 2029 (US$ Million)
Table 7. India Egg Protein Sales Growth Rate (CAGR) by Type: 2018 VS 2022 VS 2029 (US$ Million)
Table 8. Global Egg Protein Sales Growth Rate (CAGR) by Application: 2018 VS 2022 VS 2029 (US$ Million)
Table 9. India Egg Protein Sales Growth Rate (CAGR) by Application: 2018 VS 2022 VS 2029 (US$ Million)
Table 10. Global Key Manufacturers of Egg Protein, Ranked by Revenue (2022) & (US$ Million)
Table 11. Global Egg Protein Revenue by Manufacturer, (US$ Million), 2018-2023
Table 12. Global Egg Protein Revenue Share by Manufacturer, 2018-2023
Table 13. Global Egg Protein Sales by Manufacturer, (K MT), 2018-2023
Table 14. Global Egg Protein Sales Share by Manufacturer, 2018-2023
Table 15. Global Egg Protein Price by Manufacturer (2018-2023) & (USD/MT)
Table 16. Global Egg Protein Manufacturers Market Concentration Ratio (CR5 and HHI)
Table 17. Global Egg Protein by Company Type (Tier 1, Tier 2, and Tier 3) & (based on the Revenue in Egg Protein as of 2022)
Table 18. Global Key Manufacturers of Egg Protein, Manufacturing Base Distribution and Headquarters
Table 19. Global Key Manufacturers of Egg Protein, Product Offered and Application
Table 20. Global Key Manufacturers of Egg Protein, Date of Enter into This Industry
Table 21. Manufacturers Mergers & Acquisitions, Expansion Plans
Table 22. Key Players of Egg Protein in India, Ranked by Revenue (2022) & (US$ million)
Table 23. India Egg Protein Revenue by Players, (US$ Million), (2018-2023)
Table 24. India Egg Protein Revenue Share by Players, (2018-2023)
Table 25. India Egg Protein Sales by Players, (K MT), (2018-2023)
Table 26. India Egg Protein Sales Share by Players, (2018-2023)
Table 27. Global Egg Protein Market Size Growth Rate (CAGR) by Region (US$ Million): 2018 VS 2022 VS 2029
Table 28. Global Egg Protein Sales in Volume by Region (2018-2023) & (K MT)
Table 29. Global Egg Protein Sales in Volume Forecast by Region (2024-2029) & (K MT)
Table 30. Global Egg Protein Sales in Value by Region (2018-2023) & (US$ Million)
Table 31. Global Egg Protein Sales in Value Forecast by Region (2024-2029) & (US$ Million)
Table 32. Americas Egg Protein Market Size Growth Rate (CAGR) by Country (US$ Million): 2018 VS 2022 VS 2029
Table 33. Americas Egg Protein Sales in Value by Country (2018-2023) & (US$ Million)
Table 34. Americas Egg Protein Sales in Value by Country (2024-2029) & (US$ Million)
Table 35. Americas Egg Protein Sales in Volume by Country (2018-2023) & (K MT)
Table 36. Americas Egg Protein Sales in Volume by Country (2024-2029) & (K MT)
Table 37. EMEA Egg Protein Market Size Growth Rate (CAGR) by Country (US$ Million): 2018 VS 2022 VS 2029
Table 38. EMEA Egg Protein Sales in Value by Country (2018-2023) & (US$ Million)
Table 39. EMEA Egg Protein Sales in Value by Country (2024-2029) & (US$ Million)
Table 40. EMEA Egg Protein Sales in Volume by Country (2018-2023) & (K MT)
Table 41. EMEA Egg Protein Sales in Volume by Country (2024-2029) & (K MT)
Table 42. APAC Egg Protein Market Size Growth Rate (CAGR) by Country (US$ Million): 2018 VS 2022 VS 2029
Table 43. APAC Egg Protein Sales in Value by Country (2018-2023) & (US$ Million)
Table 44. APAC Egg Protein Sales in Value by Country (2024-2029) & (US$ Million)
Table 45. APAC Egg Protein Sales in Volume by Country (2018-2023) & (K MT)
Table 46. APAC Egg Protein Sales in Volume by Country (2024-2029) & (K MT)
Table 47. Avangardco Company Information
Table 48. Avangardco Description and Business Overview
Table 49. Avangardco Egg Protein Sales (K MT), Revenue (US$ Million), Price (USD/MT) and Gross Margin (2018-2023)
Table 50. Avangardco Egg Protein Product
Table 51. Avangardco Recent Development
Table 52. Sanovo Company Information
Table 53. Sanovo Description and Business Overview
Table 54. Sanovo Egg Protein Sales (K MT), Revenue (US$ Million), Price (USD/MT) and Gross Margin (2018-2023)
Table 55. Sanovo Egg Protein Product
Table 56. Sanovo Recent Development
Table 57. IGRECA Company Information
Table 58. IGRECA Description and Business Overview
Table 59. IGRECA Egg Protein Sales (K MT), Revenue (US$ Million), Price (USD/MT) and Gross Margin (2018-2023)
Table 60. IGRECA Egg Protein Product
Table 61. IGRECA Recent Development
Table 62. Interovo Company Information
Table 63. Interovo Description and Business Overview
Table 64. Interovo Egg Protein Sales (K MT), Revenue (US$ Million), Price (USD/MT) and Gross Margin (2018-2023)
Table 65. Interovo Egg Protein Product
Table 66. Interovo Recent Development
Table 67. Bouwhuis Enthoven Company Information
Table 68. Bouwhuis Enthoven Description and Business Overview
Table 69. Bouwhuis Enthoven Egg Protein Sales (K MT), Revenue (US$ Million), Price (USD/MT) and Gross Margin (2018-2023)
Table 70. Bouwhuis Enthoven Egg Protein Product
Table 71. Bouwhuis Enthoven Recent Development
Table 72. BNLfood Company Information
Table 73. BNLfood Description and Business Overview
Table 74. BNLfood Egg Protein Sales (K MT), Revenue (US$ Million), Price (USD/MT) and Gross Margin (2018-2023)
Table 75. BNLfood Egg Protein Product
Table 76. BNLfood Recent Development
Table 77. Post Holdings Company Information
Table 78. Post Holdings Description and Business Overview
Table 79. Post Holdings Egg Protein Sales (K MT), Revenue (US$ Million), Price (USD/MT) and Gross Margin (2018-2023)
Table 80. Post Holdings Egg Protein Product
Table 81. Post Holdings Recent Development
Table 82. Eurovo Group Company Information
Table 83. Eurovo Group Description and Business Overview
Table 84. Eurovo Group Egg Protein Sales (K MT), Revenue (US$ Million), Price (USD/MT) and Gross Margin (2018-2023)
Table 85. Eurovo Group Egg Protein Product
Table 86. Eurovo Group Recent Development
Table 87. Rose Acre Farms Company Information
Table 88. Rose Acre Farms Description and Business Overview
Table 89. Rose Acre Farms Egg Protein Sales (K MT), Revenue (US$ Million), Price (USD/MT) and Gross Margin (2018-2023)
Table 90. Rose Acre Farms Egg Protein Product
Table 91. Rose Acre Farms Recent Development
Table 92. VH Group Company Information
Table 93. VH Group Description and Business Overview
Table 94. VH Group Egg Protein Sales (K MT), Revenue (US$ Million), Price (USD/MT) and Gross Margin (2018-2023)
Table 95. VH Group Egg Protein Product
Table 96. VH Group Recent Development
Table 97. Wulro Company Information
Table 98. Wulro Description and Business Overview
Table 99. Wulro Egg Protein Sales (K MT), Revenue (US$ Million), Price (USD/MT) and Gross Margin (2018-2023)
Table 100. Wulro Egg Protein Product
Table 101. Wulro Recent Development
Table 102. A.G. Foods Company Information
Table 103. A.G. Foods Description and Business Overview
Table 104. A.G. Foods Egg Protein Sales (K MT), Revenue (US$ Million), Price (USD/MT) and Gross Margin (2018-2023)
Table 105. A.G. Foods Egg Protein Product
Table 106. A.G. Foods Recent Development
Table 107. Farm Pride Company Information
Table 108. Farm Pride Description and Business Overview
Table 109. Farm Pride Egg Protein Sales (K MT), Revenue (US$ Million), Price (USD/MT) and Gross Margin (2018-2023)
Table 110. Farm Pride Egg Protein Product
Table 111. Farm Pride Recent Development
Table 112. GF Ovodry Company Information
Table 113. GF Ovodry Description and Business Overview
Table 114. GF Ovodry Egg Protein Sales (K MT), Revenue (US$ Million), Price (USD/MT) and Gross Margin (2018-2023)
Table 115. GF Ovodry Egg Protein Product
Table 116. GF Ovodry Recent Development
Table 117. Adriaan Goede Company Information
Table 118. Adriaan Goede Description and Business Overview
Table 119. Adriaan Goede Egg Protein Sales (K MT), Revenue (US$ Million), Price (USD/MT) and Gross Margin (2018-2023)
Table 120. Adriaan Goede Egg Protein Product
Table 121. Adriaan Goede Recent Development
Table 122. SOVIMO HELLAS Company Information
Table 123. SOVIMO HELLAS Description and Business Overview
Table 124. SOVIMO HELLAS Egg Protein Sales (K MT), Revenue (US$ Million), Price (USD/MT) and Gross Margin (2018-2023)
Table 125. SOVIMO HELLAS Egg Protein Product
Table 126. SOVIMO HELLAS Recent Development
Table 127. Rembrandt Company Information
Table 128. Rembrandt Description and Business Overview
Table 129. Rembrandt Egg Protein Sales (K MT), Revenue (US$ Million), Price (USD/MT) and Gross Margin (2018-2023)
Table 130. Rembrandt Egg Protein Product
Table 131. Rembrandt Recent Development
Table 132. DEB EL FOOD Company Information
Table 133. DEB EL FOOD Description and Business Overview
Table 134. DEB EL FOOD Egg Protein Sales (K MT), Revenue (US$ Million), Price (USD/MT) and Gross Margin (2018-2023)
Table 135. DEB EL FOOD Egg Protein Product
Table 136. DEB EL FOOD Recent Development
Table 137. Lodewijckx Group Company Information
Table 138. Lodewijckx Group Description and Business Overview
Table 139. Lodewijckx Group Egg Protein Sales (K MT), Revenue (US$ Million), Price (USD/MT) and Gross Margin (2018-2023)
Table 140. Lodewijckx Group Egg Protein Product
Table 141. Lodewijckx Group Recent Development
Table 142. Kewpie Company Information
Table 143. Kewpie Description and Business Overview
Table 144. Kewpie Egg Protein Sales (K MT), Revenue (US$ Million), Price (USD/MT) and Gross Margin (2018-2023)
Table 145. Kewpie Egg Protein Product
Table 146. Kewpie Recent Development
Table 147. Dalian Lvxue Company Information
Table 148. Dalian Lvxue Description and Business Overview
Table 149. Dalian Lvxue Egg Protein Sales (K MT), Revenue (US$ Million), Price (USD/MT) and Gross Margin (2018-2023)
Table 150. Dalian Lvxue Egg Protein Product
Table 151. Dalian Lvxue Recent Development
Table 152. Jinlin Houde Company Information
Table 153. Jinlin Houde Description and Business Overview
Table 154. Jinlin Houde Egg Protein Sales (K MT), Revenue (US$ Million), Price (USD/MT) and Gross Margin (2018-2023)
Table 155. Jinlin Houde Egg Protein Product
Table 156. Jinlin Houde Recent Development
Table 157. Kangde Biological Company Information
Table 158. Kangde Biological Description and Business Overview
Table 159. Kangde Biological Egg Protein Sales (K MT), Revenue (US$ Million), Price (USD/MT) and Gross Margin (2018-2023)
Table 160. Kangde Biological Egg Protein Product
Table 161. Kangde Biological Recent Development
Table 162. Dalian Hanovo Foods Company Information
Table 163. Dalian Hanovo Foods Description and Business Overview
Table 164. Dalian Hanovo Foods Egg Protein Sales (K MT), Revenue (US$ Million), Price (USD/MT) and Gross Margin (2018-2023)
Table 165. Dalian Hanovo Foods Egg Protein Product
Table 166. Dalian Hanovo Foods Recent Development
Table 167. Etam Biological Polytron Technologies Company Information
Table 168. Etam Biological Polytron Technologies Description and Business Overview
Table 169. Etam Biological Polytron Technologies Egg Protein Sales (K MT), Revenue (US$ Million), Price (USD/MT) and Gross Margin (2018-2023)
Table 170. Etam Biological Polytron Technologies Egg Protein Product
Table 171. Etam Biological Polytron Technologies Recent Development
Table 172. Key Raw Materials Lists
Table 173. Raw Materials Key Suppliers Lists
Table 174. Egg Protein Customers List
Table 175. Egg Protein Distributors List
Table 176. Research Programs/Design for This Report
Table 177. Key Data Information from Secondary Sources
Table 178. Key Data Information from Primary Sources
List of Figures
Figure 1. Egg Protein Product Picture
Figure 2. Global Egg Protein Revenue, (US$ Million), 2018 VS 2022 VS 2029
Figure 3. Global Egg Protein Market Size 2018-2029 (US$ Million)
Figure 4. Global Egg Protein Sales 2018-2029 (K MT)
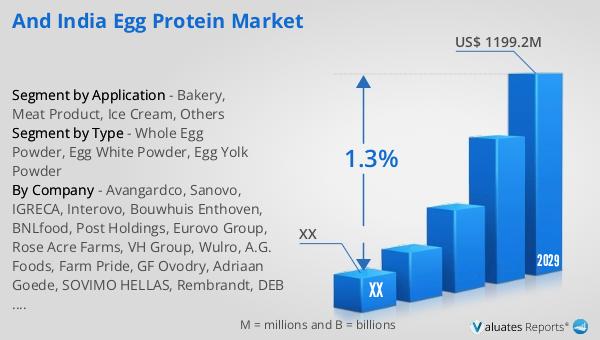
Figure 5. India Egg Protein Revenue, (US$ Million), 2018 VS 2022 VS 2029
Figure 6. India Egg Protein Market Size 2018-2029 (US$ Million)
Figure 7. India Egg Protein Sales 2018-2029 (K MT)
Figure 8. India Egg Protein Market Share in Global, in Value (US$ Million) 2018-2029
Figure 9. India Egg Protein Market Share in Global, in Volume (K MT) 2018-2029
Figure 10. Egg Protein Report Years Considered
Figure 11. Product Picture of Whole Egg Powder
Figure 12. Product Picture of Egg White Powder
Figure 13. Product Picture of Egg Yolk Powder
Figure 14. Global Egg Protein Market Share by Type in 2022 & 2029
Figure 15. Global Egg Protein Sales in Value by Type (2018-2029) & (US$ Million)
Figure 16. Global Egg Protein Sales Market Share in Value by Type (2018-2029)
Figure 17. Global Egg Protein Sales by Type (2018-2029) & (K MT)
Figure 18. Global Egg Protein Sales Market Share in Volume by Type (2018-2029)
Figure 19. Global Egg Protein Price by Type (2018-2029) & (USD/MT)
Figure 20. India Egg Protein Market Share by Type in 2022 & 2029
Figure 21. India Egg Protein Sales in Value by Type (2018-2029) & (US$ Million)
Figure 22. India Egg Protein Sales Market Share in Value by Type (2018-2029)
Figure 23. India Egg Protein Sales by Type (2018-2029) & (K MT)
Figure 24. India Egg Protein Sales Market Share in Volume by Type (2018-2029)
Figure 25. India Egg Protein Price by Type (2018-2029) & (USD/MT)
Figure 26. Product Picture of Bakery
Figure 27. Product Picture of Meat Product
Figure 28. Product Picture of Ice Cream
Figure 29. Product Picture of Others
Figure 30. Global Egg Protein Market Share by Application in 2022 & 2029
Figure 31. Global Egg Protein Sales in Value by Application (2018-2029) & (US$ Million)
Figure 32. Global Egg Protein Sales Market Share in Value by Application (2018-2029)
Figure 33. Global Egg Protein Sales by Application (2018-2029) & (K MT)
Figure 34. Global Egg Protein Sales Market Share in Volume by Application (2018-2029)
Figure 35. Global Egg Protein Price by Application (2018-2029) & (USD/MT)
Figure 36. India Egg Protein Market Share by Application in 2022 & 2029
Figure 37. India Egg Protein Sales in Value by Application (2018-2029) & (US$ Million)
Figure 38. India Egg Protein Sales Market Share in Value by Application (2018-2029)
Figure 39. India Egg Protein Sales by Application (2018-2029) & (K MT)
Figure 40. India Egg Protein Sales Market Share in Volume by Application (2018-2029)
Figure 41. India Egg Protein Price by Application (2018-2029) & (USD/MT)
Figure 42. Americas Egg Protein Sales in Volume Growth Rate 2018-2029 (K MT)
Figure 43. Americas Egg Protein Sales in Value Growth Rate 2018-2029 (US$ Million)
Figure 44. Americas Egg Protein Sales by Type (2018-2029) & (K MT)
Figure 45. Americas Egg Protein Sales Market Share in Volume by Type (2018-2029)
Figure 46. Americas Egg Protein Sales by Application (2018-2029) & (K MT)
Figure 47. Americas Egg Protein Sales Market Share in Volume by Application (2018-2029)
Figure 48. United States Egg Protein Sales in Value Growth Rate (2018-2029) & (US$ Million)
Figure 49. Canada Egg Protein Sales in Value Growth Rate (2018-2029) & (US$ Million)
Figure 50. Mexico Egg Protein Sales in Value Growth Rate (2018-2029) & (US$ Million)
Figure 51. Brazil Egg Protein Sales in Value Growth Rate (2018-2029) & (US$ Million)
Figure 52. EMEA Egg Protein Sales in Volume Growth Rate 2018-2029 (K MT)
Figure 53. EMEA Egg Protein Sales in Value Growth Rate 2018-2029 (US$ Million)
Figure 54. EMEA Egg Protein Sales by Type (2018-2029) & (K MT)
Figure 55. EMEA Egg Protein Sales Market Share in Volume by Type (2018-2029)
Figure 56. EMEA Egg Protein Sales by Application (2018-2029) & (K MT)
Figure 57. EMEA Egg Protein Sales Market Share in Volume by Application (2018-2029)
Figure 58. Europe Egg Protein Sales in Value Growth Rate (2018-2029) & (US$ Million)
Figure 59. Middle East Egg Protein Sales in Value Growth Rate (2018-2029) & (US$ Million)
Figure 60. Africa Egg Protein Sales in Value Growth Rate (2018-2029) & (US$ Million)
Figure 61. China Egg Protein Sales in Volume Growth Rate 2018-2029 (K MT)
Figure 62. China Egg Protein Sales in Value Growth Rate 2018-2029 (US$ Million)
Figure 63. China Egg Protein Sales by Type (2018-2029) & (K MT)
Figure 64. China Egg Protein Sales Market Share in Volume by Type (2018-2029)
Figure 65. China Egg Protein Sales by Application (2018-2029) & (K MT)
Figure 66. China Egg Protein Sales Market Share in Volume by Application (2018-2029)
Figure 67. APAC Egg Protein Sales in Volume Growth Rate 2018-2029 (K MT)
Figure 68. APAC Egg Protein Sales in Value Growth Rate 2018-2029 (US$ Million)
Figure 69. APAC Egg Protein Sales by Type (2018-2029) & (K MT)
Figure 70. APAC Egg Protein Sales Market Share in Volume by Type (2018-2029)
Figure 71. APAC Egg Protein Sales by Application (2018-2029) & (K MT)
Figure 72. APAC Egg Protein Sales Market Share in Volume by Application (2018-2029)
Figure 73. Japan Egg Protein Sales in Value Growth Rate (2018-2029) & (US$ Million)
Figure 74. South Korea Egg Protein Sales in Value Growth Rate (2018-2029) & (US$ Million)
Figure 75. China Taiwan Egg Protein Sales in Value Growth Rate (2018-2029) & (US$ Million)
Figure 76. Southeast Asia Egg Protein Sales in Value Growth Rate (2018-2029) & (US$ Million)
Figure 77. India Egg Protein Sales in Value Growth Rate (2018-2029) & (US$ Million)
Figure 78. Egg Protein Value Chain
Figure 79. Egg Protein Production Process
Figure 80. Channels of Distribution
Figure 81. Distributors Profiles
Figure 82. Bottom-up and Top-down Approaches for This Report
Figure 83. Data Triangulation
Figure 84. Key Executives Interviewed